Vinyl Records

vinyl records
While in-store celebrations of Record Store Day have been postponed due to the coronavirus pandemic, RSD Drops, special titles coming to participating indie record stores, will take place on June 12 and July 17 of 2021.
Geographic reference: United States
Year: 2006, 2013, and 2020
Market size: $15.7 million, $210.7 million, and $619.6 million, respectively

For much of the 20th century, vinyl records dominated the recorded music industry. The first commercially-available long-playing vinyl record was introduced by RCA Victor in 1930. Even when other forms of recorded music were available in the 1970s, vinyl still held a majority of the market. In 1975, LP/EP sales accounted for 62.2% of sales, with vinyl singles garnering another 8.9% of the market. In the 1980s, as cassette tapes became more popular and compact discs (CDs) were introduced, sales of vinyl records plummeted from 71.1% of sales in 1980 to 8.8% of sales in 1989. 

Cassette tapes, introduced in the 1960s, offered music aficionados portability and durability. Consumers could record their favorite music from the radio to create on-the-go playlists and custom mixtapes. In 1983, the first CD players were sold in the United States. Initially few albums were released on the format and players retailed for $1,000; however, by 1988 CDs were so popular they outsold vinyl albums. CDs would go on to outsell cassette tapes in 1991.

Vinyl records did not completely disappear. In 1993, vinyl record sales totaled 300,000 units, or 1.6% of total recorded music sales volume and 0.1% of revenue. For much of the 1990s and early-to-mid 2000s, vinyl sales hovered around 1 million units, with peak sales of 1.5 million units sold in 2000. By 2005, CD sales in two major retail outlets were eclipsed by iTunes downloads as consumers found it more convenient and accessible to download music to their very small and portable iPods, some versions of which could store 2,000 or more songs. As popular as digital downloads were, streaming service revenue outpaced its sales by 2015. By 2018 many major retailers such as Best Buy and Target were discontinuing sales of CDs, but CDs still maintained a presence in 2020, selling 31.6 million units.

Meanwhile starting in 2006, vinyl record sales were increasing in popularity, especially among Millennials. Sales soared from 900,000 units in 2006 to 22.9 million units in 2020. Had it not been for a shortage of vinyl in 2020, sales may have gone higher. By 2020, vinyl record sales reached 5.1% of the $12.2 billion recorded music market (6.4% by volume), up from 0.1% in both revenue and volume in 2006.

What were the most popular vinyl LPs of the last decade? Abbey Road by the Beatles was number one, with 558,000 units sold between 2010 and 2019. Others in the top 8 include Dark Side of the Moon by Pink Floyd (376,000 units), Guardians of the Galaxy soundtrack (367,000), Legend by Bob Marley and the Wailers (364,000), Back to Black by Amy Winehouse (351,000), Thriller by Michael Jackson (334,000), Sgt. Pepper’s Lonely Hearts Club Band by the Beatles (313,000), and Rumours by Fleetwood Mac (304,000). For the first half of 2020, the top selling vinyl album was When We All Fall Asleep, Where Do We Go? by Billie Eilish.

Note: All sales figures are for new vinyl records.

Sources: “U.S. Sales Database,” The Recording Industry Association of America, 2021 available online here; Dillon Wallace, “When Did CDs Take a Front Seat to the Cassette Tape,” Aperture available online here; Aldo Svaldi, “Victrola Has Moved HQ to Denver,” Denver Post, March 18, 2021, pp. A9 and A11; “LP/Vinyl Album Sales in the United States from 1993 to 2019,” Statista, January 8, 2021 available online here; Joshua P. Friedlander, “Year-End 2020 RIAA Revenue Statistics,” February 2021 available online here; The Vintage Record, “The History of Vinyl,” American History Now, January 27, 2014 available online here; DJ Rob, “The Skinny (Or Maybe the Fat) on Vinyl in 2020 — and the Ten Best Selling Vinyl Records of 2020 So Far…” DJRobblog.com, July 11, 2020 available online here; Paul Riismandel, “More New CDs Than Vinyl Records Were Sold in 2020, Yet Again,” Radio Survivor, March 4, 2021 available online here; Felix Richter, “Classics Dominate LP Sales in the U.S.,” Statista, August 27, 2020 available online here; Felix Richter, “The Vinyl Comeback Continues,” Statista, January 15, 2021 available online here; Felix Richter, “From Tape Deck to Tidal: 30 Years of US Music Sales,” The Wire, March 7, 2021 available online here.
Image source: AliceKeyStudio, “turntable-vinyl-sound-music-1208177,” Pixabay, February 19, 2016 available online here.

Water-Related Recreation in Colorado

Maroon Bells in Aspen is one of many popular recreation spots in Colorado.
Geographic reference: Colorado
Year: 2019
Market size: $10.8 billion

When out-of-staters think outdoor recreation in Colorado, the first thing that may come to mind is skiing or snowboarding. Not surprising, considering Colorado is home to 30 ski resorts, including the world-renowned Aspen, Vail, and Telluride resorts to name just a few. But the recreational opportunities in this state go beyond these two winter sports. Today’s market size shows total revenues for water-related recreation in Colorado in 2019. Revenues include fuel, food, admission fees, lodging, and clothing and equipment used for the activities such as rods, reels, hiking boots, and trekking sticks. 

In this context, water-related recreation involves all recreational activities near waterways within Colorado’s nine river basins. It’s estimated that 6.7 million residents and non-residents participated in at least one form of recreation along a waterway in 2019. The Colorado Basin attracted the most recreation participants at 2.7 million, followed by the South Platte Basin (2.3 million), the Metro Area (1.9 million), the Arkansas Basin (1.6 million), and the Gunnison Basin (974,300). The Metro Area, Denver being the largest city located there, led the way in participation frequency with 28% of all days spent recreating along the water. 

What activity was the most popular? Trail sports with 2.7 million participants. Camping followed with 1.98 million participants, then picnicking/relaxing (1.79 million), water sports (1.64 million), and wildlife-watching (1.24 million). Snowsports ranked 7th with just over 1.1 million participants. In terms of days spent recreating, wildlife-watching ranked the highest, followed by trail sports and water sports.

Mountains, forests, high plains, rivers, plateaus, and canyons. Colorado has a variety of terrain on which to experience a multitude of recreational opportunities. In 2019, water-related recreation in the state supported 131,000 jobs, $6.3 billion in salaries and wages, and contributed $2.7 billion in tax revenue.

Sources: Economic Contributions of Water-Related Outdoor Recreation in Colorado, Business for Water Stewardship, June 2020 available online here; “Map of Colorado Ski Resorts,” SkiCentral available online here; “Watershed Reports,” Colorado River Watch available online here; “Maroon Bells,” Aspen Chamber Resort Association available online here.
Image source: Chaileefung0, “maroon-bells-mountain-lake-aspen-1640925,” Pixabay, September 3, 2016 available online here.
Home Bedding

home bedding
Geographic reference: World
Year: 2020 and 2028
Market size: $73.88 billion and $147.09 billion, respectively

A good night’s sleep. We all long for it and our health depends on it but many of us find it difficult to obtain. According to the American Sleep Apnea Association, an estimated 50 to 70 Americans are affected by sleep-related problems and the rate of sleep deprivation has increased over the past 3 decades. Today’s market size shows the total global revenues for an essential aspect to a good night’s sleep: home bedding. The figure for 2028 is projected. Home bedding includes bed linens, mattresses, pillows, and blankets.

Growth in the home bedding market is a result of several factors. The rising preference for low profile and adjustable beds is leading to higher demand for specialized mattresses and bed linens. New decorator trends, such as the currently popular minimalist style of grayscale color palettes, will increase demand for bed linens and blankets globally as people refresh their bedroom decor. Television programs are also having an influence on the bedding industry. The interest in the decor popularized by the show Bridgerton has soared. Since the show first aired, searches for Regency-era bedroom decor have gone up 81% on Google, according to a blog by Real Homes.1 The style of layering different textures and tones is causing demand to increase for cushions, bedsheets, and throws. As more people started working from home due to the coronavirus pandemic, creating a comfortable space to work and live became a priority, increasing demand for premium bedding and luxury pillows. In the United States in October 2020, spending on home bedding products increased 30% from a year earlier. Demand for all types of bedding products increased in 2020 as people in the United States took advantage of the low mortgage interest rates to buy first-time or second homes.

By type, bed linens held the highest share of the market in 2020 at 31.6%. This segment is also expected to experience the fastest growth through 2028. Consumers increasingly prefer quality linens made with sustainable materials for greater comfort, health, and durability. Organic cotton bedding, which is hypoallergenic due to the lack of chemical additives, has been gaining in popularity over the past decade. Other trends creating increased demand are customized home furnishings, festive and novelty patterned bedding sets, and weighted and chunky blankets.

Most bedding, 68.9%, was bought offline in brick-and-mortar stores in 2020. Many consumers prefer to shop in-store so they can see and feel the quality of the materials first-hand. Store displays of bedding create a unique experience for the customer that can’t be duplicated online. Retailers that offer discounted prices and sales on merchandise in-store also attract customers to their establishments. However, online sales are expected to grow at the fastest compound annual growth rate through 2028. The increasing preference for online shopping, especially during the pandemic, has led to increased sales of bedding online. Online shopping offers the convenience of shopping at any hour of the day and getting products shipped directly to a person’s door. Also, consumers can shop at a multitude of online retailers, increasing the selection of products they have to choose from. 

The Asia-Pacific region garnered 39.2% of the market in 2020 and is expected to experience the fastest growth through 2028. Expanding retail networks and a rise in the middle-class, homeownership, and the number of households are expected to contribute to this growth. In addition, increasing consumer preferences for luxurious and quality bedding will add to the demand for home bedding products. 

There are a large number of international and regional manufacturers of home bedding products worldwide. To remain competitive, companies are introducing new products and expanding their businesses into emerging markets. Some manufacturers are also partnering with retailers to reach more consumers. In 2018, mattress company Purple partnered with Mattress Firm to sell its products in-store. Previously, it sold its products exclusively online. Some leading companies in the home bedding market include Acton & Acton Ltd., American Textile Company, Beaumont & Brown Ltd., Boll & Branch LLC, WestPoint, Pacific Coast Feather Company, Hollander, Portico Inc., Crane & Canopy, and Bombay Dyeing.

1 The figure of 81% is as of January 17, 2021.

Sources: “Home Bedding Market Size, Share & Trends Analysis Report by Type (Bed Linen, Mattress, Pillows, Blankets), by Distribution Channel (Offline, Online), by Region, and Segment Forecasts, 2021 – 2028,” Grand View Research Report Summary, February 2021 available online here; “Home Bedding Market Size Worth $147.09 Billion By 2028 | CAGR: 9.0%: Grand View Research, Inc.,” CISION PR Newswire, March 10, 2021 available online here; Daria Solovieva, “Behind Real Estate’s Surprise 2020 Boom and What Comes Next,” Fortune, October 20, 2020 available online here.
Image source: ErikaWittlieb, “bed-bedroom-lamp-headboard-bedding-1078919,” Pixabay, December 7, 2015 available online here.

Champagne

champagne
May 16th is National Mimosa Day in the United States. Mimosas have just 2 ingredients: fruit juice and champagne.
Geographic reference: France
Year: 2010 and 2019
Market size: 319.5 million 750 ml bottles and 297.6 million 750 ml bottles, respectively

Today’s market size shows the number of bottles of champagne shipped in 2010 and 2019. Champagne is a sparkling wine from the Champagne region of northern France. In much of the world (although not in the United States), it’s illegal to label a product “champagne” unless the grapes and the wine that’s produced come from that region. It must also be produced under the regulations of the Champagne appellation. This drink is primarily made with pinot noir, Meunier, and chardonnay grapes. It comes in 7 levels of sweetness, from Brut Zero (0-3 grams of sugar per liter) to Doux (50 or more grams of sugar per liter). 

Champagne shipments fluctuated between 2010 and 2019, however, since 2017 shipments have trended downward, from 307.4 million bottles in 2017 to 297.6 million bottles in 2019. In 2019, 72.2% of champagne came from Champagne houses, up from 68.6% in 2010. A larger share of bottles came from cooperatives also, 9.2% in 2019 vs. 8.7% in 2010. A lower percentage of bottles shipped from wineries, however, 18.6% vs. 22.7%. Champagne houses are establishments whose main activity is the making of Grande Marque champagnes. They source most of their grapes from a variety of vineyards in the Champagne appellation. The grapes are vinified separately, then blended to replicate the specific taste a particular house is known for. The oldest Champagne house is Gosset located in Épernay. It was founded in 1584. As of 2019, there were 360 Champagne houses, 140 cooperatives, and 16,100 vineyards in the Champagne region of France.

From 1844 to 1917, France exported most of the champagne produced, in some cases exporting nearly eight times as much as shipped domestically. Between 1918 and 1930, some years saw more exports; others saw more domestic shipments. Since then, domestic shipments have been outpacing exports, however, starting in 2018, exports again took the lead.1 In 2019, exports represented 52% of total shipments. Most exports went to the United Kingdom, followed by the United States, Japan, Germany, Belgium, Italy, Australia, Switzerland, Spain, and Sweden. Nearly 75% of exports went to these 10 countries. Eighty-seven percent of total exports came from Champagne houses. Worldwide, leading brands include Veuve Clicquot, Möet & Chandon, Billecart-Salmon, Perrier-Joüet, Ruinart, Dom Perignon, GH Mumm, Krug, Bollinger, and Taittinger.

1 There were no shipments from 1940 to 1946 due to World War II.

Sources: Les Expéditions de Vins de Champagne en 2019, Comité Interprofessionnel du Vin de Champagne, April 2020 available online here; “Protection of the Champagne Name,” Champagne Bureau, USA, Comité Champagne available online here; Hamish Smith, “Brands Report 2021: Champagne,” Drinks International, January 6, 2021 available online here; “List of Champagne Houses,” Wikipedia, February 25, 2021 available online here; “Ranking by Turnover,” Grandes Marques & Maisons de Champagne available online here; “Shipments Since 1844,” Grandes Marques & Maisons de Champagne available online here; Hunter Robillard, “Champagne (Taste, Best Bottles, Prices 2021)”, Vinovest, January 22, 2021 available online here; “The Economy of Champagne: Key Market Statistics,” Comité Champagne available online here; “May Holidays,” National Today available online here.
Image source: Claudia Peters, “glasses-champagne-drink-prost-449011,” Pixabay, September 17, 2014 available online here.

Bakery Processing Equipment

cookies bakery processing equipment
Geographic reference: World
Year: 2020 and 2028
Market size: $12.92 billion and $20.24 billion, respectively

In the United States, May 15th is National Chocolate Chip Day. In a survey conducted by Top Worldwide LLC for NationalToday.com, 44% of people said that their favorite way of eating chocolate chips was in chocolate chip cookies. According to TasteAtlas, the chocolate chip cookie is the most popular cookie in North America. 

Chocolate chip cookies and many other baked goods for sale in retail establishments are made using bakery processing equipment. Today’s market size shows global revenues for this equipment in 2020 and projected for 2028. Cookies and biscuits held the third-highest market share in terms of end-use in 2020. Bread held the highest share, 35%, followed by cakes and pastries. Pizza crusts were 4th. Bread is expected to retain its lead due to high demand in North America and Europe and growing demand in India and China.

Ovens and proofers held a 34.2% market share in 2020 due to their extensive use throughout the packaged food manufacturing industry and the rising demand for baked goods. Low energy consumption ovens are expected to drive the market through 2028. Although dough sheeters are more expensive than other commercial bakery equipment, sales are expected to grow significantly over the next few years. Modern dough sheeters have variable speeds so they can be adapted to different dough types being manufactured. 

Increasing demand for packaged food products, including frozen meals, snack foods, and ready-to-eat products along with changing consumer lifestyles and tastes have led manufacturers to introduce new products catering to consumer preferences for taste, flavor, and nutrients. However, adding new products, with new ingredients, complicates the production process. As a result, manufacturers are investing in advanced bakery processing equipment that can handle a variety of ingredients and perform multiple functions. Demand for flexible bakery processing equipment is especially high in the North American region as manufacturers there offer limited edition, nostalgic, and seasonal products and need equipment that allow ingredients to be changed from batch to batch. Due to increasing energy, ingredient, and labor costs, bakery manufacturers are also interested in automated equipment that will improve their process efficiency and minimize food waste. 

The Asia-Pacific region held 37.1% of the market in 2020 and is expected to experience the highest growth through 2028. Increasing disposable income in the region, globalization, and the adoption of automated technology will contribute to growth. Rising investments in the food and beverage industry in China are also expected to contribute to higher revenues in this region. In Europe, Germany is the largest food producer and a major country in terms of bread and roll production and consumption. In 2018, baked goods, long-life bakery products, and confectionery represented 17.3% of the food and beverage industry. Increasing demand for healthy bread substitutes and packaged bakery products will contribute to growth in this region. In developing countries, rising demand for frozen baked goods, premium pastries, whole-grain baked goods, and healthy snacks and increasing adoption of advanced manufacturing technologies will contribute to revenue growth in the coming years. 

Major manufacturers of bakery processing equipment are investing in research and development in order to create equipment to enhance their customers’ productivity. In order to expand their product offering and cater to a broader range of customers, manufacturers are expanding capacity and geographical reach as well as focusing on mergers and acquisitions. Some leading global manufacturers of bakery processing equipment include Ali Group S.r.l., Baker Perkins Ltd., Bühler AG, GEA Group Aktiengesellschaft, The Middeby Corp., JBT Corp., Anko Food Machine Co. Ltd., Markel Food Group, Koenig Maschinen GmbH, and Heat & Control Inc.

Sources: “Bakery Processing Equipment Market Size, Share & Trends Analysis Report by Equipment (Ovens & Proofers, Molders & Sheeters), by Application (Bread, Pizza Crusts), by Region, and Segment Forecasts, 2021 – 2028,” Grand View Research Report Summary, February 2021 available online here; “Bakery Processing Equipment Market Size Worth $20.24 Billion by 2028: Grand View Research, Inc.,” CISION PR Newswire, March 1, 2021 available online here; “National Chocolate Chip Day — May 15, 2021,” National Today available online here; “Top 10 Most Popular North American Cookies,” TasteAtlas, January 23, 2021 available online here; Daniel Lindel, “Food and Beverage Industry: Supplying the Full Spectrum of Consumer Needs,” Food and Beverage Sector Industry News, Germany Trade & Invest, January 20, 2021 available online here.
Image source: Jason Jarrach, “Chocolate Chip Cookies Lined Up Making a Very Unique Texture,” Unsplash, February 22, 2020 available online here.

Comics and Graphic Novels in North America

comic books
Geographic reference: North America
Year: 2013, 2016, and 2019
Market size: $870 million, $1.08 billion, and $1.21 billion, respectively

Since 2002, Free Comic Book Day has been held on the first Saturday of May, however, due to COVID-19, the celebration has been moved to August 14th this year. On this day, comic book publishers, both majors and independents, make available for free specially-printed comic books at thousands of local comic shops across North America and the world. Free Comic Book Day was “founded on the belief that for every person out there, there’s a comic book they’ll love.”1

Today’s market size shows total North American revenues for comic books and graphic novels in 2013, 2016, and 2019. From 2013 to 2019 sales trended upward, rising 39.1%. However, not all years saw sales increases. Sales decreased by 6.5% from 2016 to 2017 before rising above 2016 levels in 2018. 

Graphic novels constituted most sales, $765 million or a 63.2% share in 2019. Since at least 2014 graphic novels have grown their share of the market. Comic book sales have been dropping since 2016 while digital comic sales have remained steady throughout this time period.

In 2019 for the first time, graphic novels sold in the book channel outpaced sales of graphic novels in the comic book store channel. The book channel includes chain bookstores, mass merchandisers, major online retailers, and Scholastic book fairs. Sales of children’s graphic novels drove the market. 

Sales of comic books and graphic novels in the book channel claimed 47.1% of the market, comic book stores 43.4%, digital downloads 7.4%, and other channels 2.1% in 2019. Newsstand sales and crowdfunding claimed nearly half of sales in the “other” category. Top comic book publishers by unit share included Marvel Comics (44.72%), DC (30.74%), Image Comics (7.69%), IDW Publishing (3.29%), Boom! Studios (2.42%), Dark Horse Comics (2.33%), Dynamite Entertainment (1.88%), Viz Media (0.55%), Titan Comics (0.49%), and Oni Press (0.43%). Other publishers claimed 5.47% of the market. The top-selling comic book in 2019 was Detective Comics #1000 and the top-selling graphic novel was Watchmen TP.

1 Source: “What is Free Comic Book Day?” Diamond Pop-Culture Network, November 8, 2018 available online here.

Sources: Heidi MacDonald, “Comics and Graphic Novel Sales Top 1.21B in 2019 — The Biggest Year Ever,” The Beat, July 15, 2020 available online here; “What is Free Comic Book Day?” Diamond Pop-Culture Network, November 8, 2018 available online here; Heidi MacDonald, “Comics/GN Sales Up 2.23% in 2019 as Watchmen and Detective Top the Charts,” The Beat, January 10, 2020 available online here;
Image source: tunechick83, “batman-comic-con-comics-books-2216148,” Pixabay, April 11, 2017 available online here.

Next Generation Sequencing

Next Generation Sequencing; DNAs double helix structure
On April 25, 1953, molecular biologist James Dewey Watson’s academic paper presenting DNA’s double-helix structure was published in the scientific journal, Nature.
Geographic reference: World
Year: 2020 and 2028
Market size: $3.99 billion and $11.7 billion, respectively

April 25th was National DNA Day. Events and celebrations commemorating the day are organized by the Human Genome Research Institute to encourage “people to learn more about the science that makes them genetically unique.”1 Why April 25th? On April 25, 1953, molecular biologist James Dewey Watson’s academic paper presenting DNA’s double-helix structure was published in the scientific journal, Nature. Francis Crick and Maurice Wilkins were co-authors. Almost 50 years to the day, on April 14, 2003, Human Genome Project scientists announced that the mapping of the human genome was complete.

Today’s market size shows total global revenues for next generation sequencing in 2020 and projected for 2028. Next generation sequencing (NGS), or massively parallel sequencing, describes a number of different modern sequencing techniques to directly determine the nucleic acid sequence of a DNA or cDNA molecule. NGS technology allows for the sequencing of DNA and RNA more quickly and cheaply2 with less DNA or RNA material needed than previous methods. Large-scale whole-genome sequencing can be done in one sequencing experiment. The Human Genome Project, which involved scientists at 20 institutions in France, Germany, Japan, China, the United Kingdom, and the United States, took 13 years to complete using the first-generation technique called Sanger sequencing. Sanger sequencing only sequences a single DNA fragment at a time. NGS sequences millions of fragments simultaneously. As a result, NGS may detect more novel or rare genetic variants.

NGS technology is popular among molecular biologists specializing in functional genomics. Functional genomics involves studying how genes function within a biological system, how genes interact with each other, and how genes interact with the environment. The oncology segment accounted for the largest share of revenues in 2020 at 28%. Leading companies are working toward an NGS-based diagnostics tool to detect cancer and analyze the genomic profiles of tumors to develop treatments for specific types of tumors. Some companies offer genetic testing to identify people who may be at higher risk of developing certain cancers. The development of targeted therapies, therapies targeted toward patients with specific or rare genetic biomarkers, is also increasing. 

The infectious disease segment of the industry is expected to be driven by the use of NGS technology to identify coronavirus strains. The technology is used to study the spread of COVID-19 and to map its evolution. The Covid-19 Genomics U.K. Consortium was formed in March 2020 to use Whole-Genome Sequencing (WGS) to analyze the coronavirus genome. Research is ongoing in the use of NGS technology to develop vaccines and therapies to treat the virus. WGS technology is expected to grow at a significant rate from 2021 to 2028 due to its use in tackling COVID-19.

Targeted sequencing and resequencing had a 73% revenue share in 2020. This is an economical alternative for WGS and allows for the in-depth investigation of genomic regions. RNA-based targeted sequencing is expected to have significant growth through 2028 due to the increasing demand for differential expression analysis. The use of this technology for the diagnosis of schizophrenia and other disorders and the increased availability of expression kits for customized panels are expected to contribute to its growth over this time period also.

Sequencing is a critical step in the genomics workflow. This segment experienced a 54% revenue share in 2020. Revenue in this segment is also expected to have the fastest compound annual growth rate through 2028 as the use of WGS increases. As the use of WGS increases, so too does the amount of data that needs to be analyzed. Increased spending on analysis and management tools for the sequenced data is expected to have a positive effect on revenue share.

Academic research had a 53% share in 2020, followed by clinical research, hospitals and clinics, and then pharmaceutical and biotech companies. Research accomplished at universities and research centers is expected to contribute to growth in the academic research sector through at least 2028. The clinical research segment is expected to grow the fastest from 2021 to 2028 due to the rising use of NGS-based diagnostic tests and the availability of commercial clinical research solutions from various companies. 

North America had a revenue share of 49.77% in 2020. The market was driven by several clinical laboratories that use NGS technology. Also, the development and launch of several new products using NGS technology are expected to increase market share through 2028. In August 2020, Quest Diagnostics started using the Automated NGS Engine to offer genetic risk screening for blood disorders, colon cancer, breast cancer, and heart diseases as part of AncestryHealth, a consumer genetics product of Ancestry. Although Ancestry decided to discontinue offering such tests in January 2021, Quest is continuing to develop applications that use NGS technology. The Asia Pacific region is expected to experience the fastest revenue growth through 2028 due to the presence of several leading NCS service providers in the region that offer their services to thousands of clinicians and hospitals across South Asia and India. 

The NGS industry is highly competitive. To gain market advantage companies have been focused on launching platforms that are rapid, small in size, and less expensive. In 2020 some companies introduced products to support research and development for COVID-19 vaccine development and products to sequence the complete genomes of viruses. Some leading companies in the NGS market include Illumina, QIAGEN, Thermo Fisher Scientific Inc., F. Hoffman-La Roche Ltd., Oxford Nanopore Technologies, Genomatrix GmbH, PierianDx, DNASTAR Inc., Eurofins GATC Biotech GmbH, Perkin Elmer Inc., BGI Genomics, and Bio-Rad Laboratories Inc.

1 Source: “National DNA Day — April 25, 2021,” National Today available online here.
2 In less than 20 years, the cost of sequencing the human genome dropped from $100 million to less than $1,000.

Sources: “Next Generation Sequencing Market Size, Share & Trends Analysis Report by Technology (Targeted Sequencing & Resequencing), by Application (Oncology, Consumer Genomics), by Workflow, by End-Use, and Segment Forecasts, 2021-2028,” Grand View Research Report Summary, February 2021 available online here; “Next Generation Sequencing Market Size Worth $11.7 Billion by 2028: Grand View Research, Inc.” CISION PR Newswire, February 23, 2021 available online here; “National DNA Day — April 25, 2021,” National Today, February 17, 2020 available online here; “Who Was Involved in the Human Genome Project?” your genome, June 13, 2016 available online here; “Ancestry to Discontinue NGS-Based AncestryHealth Service,” GenomeWeb, January 15, 2021 available online here.
Image source: Gerd Altmann, “dna-genetic-material-helix-proteins-3539309,” Pixabay, July 15, 2018 available online here.

Bubble Tea

bubble tea
Geographic reference: World
Year: 2019 and 2027
Market size: $2.1 billion and $4.2 billion, respectively

April 21st is National Tea Day in the United Kingdom. Founded in 2016 to inspire the world to drink more tea, this date was chosen because it is also Queen Elizabeth’s birthday. Worldwide, tea is the second-most consumed nonalcoholic beverage behind packaged water. National Bubble Tea Day was first celebrated on April 30, 2018, as a marketing strategy for Kung Fu Tea in New York. This bubble tea franchise currently has locations throughout most of the United States.

Today’s market size shows global revenues for the tea-based drink called bubble tea (or boba) for 2019 and projected for 2027. Bubble tea was invented in Tiachung, Taiwan in the early 1980s. Traditionally, it contained brewed tea, dairy milk, black tapioca pearls, and a sweetener such as honey or sugar. Newer varieties contain assorted flavorings and can be fresh-fruit-based. Milk-based bubble tea can contain soy milk, almond milk, or other non-dairy milk varieties. The chewy black tapioca pearls, made by boiling and steeping white tapioca pearls in caramelized sugar for hours, are what give bubble tea its name.1 There are currently more than 21,000 boba shops in Taiwan, and thousands more in North America, Europe, and other parts of Asia. Boba’s popularity began in earnest over the last decade as Instagram, the new word-of-mouth advertising, became popular in Taiwan. Since then, the variety of boba offered by shops has expanded greatly as these businesses compete to offer something new to attract customers.

Black tea held the highest market share in 2019 at 45%, perhaps because of it being the traditional tea used in the drink or because of its distinct taste. Green tea is expected to experience the fastest growth through 2027 as more people become aware of green tea’s health benefits, such as lowering blood pressure and cholesterol and decreasing the risk of certain cancers. However, boba may not be the best way to enjoy the health benefits of green tea. While the average 8-ounce boba contains just 120 calories with little to no fat, it also has 28 grams of sugar, and that’s not taking into consideration that some varieties of boba are made with pudding, yogurt, fruit, jellies, and syrups. Consumption of high levels of sugar increases one’s risk for obesity and diabetes.

Fruit-flavored boba held 37% of the market, the highest share in 2019, followed by classic and coffee flavors. Fruit-flavored boba is expected to maintain its lead through 2027 owing to shops offering a wide range of flavors such as strawberry, passionfruit, honeydew, avocado, coconut, and lychee among others to satisfy a wide range of tastes. Coffee is expected to be the fastest-growing flavor over this time period due to coffee’s popularity as a healthy energy drink especially in Europe and Scandanavia. 

Not surprisingly, the Asia Pacific region is the largest market with a more than 35% share, Thailand being one of the major consumers. The average consumption in this country is six cups per person per month. Europe is expected to experience the highest growth through 2027 with the United Kingdom, Germany, and Italy being some of the countries with the highest demand in the region. North America is also expected to experience steady growth during this time period.2 Major companies are focused on expanding their presence globally and to gain market advantage are launching new flavor and tea varieties. Major suppliers in this industry include Bobabox Ltd., Bubble Tea House Co., Bubble Tea Supply Inc., Fokus Inc., Lollicup USA Inc., and Troika JC Inc. Leading bubble tea shop franchises include Gong Cha, ChaTime, T BUN International, and Ten Ren’s Tea Time.

1 According to Leslie Nguyen-Okwu, a journalist based in Taipei, Taiwan, although there are differing accounts as to who exactly invented boba, “[t]he one thing that everybody agrees upon is that the name “boba” is a reference to the 1980s Hong Kong sex symbol Amy Yip, whose nickname, ‘Boba,’ is also a Chinese slang term for her most famous pair of physical assets.”
2 A surge in demand for products assembled abroad and a shortage of workers due to coronavirus cases and public health protocols have created problems in the global supply chain in 2021, leaving dozens of ships delivering goods from Asia waiting out to sea. This created a shortage of boba in the United States and Canada in the first half of the year. Fully formed boba comes from Taiwan and cassava root, which is used to make tapioca, comes from Taiwan and islands in the Pacific Ocean. Low supply has led to supplier rationing and some shops had already run out of boba by April. As Brian Tran, co-owner of Honeybear Boba in San Francisco states: “A boba shop without boba is…like a steakhouse without steak.” While some customers may leave without buying anything, it may be an opportunity for others to try new toppings in their tea. Supplies weren’t expected to return to normal until the summer. Source: Kellen Browning, “Another Unlikely Pandemic Shortage: Boba Tea,” The New York Times, April 16, 2021 available online here.

Sources: “Bubble Tea Market Size, Share & Trends Analysis Report by Product (Black, Green, Oolong), by Flavor (Classic, Coffee, Fruit), by Region (APAC, North America, Europe, MEA), and Segment Forecasts, 2020 – 2027,” Grand View Research Report Summary, June 2020 available online here; “Bubble Tea Market Size Worth $4.2 Billion by 2027 | CAGR 8.9%: Grand View Research, Inc.,” CISION PRNewswire, June 11, 2020 available online here; Leslie Nguyen-Okwu, “Boba Explained: Types of Bubble Tea, and How to Order,” Eater, March 16, 2019 available online here; “National Tea Day — April 21, 2021,” National Today available online here; “Boba Tea: Are There Health Benefits?” WebMD available online here; “Bubble Tea,” Wikipedia, February 26, 2021 available online here; Kellen Browning, “Another Unlikely Pandemic Shortage: Boba Tea,” The New York Times, April 16, 2021 available online here.
Image source: Hiroaki Kaneda, “boba-pearl-milk-tea-boba-milk-tea-4402053,” Pixabay, August 13, 2019 available online here.

Peaches

peaches
Geographic reference: United States
Year: 2017, 2018, and 2019
Market size: $599.9 million, $511.2 million, and $518.9 million, respectively

In the United States, April 13th is National Peach Cobbler Day. The day was invented in the 1950s by the Georgia Peach Council in order to sell more canned peaches. However, dessert cobblers have been around since the 19th century. These dishes were invented by settlers as they traveled westward in the early 1800s. Pies were popular among English and Dutch immigrants and fruit was readily available in the Eastern United States, but not having the ingredients and the ability to properly bake a pie as they traveled westward, settlers made do with what they had: fruit of some sort (preserved, canned, or dried) and biscuit dough. The ingredients were cobbled together in a Dutch oven and baked over an open fire until the dough was golden brown. The dish was eaten as breakfast or as a first or main course then. In the late 19th century, the cobbler was officially declared a dessert. 

Today’s market size shows the value of utilized peach production in the United States in 2017, 2018, and 2019. In these years, production totaled 694,220; 638,020; and 658,830 tons, respectively. Since 2017, fewer peaches produced have gone to the fresh market. Processed peaches have increased their share of the market from 54.7% of the utilized crop in 2017 to 60.1% in 2019. 

By far, California was the top state in terms of production, 495,000 tons, in 2019, with 53.1% being the clingstone variety. South Carolina was second with 63,700 tons, followed by Georgia (33,780 tons), Pennsylvania (19,080), New Jersey (17,980), Colorado (13,300), Washington (11,040), and Michigan (4,800).1 Top peach producers in the United States include Titan Farms and J.W. Yonce and Sons in South Carolina and Taylor Orchards, Dixie Bell Orchards, Lane Southern Orchards, and Pearson Farm in Georgia.2

Worldwide, the production of peaches (and nectarines) totaled 25.7 million tons in 2019. China produced the most, 15.8 million tons, or 61% of world production.3 Spain ranked second in production with 1.5 million tons, followed by Italy (1.2 million), Greece (926,620), and Turkey (830,057). The United States ranked 6th, producing 739,900 tons of peaches and nectarines.

1 Starting in 2018, estimates were discontinued for 12 of the 20 states the National Agricultural Statistical Service tracked previously. These states include, in order of 2017 utilized production, West Virginia, Illinois, Idaho, New York, Ohio, Maryland, Virginia, Utah, Texas, Missouri, North Carolina, and Alabama.
2 Source: Christina Herrick, “American and Western Fruit Grower’s 2014 Top Stone Fruit Growers,” Growing Produce, September 13, 2014 available online here. Most recent data available. The source gives a ranking of the top 25 stone fruit growers in the United States. Data used in this market size post are for stone fruit growers whose only stone fruit crop is peaches.
3 Source: “FAOSTAT: Crops,” Food and Agriculture Organization of the United Nations available online here. Data were downloaded on February 23, 2021. The source reports data for both peaches and nectarines combined. Peaches and nectarines are almost identical genetically. Peaches have a dominant gene variant that causes them to have a fuzzy coating. Nectarines have a recessive gene that causes their smooth skin.

Sources: “Noncitrus Fruits and Nuts 2019 Summary,” United States Department of Agriculture, National Agricultural Statistical Service, May 2020 available online here; Alexia Wulff, “A Brief History of Peach Cobbler,” Culture Trip, November 23, 2016 available online here; “FAOSTAT: Crops,” Food and Agriculture Organization of the United Nations available online here; Christina Herrick, “American and Western Fruit Grower’s 2014 Top Stone Fruit Growers,” Growing Produce, September 13, 2014 available online here; Christine Gallary, “What’s the Difference Between Peaches and Nectarines?” Kitchn, July 20, 2015 available online here.
Image source: Flockine, “peach-fruit-fruits-peach-tree-bio-2632182,” Pixabay, August 11, 2017 available online here.

Yoga Mats

Yoga mats
Geographic reference: World
Year: 2019 and 2026
Market size: $14.29 billion and $23.3 billion, respectively

April 7, 2021 is World Health Day. Established as one of the first official acts of the World Health Organization in 1949, it’s a day to promote and celebrate physical, mental, and emotional well-being worldwide. 

A growing number of people around the globe are incorporating yoga into their health and wellness routine. Practiced in India for thousands of years, yoga is a spiritual discipline that focuses on bringing harmony between mind and body, Man and Nature, with the ultimate goal being the “union of individual consciousness with that of the Universal Consciousness,” according to Dr. Ishwar V. Basavaraddi of the Ministry of External Affairs for the Government of India.1 The word “yoga” is derived from the Sanskrit root “yuj” which means “to join” or “to unite”.

Currently there are more than 300 million practitioners around the world with 50% being in India, although it is becoming less popular with younger generations there. In other parts of the world, yoga’s popularity has been on the rise in recent years with interest growing yearly. In Canada 1 in 5 people practice yoga. In the United States, about 1 in 10 do, with 37% of parents who practice reporting their children practice also.

Traditional yoga practice focuses more on the meditative aspect and as a consequence incorporates few standing poses. Modern yoga, with its wide variety of standing poses, is considered more of a physical wellness tool with a meditative component. There are more than 100 types of yoga being practiced around the world. Most people who start practicing yoga say they want to improve their flexibility. Other reasons for beginning the practice include stress relief and becoming mentally and physically stronger, healthier and fitter.

As stay-at-home orders became widespread and gyms and fitness centers closed during the coronavirus pandemic, people were finding ways to exercise at home and relieve stress. Home fitness equipment sales skyrocketed, with e-commerce sales of yoga equipment soaring 154% in 2020 compared to 2019. Today’s market size shows revenues for one type of yoga equipment, the yoga mat, for 2019 and projected for 2026. Unsurprisingly, the Asia-Pacific region held the highest market share in 2018.2 This was due to an increasing number of yoga practitioners in India, China, Japan, and Australia.

Yoga mats made of PVC (polyvinyl chloride) accounted for more than a third of the market in 2018. Its widespread availability and relatively low cost contributed to its popularity among consumers. However, revenues for cotton/jute mats are expected to grow at the fastest compound annual growth rate through 2026 as consumers seek eco-friendly products made of natural materials.

Specialty stores garnered more than half of the global revenue in 2018 and are expected to continue to have the highest market share by far through 2026. Customers prefer the guidance offered at these establishments which allows them to choose the accessories that are right for them. An increasing number of specialty stores, especially in China, South Korea, and Australia, is also contributing to a high market share in this sector. E-commerce is expected to be the fastest-growing distribution channel over this time period due to increasing internet access worldwide, the ability to comparison-shop, the availability of products, and the convenience of shopping 24/7. E-commerce had the third-highest market share in 2018, behind supermarkets and hypermarkets. By 2026, e-commerce’s share is expected to rank number two. Leading global manufacturers of yoga mats include Manduka, Jade Fusion, prAna, Hugger Mugger, Adidas, Lululemon Athletica, Ecoyoga, Aurorae Yoga LLC, Eupromed, and Yaazhtex.

The household segment held the highest share of the market before the pandemic and will likely continue to do so during and after. Forecasts initially predicted that the health club and fitness center sector would experience the fastest growth through 2026 due to an increasing number of health clubs and fitness centers opening and more and more of them offering yoga classes. However, this may not be the case in the near future. During the beginning of the pandemic, these types of businesses were shut down due to health concerns. As of September 30, 2020, in the United States, 15% closed permanently. In November, IHRSA, the International Health, Racquet and Sportsclub Association, predicted that 25% of facilities would close permanently by the end of 2020. By the fourth quarter of 2020 and continuing through the beginning of 2021, some health clubs and fitness centers were allowed to open at reduced capacity but even after reopening, revenue continued to decline and membership was down an average of 70%. Revenue and membership declines relative to 2019 levels are expected to continue through 2021. It remains to be seen what the fitness industry will look like post-pandemic in 2022 and beyond and how this will affect yoga mat sales going forward.  

1 Source: Dr. Ishwar V. Basavaraddi, “Yoga: Its Origin, History and Development,” Ministry of External Affairs, Government of India, April 23, 2015 available online here.
2 Source: Shankar Bhandalkar and Roshan Deshmukh, “Yoga Mat Market by Material (PVC, TPE, Rubber, Cotton/Jute, and Others), End User (Yoga & Fitness Clubs, Household, and Others), and Distribution Channel (Supermarket/Hypermarket, Specialty Stores, Ecommerce, and Others): Global Opportunity Analysis and Industry Forecast, 2019–2026,” Allied Market Research Report Summary, February 2020 available online here. A July 2019 report by Grand View Research states that North America held the highest market share in 2018. The discrepancy may be due to the date of publication and scope of each report.

Sources: “COVID-19 Impact on Yoga Mat Market 2020 Global Analysis, Market Size, Share, Key Players, Trend, Opportunity and Revised Forecast Till 2026,” Wall Street Call, May 14, 2020 available online here; “World Health Day — April 7, 2021,” National Today available online here; Aleksandar Hrubenja, “Yoga Statistics and Facts: 2021 Edition,” Modern Gentlemen, November 30, 2020 available online here; Dr. Ishwar V. Basavaraddi, “Yoga: Its Origin, History and Development,” Ministry of External Affairs, Government of India, April 23, 2015 available online here; “COVID-19’s Impact on the Yoga Industry – Yoga Equipment Witnesses Growth of 154%,” GlobeNewswire, May 6, 2020 available online here; Randi Gollin, “Online Shopping Gains Momentum,” American Express Credit Intel, October 28, 2020 available online here; Sanela Puac, “30 Fresh Yoga Statistics & Facts You Should Know in 2021,” Loud Cloud Health, January 5, 2021 available online here; Melissa Rodriguez, “One in Four Health & Fitness Clubs Could Close by Year-End,” IHRSA, November 30, 2020 available online here; Shankar Bhandalkar and Roshan Deshmukh, “Yoga Mat Market by Material (PVC, TPE, Rubber, Cotton/Jute, and Others), End User (Yoga & Fitness Clubs, Household, and Others), and Distribution Channel (Supermarket/Hypermarket, Specialty Stores, Ecommerce, and Others): Global Opportunity Analysis and Industry Forecast, 2019–2026,” Allied Market Research Report Summary, February 2020 available online here; “Yoga Mat Market Size, Share & Trends Analysis Report by Material (Cotton/Jute, PVC, TPE, Rubber, PE), by Distribution Channel (Specialty Store, Online Channel), by Region, and Segment Forecasts, 2019 – 2025,” Grand View Research Report Summary, July 2019 available online here.
Image source: bmwalkiewicz, “yoga-exercise-mats-3967979,” Pixabay, February 1, 2019 available online here.

SPACs, The Newest Investment Craze

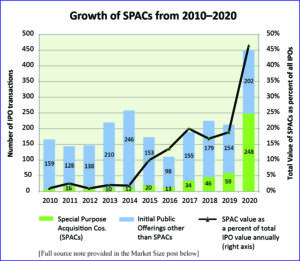
Click on the graph to see full size image.
Geographic reference: World
Year: 2015 and 2020
Market size: based on market capitalization — $3.902 billion and $83.341 billion, respectively

What are SPACs? The acronym stands for special-purpose acquisition companies and they are what is also known in the investment world as “blank check” companies or shell companies listed on the stock exchange with the sole purpose of acquiring private companies wishing to go public. A SPAC provides an investment vehicle for a group of investors (and/or private equity firms) and can provide a private company that merges with it a means of going public without having to go through an initial public offering (IPO) process.

While SPACs have existed since 1993—when the first one was created by the investment bank GKN Securities as a means of skirting the then prohibition to blank check companies on the U.S. Stock Exchange—they have only recently risen to prominence with blue-chip investors and become fashionable investment vehicles. Worth noting, the first SPAC listed in Europe, on the Euronext Amsterdam exchange, was Pan-European Hotel Acquisition Company N.V. in 2007.

As the chart above shows, SPACs grew from representing 1 percent of the value of all U.S. IPOs in 2010 to representing nearly half (46.5%) in 2020, and in terms of the number of transactions, SPACs exceeded half in 2020, reaching 55 percent of all new entrants to the U.S. Stock Exchange. More than $80 billion were invested in SPACs in 2020 compared with $13.6 billion the year before. During the first two months of 2021 alone, another $77 billion came into the market through the formation of new SPACs.

All this activity has drawn attention. Short sellers, who bet against a stock’s performance, began in 2021 to target SPACs more heavily. This combined with anticipated increased scrutiny of SPACs by the incoming Biden Administration’s new Securities and Exchange Commission (SEC) Chairman, Gary Gensler suggests that the recent surge in the SPAC market will cool. But, as of the middle of March money is still pouring into SPACs every day, to the tune of millions of dollars a day, something easily monitored at this Stock Market MBA website.

Sources: Mike Bellin, IPO Services Co-Leader, PwC US, “Why Companies are Joining the SPAC Boom,” PwC United States, published on September 22, 2020 and available online here; Matt Wirz and Juliet Chung, “Short Sellers Target SPACs,” The Wall Street Journal, March 15, 2021, page 1.
Image source: Graph was produced in-house with data keyed from the website of SPAC Investments Ltd. on March 15, 2021 available online here.

Bottled Water

Bottled water
Geographic reference: World
Year: 2020 and 2028
Market size: $217.66 billion and $505.19 billion, respectively

March 22nd is World Water Day. Created by the United Nations, it’s a day dedicated to bringing awareness about the millions of people around the world who don’t have access to clean, safe drinking water. It is also dedicated to bringing awareness about other water-related issues affecting humans from poor sanitation to the effects of prolonged drought. Every living being on this planet needs clean water to live. Unfortunately, 785 million people globally lack access to clean water and 2 billion people, 1 in 3, lack access to adequate sanitation.

The World Water Day theme for 2021 is Valuing Water. “In households, schools, and workplaces, water can mean health, hygiene, dignity, and productivity. In cultural, religious, and spiritual places, water can mean a connection with creation, community, and oneself. In natural spaces, water can mean peace, harmony, and preservation.”1 For some, water is a commodity to be sold for a profit. Today’s market size shows the total global revenues for bottled water in 2020 and projected for 2028. Revenues are expected to increase by 132.1%.

Portability, convenience, and growing health consciousness among consumers are contributing to growth in the market. Younger generations, especially, prefer bottled water over tap water. As a result, more and more restaurants are offering their patrons bottled water with their meals. As government restrictions meant to slow the spread of the COVID-19 virus took hold — stay-at-home orders and the closing of restaurants, especially — demand for bottled water surged among households as many consumers became more aware of health and hygiene practices.

The purified water segment had the highest market share in 2020, 35%. Increasing global population, increasing per capita consumption of water, urbanization, and economic development in addition to decreasing potable water supplies due to a changing climate and contamination will lead to increasing demand for purified water derived from desalination plants. As of 2018, there were nearly 16,000 desalination plants in 177 countries around the world.

Sparkling water, holding the 4th highest market share in 2020, behind spring water and mineral water, is expected to be the fastest-growing segment through 2028. Growth in demand is expected to come mainly from the United States, France, Canada, Germany, and the United Kingdom. 

The Asia-Pacific region held 42% of the global market for bottled water in 2020, the highest revenue share. Through 2028, this region is also expected to be the fastest-growing market driven mainly by a preference for bottled water due to health concerns about consuming contaminated water. Several governments in the region are investigating desalination as a way to produce fresh water. In 2017, India and Israel partnered to promote India’s desalination technology. This government-led initiative is expected to contribute to growth in the industry at least through 2028. A combination of changing consumption habits, a more organized retail sector, and the introduction of new products, especially flavored waters, are also expected to contribute to industry growth in this region over the next decade. 

Most bottled water manufacturers are large corporations, although there are also some smaller and medium-sized businesses in the industry. Some major manufacturers include Nestlé, PepsiCo, The Coca-Cola Company, Danone, Primo Water Corp., FIJI Water Company LLC, Gerolsteiner Brunnen GmbH & Co. KG, Voss Water, Nongfu Spring, and Rhodius Mineralquellen Und Getranke GmbH & Co. KG. Companies such as Nestlé, PepsiCo, The Coca-Cola Company, Danone, and Rhodius Mineralquellen Und Getranke GmbH & Co. KG have diversified product portfolios with bottled water being only one segment of their business. 

In the United States in recent years, bottling companies have faced lawsuits and potential restrictions over the bottling of groundwater as drought becomes more of a problem. A bill introduced in Washington State in 2020 would ban all bottling of groundwater in the state. According to Mary Grant, a water policy specialist with the environmental group Food and Water Watch, “the Washington state bill is groundbreaking. As water scarcity is becoming a deeper crisis, you want to protect your water supply so it goes for local purposes. [Bottled water] is not an industry that needs to exist.”2 However, while most of the bottled water in the United States came from groundwater two decades ago, that is not the case today. In 2000, 67% of bottled water sold was spring water, water that comes from underground aquifers. By 2018, purified water constituted nearly that same percentage sold. Purified water is tap water that has undergone extra filtering. The Washington state bill does not address bottling from this type of water source. Few would argue that in some cases bottled water is necessary when a safe water supply is not available. This could be due to a natural disaster, or when a private well or public water system is deemed unsafe or is unavailable. While environmentalists and municipal and state government leaders debate the issue, consumers are adding their voices to the conversation at the cash register. Bottled water sales have been on the rise since 2010 and in 2016, bottled water became the top packaged beverage sold in the United States.3

1 Source: “Learn: Valuing Water,” UN Water 22 March World Water Day: 2021 Valuing Water available online here.
2 Source: Alex Brown, “Lawmakers Open Groundwater Fight Against Bottled Water Companies,” Pew, February 12, 2020 available online here.
3 Despite no shortage of safe drinking water in most of the United States, and assurances by authorities that the virus was not in drinking water, at the start of the coronavirus pandemic people hoarded bottled water along with toilet paper, hand sanitizer, and cleaning supplies. Bottled water sales soared 57% in March 2020 compared to March 2019.

Sources: “Bottled Water Market Size, Share & Trends Analysis Report by Product (Purified, Mineral, Spring, Sparkling, Distilled), by Region (North America, Asia Pacific, Europe, CSA, MEA), and Segment Forecasts, 2021 – 2028,” Grand View Reserach Report Summary, January 2021 available online here; “Learn: Valuing Water,” UN Water 22 March World Water Day: 2021 Valuing Water available online here; “The Water Crisis,” Water.org available online here; “World Water Day — March 22, 2021 available online here; Alex Brown, “Lawmakers Open Groundwater Fight Against Bottled Water Companies,” Pew, February 12, 2020 available online here; Ryan Felton, “How Coke and Pepsi Make Millions From Bottling Tap Water as Residents Face Shutoffs,” Consumer Reports, July 10, 2020 available online here; “Bottled Water: Questions and Answers,” Minnesota Department of Health available online here; Andrew Ba Tran and Alvin Chang, “Bottled Water: Where It Comes From and What It Means,” Boston Globe available online here; “Press Release: Bottled Water, The Largest Beverage in the U.S., Continues to Grow,” Beverage Marketers Association, May 29, 2019 available online here.
Image source: congerdesign, “bottle-mineral-water-bottle-of-water-2032980,” Pixabay, February 3, 2017 available online here.

Medical Foods

liquid medical foods
In 2020, more than 70% of medical foods were administered orally and more than half were in liquid, semi-liquid, or solid form.
Geographic reference: World
Year: 2020 and 2028
Market size: $20.15 billion and $30.34 billion, respectively

“An apple a day keeps the doctor away.” Most of us are familiar with this quaint expression from 1913. Although research studies have confirmed that an apple a day does not, in fact, result in fewer doctor’s visits, almost everyone can agree that eating nutrient-dense foods such as apples and other fruits, vegetables, whole grains, and various types of proteins can lead to a healthier life. 

But, what happens when a person cannot tolerate many of these healthy foods due to age or a chronic medical condition? In that case, physicians may prescribe medical foods so that their patients can continue to get the nutrition that they need. “Medical foods are foods that are specifically formulated and processed for a patient who requires [the] use of the product as a major component of a disease or condition’s specific dietary management.”1 In 2020, more than 70% of medical foods were administered orally. They can also be administered enterally through a feeding tube. They are always used under medical supervision. Sales at institutions such as hospitals, clinics, and care centers had the highest revenue share in 2020. Today’s market size shows total global revenues for medical foods in 2020 and projected for 2028.

Major contributing factors to growth in this market are the growing prevalence of malnutrition and diabetes worldwide. According to the World Health Organization, 462 million adults are underweight. Medical foods are considered the first choice to provide nutrients to malnourished patients. The number of people with diabetes has been increasing, reaching 463 million adults in 2019. By 2045, the number of adults with diabetes is projected to be 700 million. About 60-70% of diabetics suffer from neuropathy, damage to the nerves outside of the brain and spinal cord. The risk for neuropathy increases with age, unhealthy lifestyles, and poor nutrition. Medical foods for the prevention and treatment of diabetic neuropathy held the highest share of the market in 2020. 

Other conditions that may require medical foods include neurological conditions such as cystic fibrosis, stroke, and dementia which causes difficulty in swallowing; Crohn’s disease and ulcerative colitis which inhibit nutrient absorption from conventional foods; chemotherapy-induced diarrhea; and chronic kidney disease among others. Revenues for medical foods geared toward patients with chronic kidney disease are expected to have the highest compound annual growth rate (CAGR) through 2028 due to the rising incidence of chronic kidney disease, especially in those 65 years old and over, and patients’ changing nutritional needs. 

Due to their commercial availability and their ease of consumption, more than half of medical foods sold are in liquid, semi-liquid, or semi-solid form. The market share for liquid formulations is expected to increase due to this form being preferred by both the geriatric and pediatric populations. Some of the examples of liquid formulations are Nutrison Energy by Danone, Glucerna Therapeutic Nutrition Shake by Abbott Nutrition, and Novasource by Nestlé Nutrition. Revenues for powder formulation are expected to grow at the highest CAGR through 2028. Powder formulations are easy to administer and are convenient, having a longer shelf-life than other non-pill formulations, do not require refrigeration, and may be less expensive. Medical foods in pill form constitute the smallest market share.

By region, North America had the highest market share in 2020, 29.9%. The presence of leading companies in the industry along with an increasing prevalence of chronic conditions and a willingness by health care professionals and patients to utilize medical foods will lead to growth in this region. The Asia-Pacific region also has a strong presence from companies in this industry. As well, incidences of diabetes, malnutrition, obesity, cancer, and cardiovascular diseases are on the rise. Combined, the regions of North America, the Asia-Pacific, and Europe held more than three-quarters of the global market share in the medical foods industry.

In addition to the companies mentioned earlier, other leading companies in this industry include Fresenius Kabi AG, Targeted Medical Pharma Inc., Primus Pharmaceuticals Inc., Mead Johnson & Company LLC, and Metrition Inc. Primus Pharmaceuticals is the “first and only company specializing in prescription medical nutrition.”2 The company is headquartered in Scottsdale, Arizona.

1 Source: “Frequently Asked Questions About Medical Foods; Second Edition,” U.S. Department of Health and Human Services, Food and Drug Administration, Center for Food Safety and Applied Nutrition, May 2016 available online here. Only the United States and Europe have clear guidelines for medical foods defined by regulatory agencies.
2 According to the company’s website here.

Sources: “Medical Foods Market Size, Share & Trends Analysis Report by Route of Administration, by Product (Pills, Powder), by Application, by Sales Channel, by Region, and Segment Forecasts, 2021 – 2028,” Grand View Research Report Summary, January 2021 available online here; “Medical Foods Market Size Worth $30.34 Billion by 2028 | CAGR: 5.2%: Grand View Research, Inc.,” CISION PR Newswire, February 3, 2021 available online here; “Frequently Asked Questions About Medical Foods; Second Edition,” U.S. Department of Health and Human Services, Food and Drug Administration, Center for Food Safety and Applied Nutrition, May 2016 available online here; Rachael Link, “An Apple a Day Keeps the Doctor Away — Fact or Fiction?” Healthline, July 6, 2020 available online here; “Serving the Underserved…Safely,” Primus Pharmaceuticals available online here.
Image source: tookapic, “milk-liquid-flowing-pouring-bottle-933106,” Pixabay, October 7, 2015 available online here. Picture is used for illustration purposes only. Milk is not considered a medical food.

Landline Phones

For more information about the telephone industry over time, see Market Share Reporter: Trends Over Time
Geographic reference: United States
Year: 2020 and 2025
Market size: $1.03 billion and $1.10 billion, respectively

In the United States, March 10th marks National Landline Telephone Day. So, in the spirit of the “holiday,” this week’s post is dedicated to this aging and slowly disappearing technology. Today’s market size shows landline telephone revenues in 2020 and projected for 2025.1 While it may seem to many that almost everyone has “cut the cord” and gotten rid of their landline phones in favor of cell phones, this is far from the case. In 2019, 39.7% of U.S. adults were living in a household with a working landline. Of course, this is considerably less than the 92.7% in 2004. The percentage of adults living in cell phone only households rose from 5.0% in 2004 to 59.2% in 2019.

Despite predictions that landlines would be obsolete by 2020, they are still being used in millions of households and businesses across the U.S. Why? While younger adults may be more comfortable using smartphones, many older adults prefer landlines — a simple phone without all the bells and whistles they may not need, want, or understand how to use. As of June 2019, 11.4% of people 65 years old and older relied on a landline. People who have a lower income may find that keeping a single landline is less expensive than paying for cell phone service. Some people and businesses keep landlines because their security systems rely on them. Older elevators may require landlines for their emergency phones. Some people retain their landline in case of emergencies. Since a landline is linked to a specific address, when someone calls 911 the dispatcher will know exactly where the caller is calling from even if that person cannot communicate. A cell phone’s GPS cannot do that. Landline, corded phones will not become inoperable when there is a power or internet outage as cellular, fiber optic, and VoIP phones can.2 It is for these reasons the National Emergency Number Association recommends people with disabilities and those with medical conditions have a traditional landline phone. Some people keep landlines because they offer better call quality than cell phones. In rural areas where cell phone service is nonexistent or spotty, landlines provide reliable phone service.

With more and more customers “cutting the cord,” maintaining landline phone infrastructure for fewer and fewer customers scattered throughout the U.S. is getting increasingly more expensive for telecommunications companies. In 2017, it was estimated that companies spent $13.5 billion to maintain this infrastructure. While some companies still offer traditional, wired landline services, some companies are charging much higher prices than they did in the past for this service. According to the U.S. Bureau of Labor Statistics, in urban areas, landline service costs rose 26% from July 2010 to July 2020 while cell phone services decreased 23%. Other companies offer customers landline service only if it’s bundled with cell phone, internet, and TV services. Others still only offer fiber optic or VoIP phone service, providing phone service over the same lines that provide customers with internet service. For at least a decade, telecommunications companies have set dates for when they would discontinue all traditional, wired landline services in the United States. In 2017, legislatures in 20 states voted to allow AT&T to discontinue landline service in their states completely. In Illinois alone, this would’ve affected 1.2 million customers. Until reliable cell phone or internet phone service can be obtained in every home and business in the country, any discontinuation of service will have detrimental effects on individuals and businesses. They’ll not only be losing a way to communicate with friends, family, and customers but they’ll also be losing a reliable way to call for help in an emergency. 

1 The U.S. Centers for Disease Control considers VoIP phones landline phones.
2 In some cases, companies offer battery back-up options for power outages or options to switch internet-based phones to cellular service if there is an internet outage.

Sources: “Landline Phones,” Statista available online here; “March Holidays,” National Today available online here; Felix Richter, “Landline Phones are a Dying Breed,” Statista, June 15, 2020 available online here; Krystal Steinmetz, “Landline Phones Disappearing in These 20 States,” MoneyTalksNews, June 5, 2017 available online here; Robert Channick, “AT&T Ready to Hang Up on Traditional Landline Phone Service in Illinois,” Chicago Tribune, May 4, 2017 available online here; Dennis Peng, “Are Copper Phone Lines Going Away?” Ooma Blog, February 14, 2019 available online here; John R. Quain, “Is It Safe to Get Rid of Your Landline?” AARP, August 25, 2020 available online here; “Why Nearly 46 Percent of Households Still Have Landlines,” New York Post, May 4, 2017 available online here; “Landlines Predicted Obsolete by 2020; ULTATEL Explains What This Means for Businesses,” Markets Insider, July 16, 2018 available online here; “POTS (Plain Old Telephone Service) is Going Away. What’s Your Plan for the Future?” Broad Sky Networks, December 23, 2019 available online here; “Find Home Phone Services,” allconnect available online here.
Image source: Katrin Hauf, “Old Style Telephone,” Unsplash, March 25, 2020 available online here.

Book Sales in China

book store in China
Geographic reference: China
Year: 2020
Market size: 97.08 billion yuan

书是随时携带的花园
shū shì suí shí xié dài de huā yuán
A book is like a garden carried in the pocket.
Chinese proverb

Today’s market size shows total book revenues in China in 2020. As many industries suffered revenue losses due to the coronavirus pandemic, so too did the book industry in China. Revenues were down 5.19 billion yuan from 2019, or 5.08%. This was the first time the market declined since tracking began in 2001. By contrast, the market saw double-digit growth each year from 2015 to 2019.

In 2019, 70% of retail book sales took place online, up from 28% in 2012. The first year that online sales overtook brick-and-mortar sales was in 2016. Rising book prices along with larger online discounts offered by publishers have contributed to this trend. Online discounts averaged between 38% and 41% while brick-and-mortar discounts averaged 11%. 

Revenues at physical bookstores have seen mixed results since 2015. Revenue grew in both 2015 and 2017 but declined in all the other years. The declines stayed in the single digits until 2020 when revenues plunged 33.8%. Government shutdowns to prevent the spread of the coronavirus took their toll on brick-and-mortar establishments in China and elsewhere around the world. Online sales growth from 2015 to 2019 had been in the double-digits each year, peaking at 33.2% in 2015. Growth stood at 24.9% in 2019. While online sales continued to grow in 2020, growth slowed dramatically to 7.27%. 

Recently, Chinese publishers have been producing fewer titles as they focus on higher-quality works. In 2019, 194,000 new titles were released, down 6.7% from 2018. In total, more than 505,000 titles were published in China that year. Nonfiction publishers with books ranked in the top 10 of the bestseller list as of November 20201 include Hainan Publishing House, Nan Hai Publishing Co., Beijing Union Publishing Co. Ltd., Wenhui Publishing House, Huaxia Publishing House, CITIC Publishing House Co. Ltd., Human Literature & Art Press, and Jiangsu Literature & Art Press. Fiction publishers with books in the top 10 include Chongqing Publishing House, October Art & Literature Publishing House, Jiangsu Literature & Art Press, Hunan Literature & Art Press, The Writer’s Publishing House, and Beijing Union Publishing Co. Ltd. The top nonfiction book in November 2020 was Educated: A Memoir, by Tara Westover. The fiction book ranked number one was Ordinary Word, by Lu Yao. This book was ranked at number 13 just a month earlier.

1 The last month of available data as of February 2, 2021.

Sources: Porter Anderson, “‘Crisis and Changes’: Insights from Beijing OpenBook Conference,” Publishing Perspectives, January 18, 2021 available online here; Porter Anderson, “China’s Book Market: A 2019 Update From the OpenBook Beijing Conference,” Publishing Perspectives, January 17, 2020 available online here; Porter Anderson, “China Bestsellers: November’s Big Sales Rule the Charts,” Publishing Perspectives, January 5, 2021 available online here; Lai Lin Thomala, “Number of Published Book Titles in China from 2009 to 2019,” Statista, December 29, 2020 available online here; “12 Chinese Sayings on Books,” Chinese 4 Kids, May 16, 2018 available online here.
Image source: Adapted from Cici Hung, “Unnamed Road, Qingpu Qu, Shanghai Shi, China,” Unsplash, August 21, 2019 available online here.

Metal Recycling

copper metal recycling
Geographic reference: World
Year: 2019 and 2027
Market size: $957.8 billion and $1.4 trillion, respectively

Metal recycling is a multibillion-dollar enterprise that will soon become a trillion-dollar industry. Today’s market size shows total global revenues for metal recycling in 2019 and projected for 2027. Society’s focus on conservation of resources and reducing greenhouse gas emissions along with increasing demand for metals are fueling growth in this industry.

By using recycled metal for their finished products, manufacturers can reduce their production costs. Recycling metal is less costly than mining ore and refining it into usable metals. Since the extraction and refining have already been done, the recycled metal just needs to be melted down into usable shapes, eliminating some of the more expensive and energy-intensive steps in the process. Recycling steel uses 74% less energy than creating it from raw materials.

Steel is the world’s most recycled material, with 650 million tons recycled every year. By volume, steel accounted for 79% of recycled metal demand worldwide in 2019. Steel can be infinitely recycled without loss of quality and can be easily separated from other types of metal scrap during the recycling process using large industrial magnets. Despite the large amount of steel that’s recycled, there isn’t enough scrap available to meet the demand for steel products. On average new steel products contain about 37% recycled steel.

China is the largest steel producer in the world, producing more than 996 million tons in 2019, or about 53% of global production. Of that, 215 million tons were sourced from scrap recycling, the most in the world. That year, the United States ranked third in steel production, behind the European Union. It produced 87.9 million tons of steel, using 60.7 million tons of steel scrap.

While aluminum and copper make up a small fraction of the metals recycled by volume, recycling rates for both are quite high. The global recycling rate for aluminum is 76%, with 30 million tons being recycled yearly. Three-quarters of the 1.5 billion tons of aluminum ever produced is in use currently. Only about 12% of the 5.8 trillion pounds in the world’s known copper reserves have been mined, but almost all of it is still in circulation. Each year about 8.5 million tons of copper are recovered from scrap.1 In the United States, about 72% of copper used by copper and brass mills, excluding wire production which uses newly refined copper, comes from recycled copper. In Europe, 50% of the copper consumed is sourced from recycled material.

By industry, the construction sector held a greater than 46% share by volume in 2019, followed by the automotive sector with a 25% share. Although there was decreased demand for metal in several industries including the construction and automotive sectors in much of 2020 due to the coronavirus pandemic, demand is expected to recover in 2021 and beyond as restrictions ease once vaccination becomes widespread. In fact, by late November 2020 in the United States overseas demand for recycled ferrous metals increased substantially due to governments investing in steel-intensive infrastructure projects. However, the supply of scrap metal has remained below pre-pandemic levels due to seasonal factors and public health restrictions, causing prices to rise.

The Asia-Pacific region is the largest producer of metals worldwide. With its well-established recycling industry, it accounted for more than 67% of global recycled metal revenue. This region is expected to be the fastest-growing market for metal recycling at least through 2027. Rapid urbanization, a need for proper waste management, and a growing manufacturing sector in India, China, Vietnam, Thailand, Myanmar, and Indonesia are expected to increase demand. Europe produces less metal than the Asia-Pacific region, however, its rate of recycled metal usage is higher in comparison to its virgin metal usage. Strict government regulation of energy usage along with an emphasis on the circular economy is expected to lead to increased demand for recycled metal in this region. Several leading metal recyclers maintain a presence in these two regions and in the United States including European Metal Recycling, CMC, Utah Metal Works, GFG Alliance, Norsk Hydro ASA, Kimmel Scrap Iron & Metal Co. Inc., Schnitzer Steel Industries Inc., Novelis Inc., Tata Steel Ltd., and Sims Metal Management Ltd. Tata Steel started its first recycling plant in Haryana, India in June 2019 to gain an early advantage in the Indian market.

1 In comparison, in 2019, 20 million metric tons of copper were mined worldwide.

Sources: “Metal Recycling Market Size, Share & Trends Analysis Report by Product (Aluminum, Steel, Copper), by Application (Construction, Automotive, Consumer Goods), by Region, and Segment Forecasts, 2020 – 2027,” Grand View Research Report Summary, July 2020 available online here; “Metal Recycling Market Size Worth $1.4 Trillion by 2027 | CAGR 4.9%: Grand View Research, Inc.,” CISION PR Newswire, January 21, 2021 available online here; “The Environmental and Financial Benefits of Recycling Metal,” Greener Ideal, April 6, 2020 available online here; “How Recycling Your Metal Can Benefit the Economy,” Taroni Metal Recycling available online here; “Steel Recycling,” World Steel Association available online here; “Steel: The Most Recycled Material in the World,” Napa Recycling and Waste Services available online here; World Steel Recycling in Figures 2015-2019, 11th Edition, Bureau of International Recycling, Ferrous Division, 2020 available online here; M. Garside, “Copper – Statistics & Facts,” Statista, December 4, 2020 available online here; “Copper Recycling,” International Copper Association, Copper Alliance available online here; “Europe Leading the World in Copper Recycling,” Energy Industry Review, August 7, 2018 available online here; “Copper – The World’s Most Reusable Resource,” Copper Development Association Inc. available online here; Brian Taylor, “Ferrous Market Booms Its Way Into 2021,” Recycling Today, December 11, 2020 available online here.
Image source: Alexas_Fotos, “copper-scrap-metal-scrap-disposal-1504098,” PIxabay, July 8, 2016 available online here.

Blood Collection Products

blood collection tubes
Geographic reference: World
Year: 2018 and 2026
Market size: $8.5 billion and $13.99 billion, respectively

A nurse at a hospital drawing blood to check a patient’s white cell count after treatment. A phlebotomist at a diagnostic laboratory drawing blood to check a patient’s cholesterol levels as part of a routine physical exam. People donating blood at a Red Cross blood drive. Most adults, and some children, are familiar with blood collection products: needles and syringes, blood collection tubes, blood bags, and others. Today’s market size shows total global revenues of blood collection supplies in 2018 and projected for 2026. The increasing incidence of infectious and non-communicable diseases, as well as the rising number of people injured as a result of trauma and accidents, will contribute to growth in this industry.

In 2018, the needles and syringes segment garnered the highest revenue share due to the high demand for surgical procedures and diagnostics. Because of this demand, this segment is expected to maintain its dominance in the future. The market for blood collection tubes and blood bags is expected to experience significant growth through 2026. The growing incidence of disease drives the market for blood testing methods, which in turn drives the market for blood collection tubes. Technological advancements, such as collection tubes that mechanically separate blood cells from plasma, will also drive revenue growth. Blood bags are used for the storage and transfusion of blood. According to the World Health Organization, globally about 117.4 million blood donations are collected each year. Blood donations increased by 7.8 million between 2013 and 2018. In high-income countries, those over the age of 65 account for up to 75% of all transfusions, anemia being the most prevalent of blood disorders in these hospitalized patients. An aging global population will add to this demand.1 Transfusions are also commonly given during cardiovascular surgery, transplant surgery, and when a patient has trauma-related injuries. In addition, they’re used as therapy for tumors and hematological cancers. In low- to middle-income countries, blood transfusions are most commonly used to manage pregnancy-related complications, anemia due to childhood malaria, and trauma-related injuries.

The diagnostic segment held the highest revenue share in 2018. The increasing prevalence of chronic and infectious diseases,2 the rising number of screening and diagnostic tests, along with the expanding recognition of the benefits of regular health checkups are contributing to growth in this segment. Because hospitals serve as the primary places for the diagnosis and treatment of diseases, the hospital segment claimed nearly half of revenues in 2018. Diagnostics centers, which had the second-highest revenue share in 2018 at about one-quarter, are expected to gain a substantial share through 2026. These centers offer technologically advanced laboratory devices that allow for faster test results.

By region, North America had the highest revenue share in 2018, followed by Europe. North America has a highly-developed healthcare infrastructure in which innovative and advanced technology is readily adopted. Increasing research and development activities in the region with a focus on clinical research is also driving growth. Several major diagnostic companies have a presence there, such as Abbott Laboratories;3 Medtronic; Bector, Dickinson and Company; NIPRO Medical Corp.; and Haemonatics Corp. Other major global companies in the blood collection product industry include Qiagen N.V., Greiner Holding AG, Sarstedt AG & Co., and FL MEDICAL s.r.l.

1 Globally, the percentage of people over the age of 65 grew from 6% in 1990 to 9% in 2019 and is projected to reach 16% by 2050.
2 Cancer, cardiovascular diseases, sickle cell anemia, hemophilia, malaria, dengue, and yellow fever, to name a few.
3 According to Abbott Laboratories, about 4 billion tests are conducted using its testing platforms every year.

Sources: “Blood Collection Market Size, Share & Trends Analysis Report by Product (Needles & Syringes, Blood Collection Tubes, Blood Bags, Others), by Application (Diagnostics, Treatment), by End-Use, and Segment Forecasts, 2019 – 2026,” Grand View Research Report Summary, November 2019 available online here; “Blood Collection Market Size Worth $13.99 Billion By 2026 | CAGR 6.6%: Grand View Research, Inc.,” CISION PRNewswire, February 13, 2020 available online here; “Blood Transfusion,” World Health Organization, June 10, 2020 available online here; World Population Ageing 2019 Highlights, United Nations Department of Economic and Social Affairs, 2019 available online here.
Image source: Belova59, “laboratory-medical-medicine-hand-3827736,” Pixabay, November 25, 2018 available online here.

Gutta-percha

gutta-percha is used by dentists and orthodontists
Gutta-percha is used by dentists and endodontists when performing endodontic (root canal) therapy.
Geographic reference: World
Year: 2020 and 2027
Market size: $182.0 million and $268.82 million, respectively

Many people reading this blog post may have never heard of gutta-percha but if you’ve had endodontic (root canal) therapy sometime in the past 50 years, there is a good chance you’ve come in contact with this substance. Gutta-percha is a thermoplastic material made from the latex of trees of the Palaquium genus in the Sapotaceae family, especially Palaquium gutta. These trees, which are commonly known as gutta-percha also, are found in Malaysia, Singapore, Sumatra, Borneo, and other parts of Asia. This substance has high tensile strength, is biocompatible and bioinert, and has radiopacity. Dentists and endodontists use it to fill a tooth’s root canal after they have removed all the infected tissue when performing root canal therapy. If extra support is needed for the rebuilt tooth, a post is inserted into the gutta-percha-filled root canal. The opening is then sealed with a filling and a crown is cemented onto the rebuilt tooth. Today’s market size shows the global revenues for gutta-percha used in dentistry in 2020 and projected for 2027. The rising incidence of dental caries,1 a growing awareness of oral hygiene, and an increasing geriatric population needing preventative and surgical dental services will contribute to growth in this market.

By type, surface modified gutta-percha had the highest revenue share, more than 40%, in 2020. This product is resin-coated or glass ionomer coated. The coating allows it to create a strong seal along the dentinal surfaces of the root canal. Revenues for nanoparticle enriched gutta-percha are expected to grow the fastest through 2027. Nanoparticles of diamond and silver are embedded in the gutta-percha to both improve the mechanical properties of the substance and to reduce the likelihood of reinfection. Diamond nanoparticles and silver have antimicrobial properties.

Nearly half of revenues came from dental hospitals in 2020, however, revenue from dental clinics is expected to grow rapidly in the near future as less invasive procedures, including fillings and root canal therapy, are increasingly being done in these locations.

North America garnered a 41% share of the market in 2020, the highest share that year, due to several factors: a high incidence of dental conditions, a well-developed medical infrastructure with established reimbursement policies, availability of advanced preventative and restorative dental procedures, and several major companies in the industry located in the region. These include Dentsply Sirona, DiaDent Group International, Essential Dental Systems, Kerr Corp., and Premier Dental Products Co. Other leading companies in this industry include Coltène Whaledent GmbH, FRG Dentaire, Micro-Mega, Sure endo, Meta Biomed, and Davis Schottlander & Davis. By 2027, more than 43% of research and development spending is expected to originate from the Asia-Pacific region, with China, Japan, and India spending the most.

1 According to the FDI World Dental Federation, sugar intake worldwide has tripled over the past 50 years. Ingestion of sugary foods and beverages is one of the main causes of dental caries.

Sources: “Gutta-percha Market Size, Share & Trends Analysis Report by Product Type (Surface Modified, Medicated, Nanoparticles Enriched), by End-use (Dental Hospitals, Dental Clinics), by Region, and Segment Forecasts, 2021 – 2027,” Grand View Research Report Summary, December 2020 available online here; “Gutta-percha Market Size Worth $268.82 Million by 2027 | CAGR: 5.77%: Grand View Research, Inc.,” CISION PRNewswire, January 13, 2021 available online here; “Dental Adhesives and Sealants Market Size, Share & Trends Analysis Report by Product (Adhesives, Sealants), by Region (North America, Europe, APAC, Latin America, MEA), and Segment Forecasts, 2020 – 2027,” Grand View Research Report Summary, August 2020 available online here; “Palaquium gutta – (Hook.) Baill.,” Plants for a Future available online here; “Root Canals,” Brook Hollow Family Dentristry available online here.
Image source: StockSnap, “chair-dentist-dental-clinic-teeth-2584260,” Pixabay, August 4, 2017 available online here.

Metabolomics

laboratory metabolomics
Metabolomics is the comprehensive analysis of metabolites in a biological specimen.
Geographic reference: World
Year: 2020 and 2025
Market size: $1.9 billion and $4.1 billion, respectively

Metabolomics is the “comprehensive analysis of metabolites in biological specimens.”1 Metabolites are substances made when the body breaks down food, drugs, chemicals, or tissue (fat or muscle tissue, for example). These substances create energy and are needed for growth, reproduction, ridding the body of toxic substances, and maintaining health. The process for creating these substances is called metabolism. More than 9,400 metabolites have been detected by scientists to date, according to the Human Metabolome Database, but scientists believe that the human metabolome consists of more than a million compounds. Metabolomics is a relatively new field of study, only coming into existence in the late 1990s.

Scientists use metabolomics to research possible therapies for a variety of illnesses such as cancer, cardiovascular disorders, neurological disorders, and metabolic disorders. The increasing number of people with cancer and higher demand for cancer treatments account for the cancer segment having the largest market share in 2020. This segment of the industry is also expected to have the fastest growing revenues through 2025.

Today’s market size shows the total global revenues for the metabolomics market in 2020 and projected for 2025. Increasing research and development investment in the pharmaceutical and biopharmaceutical segment of the economy, especially at academic and research institutions, along with growing demand for personalized medicine will contribute to growth in this industry. The high costs of instruments and problems with data examination and processing, however, are likely to stifle some growth.2 Even so, the metabolomics instrument market accounted for the largest market share in 2020 as technological advancements, an increasing number of research-related activities, and the shoring up of healthcare infrastructure in developing countries contributed to demand.

Thanks to technological advances, the metabolomics industry has been instrumental in biomarker discovery. Biomarkers are measurable substances in bodily fluids or tissue, the presence of which can be indicative of disease, infection, or environmental exposure. A biomarker can be used to test how well the body responds to treatments for a disease. As an example of biomarker research, George Washington University researchers are studying 5 biomarkers in the blood of those with COVID-19 to see if there is a correlation between having certain biomarkers and the severity of the disease. If there is a correlation, this could lead to a blood test to determine which patients will have a more severe form of the disease and will need to be monitored and/or hospitalized and which can be sent home for quarantining and bed rest.

By region, North America had the highest share of the market in 2020. Thirteen of the top 20 major corporations in the industry are located in the United States. These include Waters Corp., Agilent Technologies, Thermo Fisher Scientific, Danaher Corp., Bruker Corp., PerkinElmer, GE Healthcare, LECO Corp., Metabolon, Inc., Bio-Rad Laboratories, Scion Instruments, SRI Instruments, and JASCO Inc. Other major companies in this industry located elsewhere include Merck KGaA (Germany), Hitachi High Technologies Corp. (Japan), Human Metabolome Technologies Inc. (Japan), DANI Instruments S.p.A. (Italy), GL Sciences (Japan), and Kore Technologies Ltd. (United Kingdom). Revenues in the Asia-Pacific region are expected to grow the fastest through 2025. Several pharmaceutical companies have moved their research, development, and manufacturing operations to the region — especially to India and China where there are large numbers of qualified researchers — to tap into the growing market and to lower the costs of production.

1 Clary B. Clish, “Metabolomics: An Emerging but Powerful Tool for Precision Medicine,” Cold Spring Harbor Molecular Case Studies, October 2015 available online here.
2 Unlike other omics where comprehensive data can be gathered using a single analytic platform, metabolomics relies on a combination of analytical platforms, each with its own advantages and disadvantages. As a result, laboratories have to have a variety of instruments available, each potentially costing in the hundreds of thousands of dollars. In addition, universal procedures for sample preparation, analysis, and interpretation of results are currently few or nonexistent.

Sources: “Metabolomics Market by Product, Application, Indication, End User – Global Forecast to 2025,” ReportLinker Summary, December 2020 available online here; Clary B. Clish, “Metabolomics: An Emerging but Powerful Tool for Precision Medicine,” Cold Spring Harbor Molecular Case Studies, October 2015 available online here; Farhana R. Pinu, et. al., “Translational Metabolomics: Current Challenges and Future Opportunities,” Metabolites, June 2019 available online here; “The Global Metabolomics Market Size is Projected to Reach USD 4.1 Billion by 2025 from USD 1.9 Billion in 2020, at a CAGR of 13.4%,” GlobeNewswire, December 24, 2020 available online here; David S. Wishart, “Metabolomics for Investigating Physiological and Pathophysiological Processes,” Physiological Reviews, August 21, 2019 available online here; “The Human Metabolome Database,” The Metabolomics Innovation Centre available online here; “Blood Test May Point to Patients at Higher Risk for COVID-19 Deterioration, Death,” George Washington School of Medicine and Health Sciences Press Release, August 5, 2020 available online here; Max Roser and Hannah Ritchie, “Cancer,” Our World in Data, July 2015, Revised November 2019 available online here; “Metabolite,” NCI Dictionary of Cancer Terms available online here; “Biomarker,” NCI Dictionary of Cancer Terms available online here.
Image source: Belova59, “laboratory-medical-medicine-hand-3827745,” PIxabay, November 25, 2018 available online here.

Probiotic Cosmetic Products

probiotic cosmetic products
Geographic reference: World
Year: 2019 and 2027
Market size: $252.5 million and $418.1 million, respectively

According to the Statista Global Consumer Survey, the top two New Year’s resolutions in 2021 were “exercise more” and “eat healthier”. In fact, almost all of the resolutions in the top 10 relate in some way to either physical or mental health. But what about skin health?

Today’s market size shows global revenues for probiotic cosmetic products in 2019 and projected for 2027.1 This is a niche within the overall global $145.3 billion cosmetic skincare market.2 In 2019, about 1.9 billion people around the world suffered from skin-related issues. The growing acceptance of probiotics as dietary supplements for a healthy gut microbiome has led to increasing interest in probiotic cosmetic products for a healthy skin microbiome. Probiotic cosmetic products are topical over-the-counter products used to treat acne, eczema, rosacea, psoriasis, and chronic inflammation. They are also associated with skin hydration and anti-aging. Interest in a healthy skin microbiome has grown dramatically in the past 10 years. Since 2010, the number of internet searches for “probiotic+skin” has quadrupled.

To meet the growing demand, small startups, as well as large, established corporations, have been including probiotics in their skincare and haircare product lines, either through innovation and new product launches or through mergers and acquisitions. Kerry Group, Unilever, and L’Oréal each have either acquired or invested in smaller companies in order to expand their product portfolio into this segment of the industry. Other major manufacturers of probiotic cosmetic products include Esse Skincare, Estée Lauder Companies Inc., Aurelia Skincare Ltd., Tula Life Inc., Eminence Organic Skincare, LaFlore Probiotic Skincare, Glowbiotics Inc., and the Clorox Co. As of January 2020, there were 254 topical probiotic cosmetic products on the market around the world. Australia, Canada, the United States, China, and Russia offer the highest number of probiotic products targeting the skin microbiome.

More than 39% of revenues came from hypermarkets and supermarkets, followed by pharmacies and drug stores, and e-commerce. The e-commerce channel is expected to be the fastest-growing revenue source through 2027 as online shopping becomes more popular, internet penetration grows, and a wider range of products becomes available. Amazon.com, Sephora.com, Nykaa, and skinstore.com are some of the major retailers in this segment. North America garnered more than a third of revenues in 2019. Demand for products to treat acne and various skin diseases continues to grow. The Asia-Pacific region is expected to experience the fastest growth through 2027. More consumers are becoming aware of healthy skincare routines and the need for long-term solutions to skin problems. Also, local and regional manufacturers such as India-based Lotus Herbals are expanding their brand portfolios to include more probiotic cosmetic products.

The skincare industry as a whole has seen sales decline during the coronavirus pandemic because of business closures and stay-at-home policies implemented by governments around the world. Consumer spending also has shifted during the pandemic, away from premium, specialty products such as probiotic cosmetic products and toward basic skincare needs. More consumers are opting for less expensive, mass-market skincare products that are widely available in most stores. But, like the pandemic, sales declines will not last forever. Some analysts predict that revenues for probiotic cosmetic products will increase at a compound annual growth rate of 6.5% through 2027.

1 Data also includes hair care products, however, hair care products accounted for less than 10% of total revenues in 2019. Nonetheless, probiotic hair care product revenues are expected to grow the fastest through 2027.
2 Figure is for 2020.

Sources: “Probiotic Cosmetic Products Market Size, Share & Trends Analysis Report by Product (Skin, Hair Care), by Distribution Channel (Hypermarket & Supermarket, E-commerce), by Region (APAC, North America), and Segment Forecasts, 2020 – 2027,” Grand View Research, December 2020 available online here; “Skin Microbiome Market: Probiotic Cosmetic Products ‘The Future’ of Skin Care?” Lumina Intelligence, June 19, 2020 available online here; “Global Cosmetic Skin Care Industry (2020 to 2027) – Market Trajectory & Analytics,” GlobeNewswire, September 25, 2020 available online here; “Probiotic Cosmetic Products Market Size, Share & Trends Analysis Report by Product, by Distribution Channel, by Region and Segment Forecasts, 2020 – 2027,” ReportLinker, December 2020 available online here; Claire Jenik, “America’s Top New Year’s Resolutions for 2021,” Statista, December 18, 2020 available online here.
Image source: AdoreBeautyNZ, “cream-lotion-hands-sunscreen-spa-4713579,” Pixabay, December 26, 2019 available online here.