
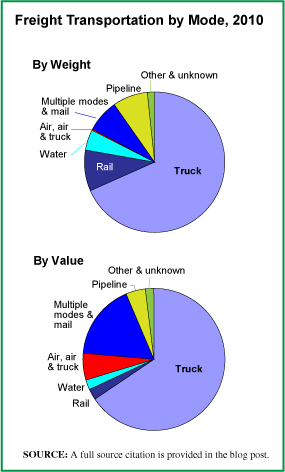
In the United States, trucks move more freight than do all the other forms of transportation combined and this is true when measured in terms of tons moved (68.2% in 2010) as well as in terms of the value of that freight (65.5%). The pie chart shows the percentage of total freight moved by each type of transportation vehicle, both in terms of weight and value. What is clear and quite logical is that the value of items moved by air is quite high but those items don’t weigh much. To move heavier freight, such as construction materials, heavy machinery, agricultural commodities, coal and the like, the nation’s highways, waterways and railways are the economical answer, and for the heaviest items, the latter two networks are the more economical.
Today’s market size is the weight of domestic freight moved by trucks in the United States last year and the revenue those movements produced for the trucking industry.
Geographic reference: United States
Year: 2012
Market size: 9.4 billion tons moved, generating $643 billion in revenue for the trucking industry
Source: Benjamin Preston, “Wheelies: The Stingray’s Stinger Edition,” Wheels.blogs.nytimes, May 30, 2013, available here. The data used to produce the graphic are from Freight Facts and Figures 2011, “Tables 2-1, 2-1M and 2-2.
Original Source: American Trucking Association and the U.S. Department of Transportation, Federal Highway Administration.
Posted on June 5, 2013