Metal Recycling

copper metal recycling
Geographic reference: World
Year: 2019 and 2027
Market size: $957.8 billion and $1.4 trillion, respectively

Metal recycling is a multibillion-dollar enterprise that will soon become a trillion-dollar industry. Today’s market size shows total global revenues for metal recycling in 2019 and projected for 2027. Society’s focus on conservation of resources and reducing greenhouse gas emissions along with increasing demand for metals are fueling growth in this industry.

By using recycled metal for their finished products, manufacturers can reduce their production costs. Recycling metal is less costly than mining ore and refining it into usable metals. Since the extraction and refining have already been done, the recycled metal just needs to be melted down into usable shapes, eliminating some of the more expensive and energy-intensive steps in the process. Recycling steel uses 74% less energy than creating it from raw materials.

Steel is the world’s most recycled material, with 650 million tons recycled every year. By volume, steel accounted for 79% of recycled metal demand worldwide in 2019. Steel can be infinitely recycled without loss of quality and can be easily separated from other types of metal scrap during the recycling process using large industrial magnets. Despite the large amount of steel that’s recycled, there isn’t enough scrap available to meet the demand for steel products. On average new steel products contain about 37% recycled steel.

China is the largest steel producer in the world, producing more than 996 million tons in 2019, or about 53% of global production. Of that, 215 million tons were sourced from scrap recycling, the most in the world. That year, the United States ranked third in steel production, behind the European Union. It produced 87.9 million tons of steel, using 60.7 million tons of steel scrap.

While aluminum and copper make up a small fraction of the metals recycled by volume, recycling rates for both are quite high. The global recycling rate for aluminum is 76%, with 30 million tons being recycled yearly. Three-quarters of the 1.5 billion tons of aluminum ever produced is in use currently. Only about 12% of the 5.8 trillion pounds in the world’s known copper reserves have been mined, but almost all of it is still in circulation. Each year about 8.5 million tons of copper are recovered from scrap.1 In the United States, about 72% of copper used by copper and brass mills, excluding wire production which uses newly refined copper, comes from recycled copper. In Europe, 50% of the copper consumed is sourced from recycled material.

By industry, the construction sector held a greater than 46% share by volume in 2019, followed by the automotive sector with a 25% share. Although there was decreased demand for metal in several industries including the construction and automotive sectors in much of 2020 due to the coronavirus pandemic, demand is expected to recover in 2021 and beyond as restrictions ease once vaccination becomes widespread. In fact, by late November 2020 in the United States overseas demand for recycled ferrous metals increased substantially due to governments investing in steel-intensive infrastructure projects. However, the supply of scrap metal has remained below pre-pandemic levels due to seasonal factors and public health restrictions, causing prices to rise.

The Asia-Pacific region is the largest producer of metals worldwide. With its well-established recycling industry, it accounted for more than 67% of global recycled metal revenue. This region is expected to be the fastest-growing market for metal recycling at least through 2027. Rapid urbanization, a need for proper waste management, and a growing manufacturing sector in India, China, Vietnam, Thailand, Myanmar, and Indonesia are expected to increase demand. Europe produces less metal than the Asia-Pacific region, however, its rate of recycled metal usage is higher in comparison to its virgin metal usage. Strict government regulation of energy usage along with an emphasis on the circular economy is expected to lead to increased demand for recycled metal in this region. Several leading metal recyclers maintain a presence in these two regions and in the United States including European Metal Recycling, CMC, Utah Metal Works, GFG Alliance, Norsk Hydro ASA, Kimmel Scrap Iron & Metal Co. Inc., Schnitzer Steel Industries Inc., Novelis Inc., Tata Steel Ltd., and Sims Metal Management Ltd. Tata Steel started its first recycling plant in Haryana, India in June 2019 to gain an early advantage in the Indian market.

1 In comparison, in 2019, 20 million metric tons of copper were mined worldwide.

Sources: “Metal Recycling Market Size, Share & Trends Analysis Report by Product (Aluminum, Steel, Copper), by Application (Construction, Automotive, Consumer Goods), by Region, and Segment Forecasts, 2020 – 2027,” Grand View Research Report Summary, July 2020 available online here; “Metal Recycling Market Size Worth $1.4 Trillion by 2027 | CAGR 4.9%: Grand View Research, Inc.,” CISION PR Newswire, January 21, 2021 available online here; “The Environmental and Financial Benefits of Recycling Metal,” Greener Ideal, April 6, 2020 available online here; “How Recycling Your Metal Can Benefit the Economy,” Taroni Metal Recycling available online here; “Steel Recycling,” World Steel Association available online here; “Steel: The Most Recycled Material in the World,” Napa Recycling and Waste Services available online here; World Steel Recycling in Figures 2015-2019, 11th Edition, Bureau of International Recycling, Ferrous Division, 2020 available online here; M. Garside, “Copper – Statistics & Facts,” Statista, December 4, 2020 available online here; “Copper Recycling,” International Copper Association, Copper Alliance available online here; “Europe Leading the World in Copper Recycling,” Energy Industry Review, August 7, 2018 available online here; “Copper – The World’s Most Reusable Resource,” Copper Development Association Inc. available online here; Brian Taylor, “Ferrous Market Booms Its Way Into 2021,” Recycling Today, December 11, 2020 available online here.
Image source: Alexas_Fotos, “copper-scrap-metal-scrap-disposal-1504098,” PIxabay, July 8, 2016 available online here.

E-Waste Management

e-waste
Geographic reference: World
Year: 2019 and 2027
Market size: $41.97 billion and $102.62 billion, respectively

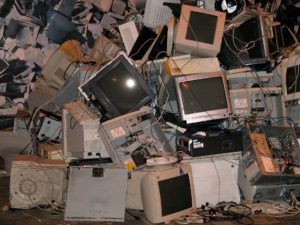
Broken appliances, VCRs, televisions, laptops, mobile phones, game consoles, printers, and tablets. These are just some of the items that are classified as e-waste. Electronic equipment is all around us whether in our homes or in manufacturing facilities, offices, retail establishments, or restaurants. What happens to all these electronic devices when they break or become obsolete? 

Today’s market size shows global revenues for e-waste management in 2019 and projected for 2027. E-waste management involves the reuse, resale, recycling, or disposal of electronic and electrical devices. Major global e-waste management companies include Aurubis AG, Boliden AB, Enviro-Hub Holdings Ltd., Electronic Recyclers International Inc., LifeSpan Technology Recycling Inc., MBA Polymers Inc., SIMS Metal Management Ltd., Stena Metall AB, Tetronics Ltd., and Umicore SA.

In 2016, of the 44.7 million metric tons of e-waste generated worldwide only 20% was recycled. In 2019, of the 53.6 million metric tons of e-waste generated only 17.4% was recycled. This despite “71% of the world’s population covered by some form of e-waste policy, legislation, or regulation”, up from 44% in 2014.1 By region, Asia generated the most e-waste in 2019, 46.5%, followed by the Americas (24.4%) and Europe (22.4%). Europe, however, had the highest e-waste recycling rate at 42.5%. Asia followed with 11.7% and the Americas with 9.4%.

E-waste is the fastest growing waste stream in the world. Higher levels of disposable income and lower cost of electronic devices, as well as increasing urbanization and industrialization, lead to rising consumption of electrical and electronic equipment. In turn, this growing consumption, along with short product life cycles and increasingly fewer options for repair lead to growth in the amount of e-waste.

This type of waste contains hazardous materials such as mercury, chromium, lead, brominated flame retardants, chlorofluorocarbons (CFCs), and hydrochlorofluorocarbons (HCFCs). If improperly disposed of these toxins can seep into the atmosphere, soil, and water, having significant negative effects on ecosystems and on people’s health. Every year 50 tons of mercury from improperly disposed of e-waste are released into the environment. In 2019, 98 metric tons of CO2-equivalent substances (greenhouse gases) were released into the atmosphere from improperly discarded refrigerators and air-conditioners.

Along with the toxins, e-waste contains several useful raw materials including metals such as iron, copper, aluminum, and gold. In 2019, these raw materials were estimated to be valued at $57 billion, with only about $10 billion of that recovered for recycling. Metal was the material most recovered from e-waste, followed by plastic and glass. Household appliances constituted the majority of e-waste in 2019, followed by IT and telecommunications equipment. Because of this, household appliances are a major source of revenue for companies involved in recycling e-waste. IT and telecommunications equipment are expected to take on a greater share of the e-waste stream through 2027. The COVID-19 pandemic has led to higher sales of mobile phones, laptops, and dongles as employees began working from home. Once pandemic restrictions are eased and workers return to their workplaces, companies are expected to dispose of many older electronic devices that are no longer needed thereby creating a high demand for e-waste management.

With only 17.4% of e-waste being properly recycled, where does the rest go? Most e-waste is thought to be mixed with other waste streams such as plastic or metal waste. Although some of this may be recycled, the focus of the recycling effort is on gathering a single material rather than extracting all the valuable materials available. Also, little or no thought may be given to mitigating the harmful effects of the toxic substances in the e-waste.

While some manufacturers offer to take back electronic devices to be refurbished or recycled, many other discarded electronic products are shipped from high-income countries to low- or middle-income countries where little or no formal e-waste management infrastructure exists, putting workers’ health at risk along with the health of those that live around these waste management activities. The Basel Convention on the Control of Transboundary Movements of Hazardous Waste and Their Disposal went into effect in 1992. Signed by 187 countries, it established written notification and approval processes for all cross-border movement of hazardous wastes, including most recently electrical and electronic waste. This was done so that countries would “take necessary measures to ensure that the management of hazardous wastes and other wastes including their transboundary movement and disposal is consistent with the protection of human health and the environment whatever the place of disposal.”2 This Convention makes an exception for goods that are destined for reuse. It’s estimated that 7-20% of e-waste generated in high-income countries is illegally exported as reusable goods or scrap metal. About 8% of e-waste in high-income countries ends up in landfills or is incinerated.

1 Sources: 2016 data: Baldé, C.P., Forti V., Gray, V., Kuehr, R., Stegmann, P., “The Global E-waste Monitor – 2017,” United Nations University (UNU), International Telecommunication Union (ITU) & International Solid Waste Association (ISWA), Bonn/Geneva/Vienna available online here; Other data: Forti V., Baldé C.P., Kuehr R., Bel G., “The Global E-waste Monitor 2020: Quantities, Flows and The Circular Economy Potential,” United Nations University (UNU)/United Nations Institute for Training and Research (UNITAR) – co-hosted SCYCLE Programme, International Telecommunication Union (ITU) & International Solid Waste Association (ISWA), Bonn/Geneva/Rotterdam available online here.
2 “Basel Convention on the Control of Transboundary Movements of Hazardous Wastes and Their Disposal, Protocol on Liability and Compensation for Damage Resulting from Transboundary Movements of Hazardous Wastes and Their Disposal: Texts and Annexes,” United Nations Environment Programme, Revised in 2019 available online here.

Sources: Sneha Korad, et. al., “E-Waste Management Market by Processed Material Type (Metal, Plastic, Glass and Others), Source Type (Household Appliances, Industrial Electronics, and Consumer Electronics), Application (Trashed and Recycled): Global Opportunity Analysis and Industry Forecast, 2020-2027,” Allied Market Research Report Summary, April 2020 available online here; “International E-Waste Management Network (IEMN),” United States Environmental Protection Agency available online here; Baldé, C.P., Forti V., Gray, V., Kuehr, R., Stegmann, P., “The Global E-waste Monitor – 2017,” United Nations University (UNU), International Telecommunication Union (ITU) & International Solid Waste Association (ISWA), Bonn/Geneva/Vienna available online here; Forti V., Baldé C.P., Kuehr R., Bel G., “The Global E-waste Monitor 2020: Quantities, Flows and The Circular Economy Potential,” United Nations University (UNU)/United Nations Institute for Training and Research (UNITAR) – co-hosted SCYCLE Programme, International Telecommunication Union (ITU) & International Solid Waste Association (ISWA), Bonn/Geneva/Rotterdam available online here; “Basel Convention on the Control of Transboundary Movements of Hazardous Wastes and Their Disposal, Protocol on Liability and Compensation for Damage Resulting from Transboundary Movements of Hazardous Wastes and Their Disposal: Texts and Annexes,” United Nations Environment Programme, Revised in 2019 available online here.
Image source: INESby, “computers-monitors-equipment-cables-814257,” Pixabay, June 19, 2015 available online here.

Recyclable Materials

Recycling is beneficial for the environment. It keeps materials out of landfills and helps to reduce the need for harvesting materials from the natural environment. When cities first started recycling programs the assumption was that the cost of the collection and sorting of the materials would be covered by the proceeds of the sale of those materials. In recent years this has not been the case. The value of some materials has dropped dramatically while the cost of recovering them has risen.

Reclaimed paper, a once valuable commodity that was in high demand by the newspaper industry, is one of these materials. As print newspaper circulation dropped dramatically, so did the need for reclaimed paper. Reclaimed plastics is another of these materials. As oil prices remain low, it’s less expensive for manufacturers to make products from new plastic than it is for them to use reclaimed plastic. Since much of the reclaimed materials in the United States are sent overseas, recent legislative action by some countries limiting the amount of imported reclaimed materials has also negatively affected the market making it more difficult to sell such materials.

Today’s market size is the value of a ton of mixed recyclable material for 2011, 2015 and an estimated value for 2017.

Geographic reference: United States
Year: 2011, 2015 and 2017
Market size: $180, $80, and just shy of $100 per ton of mixed recyclable material respectively.
Source: Paul Singer, “Recycling Market in a Heap of Trouble,” USA Today for the Lansing State Journal, April 21, 2017, page B1.

Spending on Water and Sewer

Water-Sewer

One of the basic infrastructural needs of any modern society, particularly one in which the density of population is great, such as in urban areas, is that which supplies clean water and carries waste away. It is one of those things that in modern industrial society we take very much for granted and almost don’t notice it, until something isn’t working.

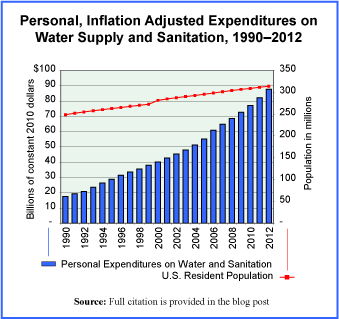
Today’s market size is the amount spent by residents, in the United States, for water supply and sanitation in 1990 and again in 2012. This does not include the expenditures of companies or other entities for water and sewer services but is, rather, the total spent by individuals for personal use. The graph provides a year-by-year picture of these expenditures in constant 2010 dollars, in other words, in inflation-adjusted terms. A red line on the graph is there to show how the population has risen over this period and it is clearly at a rate much slower than the rate of growth in expenditures on water.

Geographic reference: United States
Year: 1990 and 2012
Market size: $27.1 and $85.9 billion respectively (in current dollars)
Source: “Table 2.5.5 Personal Consumption Expenditures by Function (A),” National Income and Product Accounts Tables, (NIPA), Bureau of Economic Analysis, August 7, 2013, available from the BEA web site here.
Original source: U.S. Department of Commerce, Bureau of Economic Analysis
Posted on January 20, 2014

Waste Collection Services

Revenue annually

Dealing with waste is big business and one likely to continue to thrive as basic commodity prices rise, making the segregation of reusable materials from our overall waste flow more economical. Today we look at one of the industries in the larger Waste Management sector.

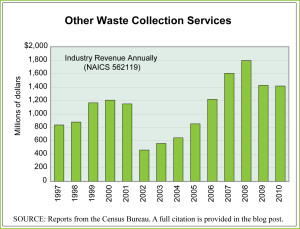
This industry is defined by the U.S. Census Bureau as comprising “establishments primarily engaged in collecting and/or hauling waste (except nonhazardous solid waste and hazardous waste) within a local area.” This includes all firms involved in the collection of nonhazardous waste and recyclable materials from homes, businesses, construction sites, government facilities, commercial centers and the like. This industry does not include standard garbage collection firms that collect solid waste on a regular schedule nor firms that handle hazardous waste. Worth noting is the fact that in 2010 the U.S. industry being highlighted here had revenues equal to 3.7% of those reported by the larger, solid waste collection firms that run regular routes and collect the vast majority of our solid waste.

The graph shows U.S. industry revenues annually over the period 1997 to 2010. The industry grew by 69% over this period but as the pattern on the graph shows, it is not immune to economic cycles. For anyone interested in knowing more about the trends in the United States regarding how much we throw away and how much we recycle, here is an interesting blog post showing several decades worth of such trends graphically.

Geographic reference: United States
Year: 1997 and 2010
Market size: $838 million and $1.4 billion respectively
Source: “Table 7.1. Administrative and Support and Waste Management and Remediation Services (NAICS 56) – Estimated Revenue for Employer Firms: 2002 Through 2010,” 2010 Service Annual Survey, produced in all non-economic census years and available online here. The graphic supplements the 2010 Service Annual Survey data with data from prior editions of the same report, also available online, at the Census Bureau’s website, here.
Original source: U.S. Department of Commerce, Bureau of the Census
Posted on October 18, 2012

Self-Storage Services

After decades of healthy consumer spending in the United States, it should not be a surprise that the self-storage business is doing very well in the country. Of the approximately 58,500 self-storage facilities in the world, 92% are located in the United States. We have accumulated more than we can fit in our homes and as of 2010 an estimated 10% of American households rented space in a self-storage facility in order to house their things.

Primary self-storage facilities—those for whom self-storage services were their primary business—generated revenues of $22.45 billion in the United States in 2011. It is a big business and one that has in recent decades been far more immune to economic cycles than most other businesses. Today’s market size is the actual size, in number of square feet, of interior storage space available in the United States in 1984 and in 2010.

Geographic reference: United States
Year: 1984 and 2010
Market size: 289.7 million and 2.24 billion square feet respectively. In per capita terms, we’ve grown from 1.23 square feet worth of storage capacity per person in 1984 to 72.2 square feet per person in 2010.
Source: “Self Storage Association Preamble,” June 2012, a detailed fact sheet on the industry that is presented by the association on its website here.
Original source: Self Storage Association
Posted on September 28, 2012

Waste & Scrap Exports

U.S. Waste Exports 2000-2011

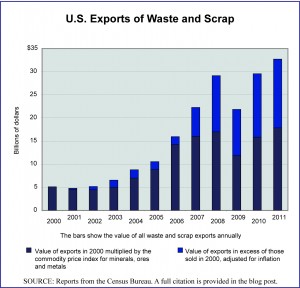
With the growth of globalization and the increased demand on raw materials, the prices of basic commodities such as minerals, metals, wood, and paper have been volatile and have risen sharply since 2000. This has stimulated the trade in reusable waste and scrap materials, including international trade. Today’s market size is the value of all waste and scrap material exported from the United States in 2000 and in 2011.

The graph presents these data as well as the figures for the intervening years. It also shows by a differentiation in color on each bar the approximate share of the increased export value that is attributable to rising commodity prices and the share that is the result of actual increased volume. The dark blue portion of each bar is the value of exports in 2000 multiplied by the international commodity price index for minerals, ores and metals. (Please note that the Waste & Scrap category as a whole includes more than just minerals, ores and metals—although they do dominate the trade—therefore this calculation provides only an approximation). The lighter blue portion of each bar is the value of exports in excess of the inflation-adjusted value of exports in the year 2000.

Geographic reference: United States
Year: 2000 and 2011
Market size: $5.12 and $32.74 billion respectively
Source: “U.S. International Trade Statistics,” (910 Waste and Scrap), a searchable database presented by the Census Bureau and availalble online here. The commodity price index data used to calculate the inflation adjusted value of the 2000 exports is from “Free Market Commodity Price Indices, 1960–2011,” a report from the United National Conference on Trade and Development available online here.
Original source: U.S. Department of Commerce, Bureau of the Census and the UNCTAD
Posted on September 24, 2012

Residential Septic Systems

For a brief change of pace, septic systems!

One fifth of all residential housing units in the United States are served by individual, onsite septic systems, including 22% of all housing units less than four years old. In 2007, 50% of all housing units served by such septic systems were in rural areas, 47% in suburban areas and 3% were in central cities according to the U.S. EPA.

Geographic reference: United States
Year: 1985 and 2007
Market size: Number of housing units respectively: 24.6 million and 26.1 million
Source: Septic Systems Fact Sheet, October 2008, available online here
Original source: United States Environmental Protection Agency, Office of Wastewater Management