Fat Bikes

Not too long ago, Winter and its accompanying snow and ice would force bicyclists to put away their bicycles until Spring. But, in recent years, fat bikes have allowed bicyclists to ride outdoors year-round. Fat bikes have very large tires that provide traction on snow. They first came on the market a decade ago, and have gone mainstream just in the past couple of years, even though a fat bike usually costs more than $1,000. According to Jay Townley, a partner in Gluskin-Townley Group, a consultant and market research company focused on the bicycle industry, “[t]he industry, quite frankly, needed something. If anything, the fat tire bike helped to keep a stable bike industry instead of losing volume.”

Today’s market size shows the total retail sales of fat bikes in the United States in 2016. According to NPD Group, “fat tire bike sales have grown eight-fold in the past three years.”

Geographic reference: United States
Year: 2016
Market size: $74.7 million
Source: David Sharp, “Conquer Winter Snow With ‘Fat Bikes’,” Lansing State Journal, March 12, 2017, page 5D
Original source: NPD Group
Image source: Marn, Peter, “Bicycle-bicycle-tire-fat-186057,” Pexels available online here.

Wheel Sports

In the United States, more than 52 million people age 6 and above participated in wheel sports, defined as bicycling and skateboarding, in 2016. The vast majority, 45.8 million, were bicyclists; 6.4 million were skateboarders. Among bicyclists, 3.8% participated in BMX, 18.8% participated in mountain biking or rode primarily on non-paved surfaces, and the rest, 77.4%, rode their bikes primarily on roads and other paved surfaces.

Today’s market size shows the total amount spent by wheel sports participants on trip-related expenses, gear, accessories, and vehicles in 2016. Trip-related expenses made up more than 85% of the total. According to the Outdoor Industry Association, spending on wheel sports supports more than 847,000 jobs and $28.5 billion in salaries and wages. Wheel sports spending also generates more than $13.2 billion in Federal, state and local taxes annually.

Geographic reference: United States
Year: 2016
Market size: $96.7 billion
Source: The Outdoor Recreation Economy, Outdoor Industry Association, April 2017, page 18 available online here; Outdoor Participation Report 2017, Outdoor Foundation, August 7, 2017, page 37 available online here.
Image source: StockSnap, “Mountain-travel-trip-adventure-2605151”, Pixabay, August 2017, available online here.

Bicycle Accessory Market in the United Kingdom

In 2015 there were 15.8 million bicyclists in the United Kingdom. In urban areas cycling has become a convenient and environmentally-friendly alternative to other forms of transportation. Recently more and more professionals are using their bicycles to commute to work. Since 2010 the market for accessories has grown faster than the market for bicycles themselves—28 percent and 23 percent, respectively.

Today’s market size shows the value of the bicycle accessory market, which includes parts, accessories, and clothing, in the United Kingdom for 2014. That same year the market for bicycles was valued at £956 million.

Geographic reference: United Kingdom
Year: 2014
Market size: £1.25 billion
Source: Graham, Luke, “Chain Reaction: Cycling Gets a Luxury Pricetag,” CNBC, July 31, 2015 available online here.
Original source: Mintel

High School Volleyball

Today’s market size is the number of high school students participating in volleyball in the United States during the academic year, 2011-2012. In that school year, participation in high school volleyball was dominated by women. Of all the sports in which both males and females compete at the high school level, volleyball was the one in which female participation totally dominated the statistics. Young women make up 89.5% of high school volleyball players. The source document, linked to below, provides participation data on all the major sports programs in U.S. high schools.

Geographic reference: United States
Year: 2011-2012
Market size: 468,370
Source: “2011-2012 High School Athletics Participation Survey,” August 2012, available online here.
Original Source: National Federation of State High School Associations
Posted on June 18, 2013

Expenditures on Reading Materials

The U.S. Bureau of Labor Statistics (BLS) carries out an annual survey of millions of households to track what they spend money on, by category. The resulting data has been collected over decades and seeing the trends that these data expose over time is very interesting.

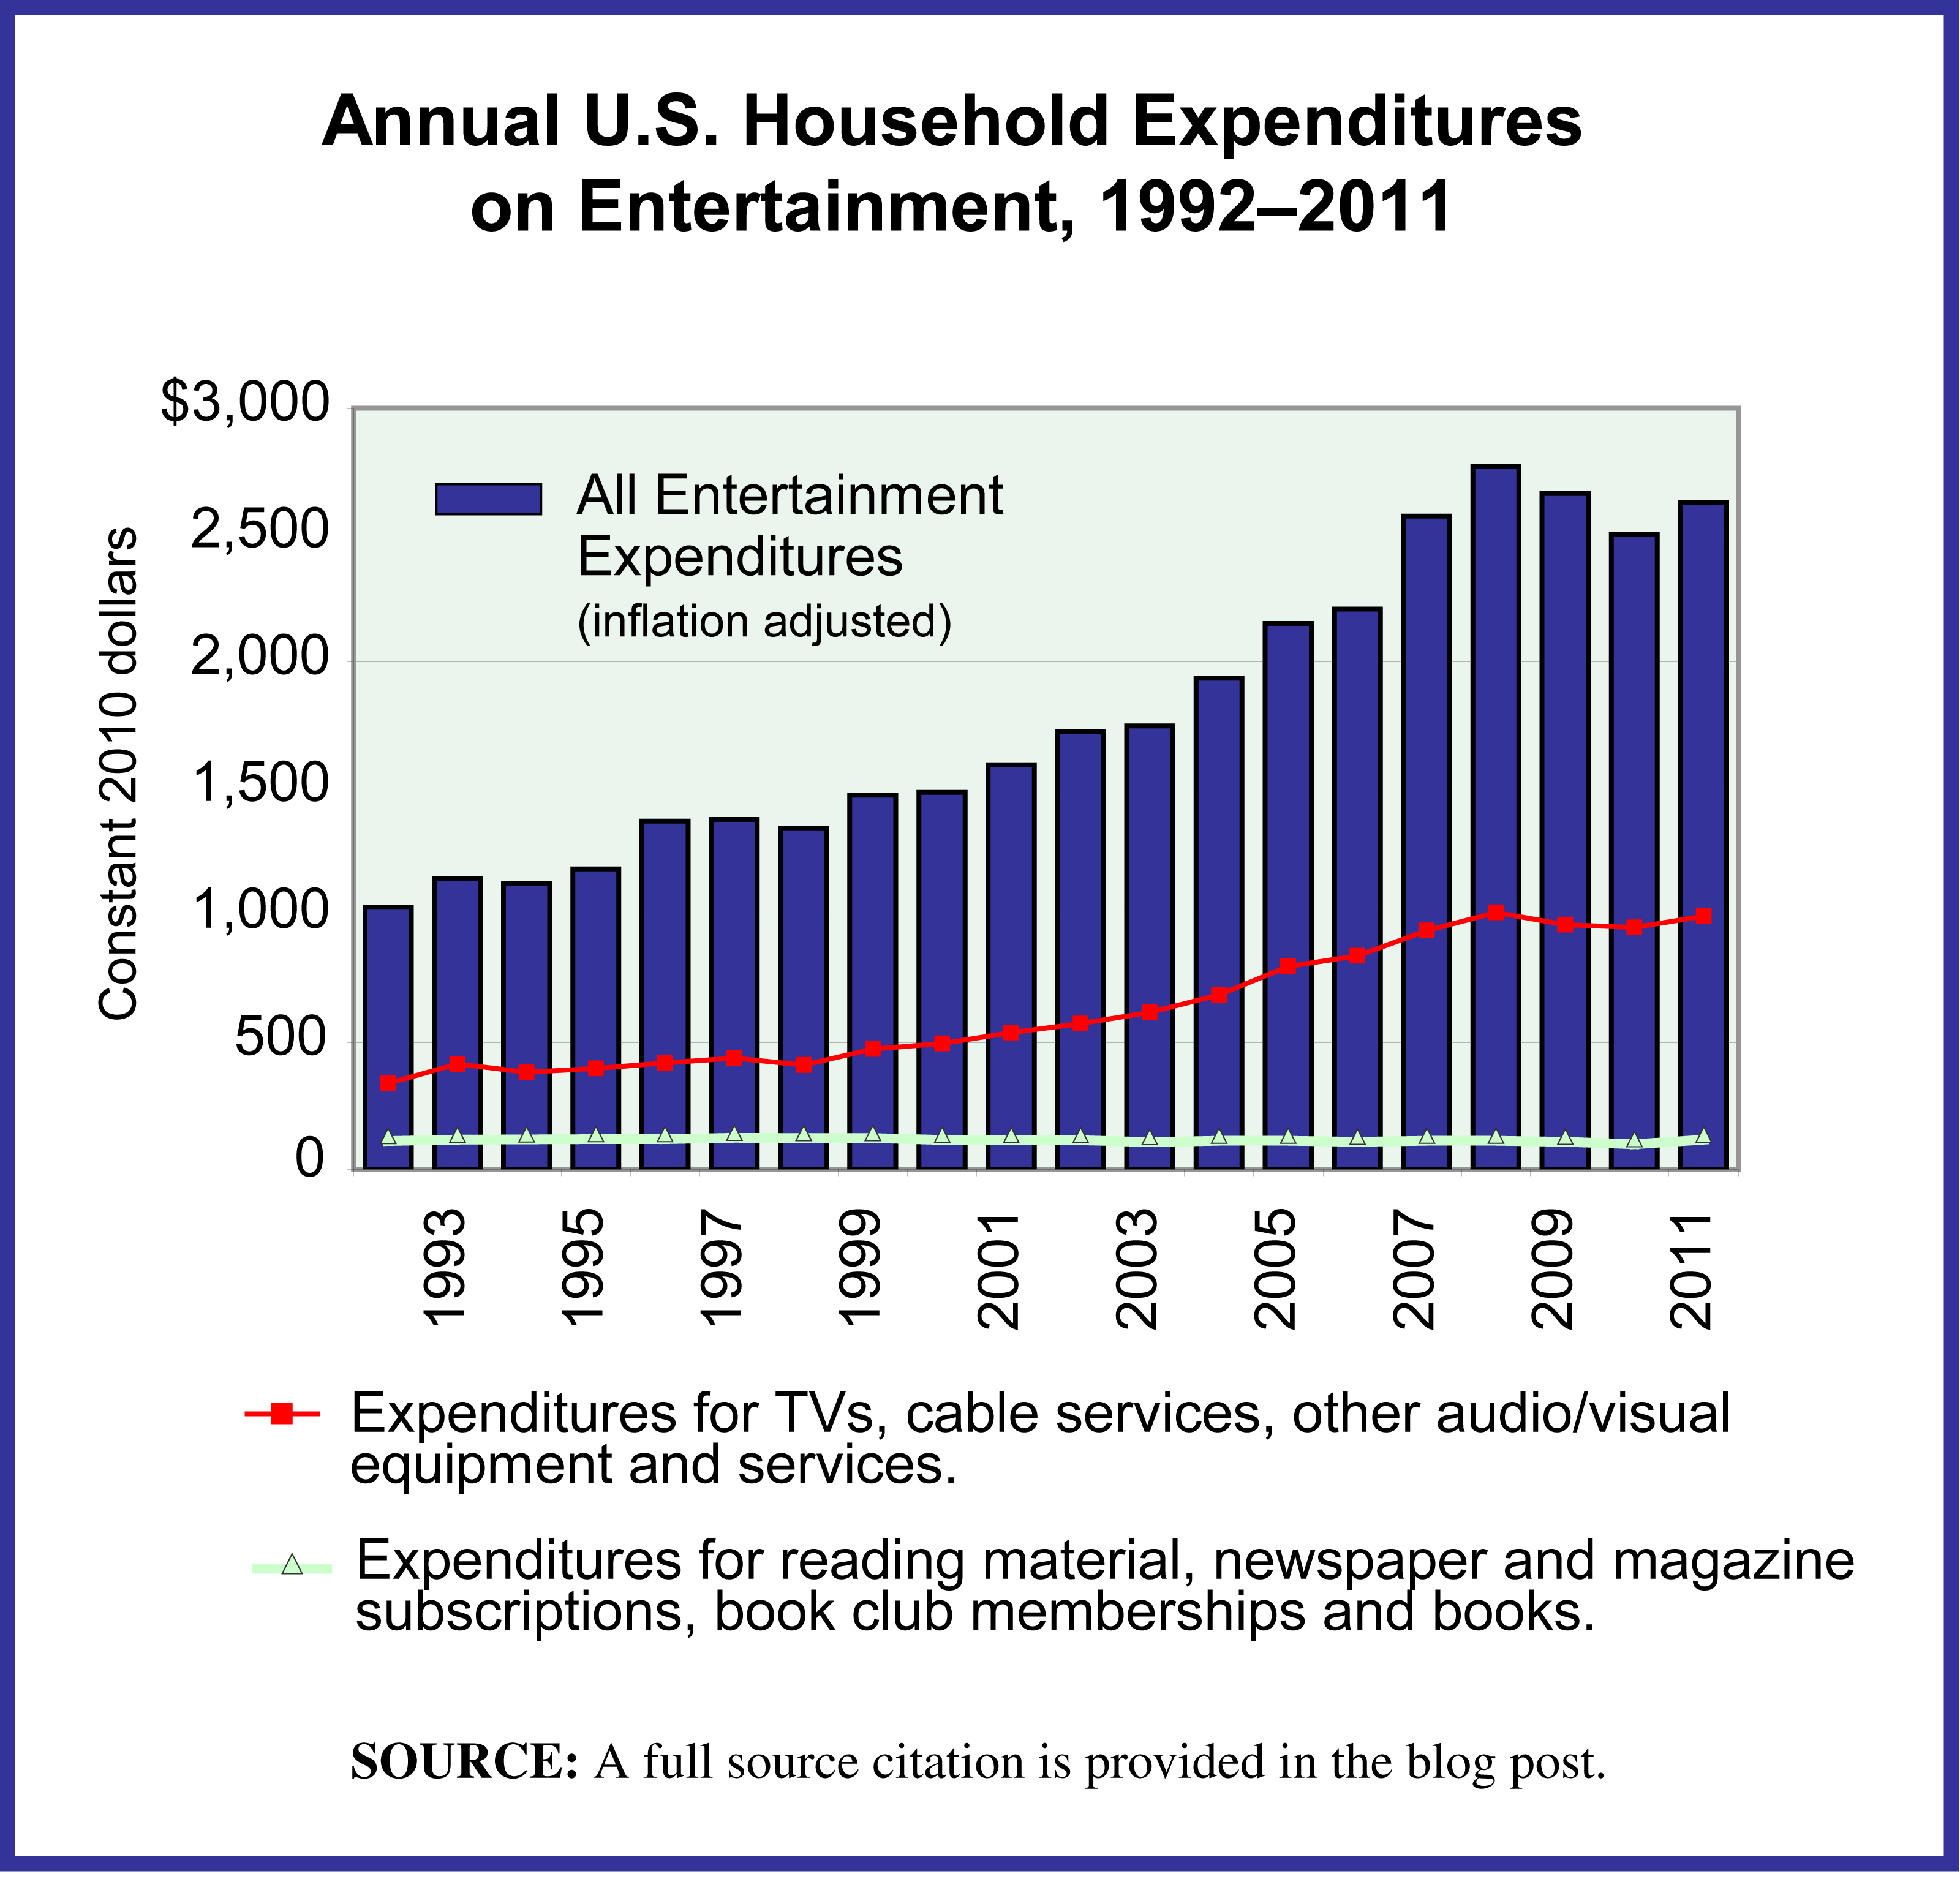
The graph presented here is made with BLS data from this survey series. It shows inflation-adjusted household expenditures on all categories of entertainment, as well as two subsets of expenditures, (1) those for TVs, audio/video equipment and services, such as cable subscriptions and (2) expenditures for reading material. The full category of entertainment expenditures is broad and includes things such as:

—Fees to attend concerts, sporting events, movies, and sporting clubs/fraternal organizations.
—TVs, radios and other audio/video equipment as well as subscriptions for cable, premium TV and the like.
—Pets, toys and hobbies, as well as all the services and equipment related to those.
—Bikes, athletic shoes, and equipment for camping, exercising, fishing, and all sports, as well as boats and docking fees, fireworks, pinball machines and video consoles.

Today’s market size is the average spent by U.S. households on reading material in 1994 and in 2011. The figures do not include expenditures for any textbooks or reading material purchased as part of a formal educational program. The transition to digital which is taking place in most areas of publishing is not well tracked by this BLS survey series. It is unclear from studying the survey results, for example, whether or not all online subscriptions to newspapers and magazines are consistently captured in the expenditure category “Reading.” Over time this will change as time allows data collection organizations, like the BLS, to adjust to the digital transition. Data collection organizations can only adjust as quickly as the industries they cover—in this case, the publishing industry—adjust to such dramatic changes.

Geographic reference: United States
Year: 1994 and 2011
Market size: $165 and $115 respectively. These figures translate to a national gross household spending on reading materials for each of those years of $16.86 billion and $14.06 billion respectively
Source: “Consumer Expenditure Survey,” Multiyear Tables: 1992-99 Multiyear Table, 2000-05 Multiyear Table, and 2006-11 Multiyear Table, all available on the Bureau of Labor Statistics website here.
Original source: U.S. Department of Labor, Bureau of Labor Statistics, Consumer Expenditure Surveys
Posted on May 9, 2013

High School Wrestlers

Our attention was caught last week by the announcement from the International Olympic Committee that it had recommended the elimination of wrestling from the Olympic Games starting in 2020. Their decision will not be ratified until later this year so one can expect to see wrestling fans around the world gathering their resources to defend the sport and its inclusion in the Olympic Games after the games of 2016. After all, wrestling was one of the original sports in the ancient games, has been in the modern games since they were reestablished in 1896 and wrestling is a recognized sport in 180 countries.

Today’s market size is the number of high school students participating in wrestling in the United States during the academic year, 2010-2011. In that school year, wrestling was the 6th most popular sport for high school males. The source document, linked to below, provides data on high school participation in all major sports programs.

Geographic reference: United States
Year: 2010-2011
Market size: 280,384
Source: “2011-2012 High School Athletics Participation Survey,” August 2012, available online here.
Original source: National Federation of State High School Associations
Posted on February 19, 2013

Baseball Equipment

Go Tigers!

Today we look at the market for baseball equipment: bats, shoes, gloves and balls. The market size presented below is for baseball equipment used by all those playing the game, from Little League teams to those playing for Major League Baseball.

Our selection of topic today is not without an alterior motive, namely to cheer on our local team as it prepares to play game one of the 2012 World Series of Baseball.
Go Tigers!

Geographic reference: United States
Year: 2005
Market size: $615 million
Source: “The Baseball Market,” 2006, The Active Network Inc., available online here.
Posted on October 24, 2012

Motorized Bicycles

Ford Motor Company's eBike

Motorized bicycles can be pedaled as standard bicycles or they can be ridden with the use of a gasoline- or electric-powered engine. In 2011, Ford Motor Company introduced the E-Bike at the Frankfurt Motor Show. This bicycle has a lithium-ion battery similar to ones in newer hybrid and electric automobiles. Market share for motorized bicycles is increasing worldwide and expected to grow steadily through the 2010s.

Geographic reference: World
Year: 2010 and forecasted 2018
Market size: 30 million and 47 million units respectively with an estimated total revenue of $11.9 billion by 2018.
Source: Carrie Jones, “A Ford Bicycle,” My Ford, Spring 2012, page 9, and a report by Pike Research, “Annual Sales of Electric Bicycles Will Surpass 47 Million by 2018,” March 27, 2012, available online here. The picture comes from Ford’s media site, here.
Posted on August 7, 2012

Great Lakes’ Fishing

After the Caspian Sea, the Great Lakes are the largest expanse of fresh water on Earth. The five lakes that lie on the border of the United States and Canada are, in order of size, Lake Superior, Lake Huron, Lake Michigan, Lake Erie and Lake Ontario.

Today’s market size is the size of the sports fishing industry on the Great Lakes.

Geographic reference: United States and Canada
Year: 2010
Market size: $7 billion
Source: Eric Sharp,”Dollars and Sense,” Detroit Free Press, Sunday, February 5, 2012, page 3C.
Posted on February 11, 2012

Bowling Alleys

Today’s market size is a measure of the revenue generated by bowling alleys in the United States in 2001 and in 2009. While it is not a flashy or “extreme” sport, based on bowling alley revenues, it is holding its own in the overall arts and entertainment sector of the economy.

Geographic reference: United States
Year: 2001 and 2009
Market size: $2.88 and $3.11 billion respectively
Source: “Table 9.1. Arts, Entertainment, and Recreation Services (NAICS 71) — Estimated Revenue for Employer Firms: 2001 Through 2009,” Service Annual Survey: 2010, the report on NAICS Sector 71 is available online here.
Original source: U.S. Census Bureau
Posted on September 28, 2011

Bike Parking Racks

The current Transportation Commissioner in New York City, Janette Sadik-Khan, is working on increasing the ease with which people are able to use bicycles in that city, even encouraging people to use bikes as their commuter vehicles. While New York has a long way to go to reach the level of biker welcomeness found in other large, world cities it has made progress, doubling the number of bike paths to an estimated 500 miles since 2007. As biking becomes easier in the “Big Apple” the demand for more safe places to park bikes is expected to continue to rise.

Today’s market size is the estimated number of bike parking racks in place in New York City as of the summer of 2011.

Geographic reference: New York
Year: 2011
Market size: 12,800
Source: Frank Bruni, “Bicycle Visionary,” The New York Times, September 11, 2011, page SR1.
Original source: NYC Department of Transporation and John Pucher, co-author of an upcoming book titled City Cycling.
Posted on September 12, 2011

Golfing

Today we look at the size of the market for golfing related expenditures in Michigan, generated by the organization Executive Women’s Golf Association (EWGA). This nonprofit organization, founded in 1991, has the mission of connecting women with golf for both business advantage and fun.

Geographic reference: State of Michigan
Year: 2010
Market size: $1.1 million
Source: “Seeing Green, Golf Courses Increasingly Catering to Women and Families,” Corp!, July/August 2011, page 20
Original source: EWGA estimates

Sporting Equipment — Chinese Exports

The first decade of the 21st century has been one marked by the rapid increase in globalization. As we saw in an earlier market size post, here, world trade increased some 133% between 2000 and 2010. China’s role in this rapidly growing market has increased over this same period from representing 4% of the total world exports in 2000 to 10.7% of the much larger total in 2010, producing a 533% increase in international trade for China over this decade.

Today’s market size is the estimated total value of Chinese export sales of sporting equipment based on export sales for the first six months of 2010 which totaled $2.5 billion.

Geographic reference: China
Year: 2010
Market size: $4 billion
Source: Sporting Equipment, Essential Sourcing Intelligence for Buyers, published September 2010, one in a series of reports called China Sourcing Reports, a sample of which is available online here.
Original source: Global Source

NASCAR Attendance

The first decade of this century has been one of great change for auto racing, the sport we call NASCAR (National Association for Stock Car Auto Racing). TV audience ratings have been falling and despite ticket price reductions, so has attendance at NASCAR races since peaking in 2006. The struggles of the auto industry in general may be part of the pall which seems to have fallen upon this sport. Some people blame changes made to increase the safety of the vehicles after the death of one of the sports’ most recognizable drivers, Dale Earnhardt Jr., during a race in 2001 for the declines in NASCAR audiences. Others suspect the recession is having a harder impact on fans of NASCAR than it is on fans of other sports. Whatever the cause, the sport is, for now, in decline.

Today’s market size is the estimated attendance at NASCAR races in the United States for the 2006 and 2010 seasons.

Geographic reference: United States
Year: 2006 and 2010
Market size: 4.6 and 3.6 million respectively
Source: Nate Ryan, “Action on Track Isn’t Helping NASCAR Attendance, Ratings,” USA Today, February 18, 2011, page 2A.
Original source: NASCAR estimates

Recreational Boating

Boat Registrations in Michigan

The market size reflects the amount spent on new boats, boating accessories, engines, trailers, and services in Michigan. Despite the fact that the number of boat registrations dropped from 2010, total spending on boats shows a 10.6% increase from a year ago. Nationwide, in 2010, the number of boaters hit a record high of 75 million, or 32.4% of adults. According to the National Marine Manufacturers Association, that’s the highest percentage since 1999.

Geographic reference: Michigan
Year: 2011
Market size: $351 million
Source: Barbara Wieland, “Boating Industry Rides Recovery Wave,” Lansing State Journal, June 19, 2011, page 1E
Original source: National Marine Manufacturers Association.

Sports Equipment

As basketball fans indulge in the offerings of March Madness, we look at sales of sporting equipment. Interestingly, when it comes to basketball, there is not much equipment needed, just a hoop and a ball. Basketball apparel, well, that’s another matter. Sporting apparel is not, however, included in today’s market size although it is included in the source table for those interested. Today’s market size covers a vast array of sporting equipment types, from fishing rods to golf clubs, tennis rackets to scuba tanks, and skis to fencing foils, to name but a few. Oh, and exercise equipment is included as well.

Geographic reference: United States
Year: 2009
Market size: $24.6 billion
Source: “Table 1249 – Sporting Goods Sales by Product Category: 1990 to 2008, and Projection, 2009,” Statistical Abstract of the United States: 2011, page 770, available online here.
Original source: National Sporting Goods Association

Snowmobiles in the United States

The United States is a country that loves its motorized vehicles. In rural regions of the country where snow covers the landscape for nearly half the year, snowmobiles serve as both a sporting entertainment as well as a working vehicle. The United States is the largest national market for snowmobiles.

Geographic reference: United States
Year: 2010
Market size: 48,599 snowmobiles sold for an estimated retail value of $414 million.
Source: “Snowmobile Statistics,” International Snowmobile Manufacturers Association, available online here.

Snowmobiles in Canada

As a country with vast expanses of land, often covered by a layer of snow, it is no wonder that Canada is the second largest national market for snowmobiles. What is remarkable is that in 2010 one snowmobile was sold in Canada for every 912 people. So, Canada is by far the leading national market for snowmobiles on a per capita basis.

Geographic reference: Canada
Year: 2010
Market size: 37,670 snowmobiles sold for an estimated retail value of $374 million.
Source: “Snowmobile Statistics,” International Snowmobile Manufacturers Association, available online here.

Snowmobiles

The United States and Canada are by far the two largest national markets for snowmobiles in the world. The United States accounted for 44% of all snowmobile unit sales in 2010 while Canada, with 0.5% of the world population, accounted for 34% of all snowmobile unit sales.

Geographic reference: World
Year: 2010
Market size: 111,492 snowmobiles sold.
Source: “Snowmobile Statistics,” International Snowmobile Manufacturers Association, available online here.

Market for Sports Team Merchandise

The sale of team specific merchandise is big business. Merchandise is sold for teams at all levels, from pee wee to professional. This market size is based on merchandise for sports of all sorts at the college and university level as well as professional teams. Leading sellers of Major League Baseball merchandise include the New York Yankees (27.5% of the MLB merchandise sales), Boston Red Sox (8.3%), Philadelphia Phillies (8.0%), Chicago Cubs (7.1%), and Detroit Tigers (6.9%).

Geographic reference: United States
Year: 2009
Market size: $11.5 billion
Source: Detroit News, April 8, 2010
Original source: SportsOneSource