Metal Recycling

copper metal recycling
Geographic reference: World
Year: 2019 and 2027
Market size: $957.8 billion and $1.4 trillion, respectively

Metal recycling is a multibillion-dollar enterprise that will soon become a trillion-dollar industry. Today’s market size shows total global revenues for metal recycling in 2019 and projected for 2027. Society’s focus on conservation of resources and reducing greenhouse gas emissions along with increasing demand for metals are fueling growth in this industry.

By using recycled metal for their finished products, manufacturers can reduce their production costs. Recycling metal is less costly than mining ore and refining it into usable metals. Since the extraction and refining have already been done, the recycled metal just needs to be melted down into usable shapes, eliminating some of the more expensive and energy-intensive steps in the process. Recycling steel uses 74% less energy than creating it from raw materials.

Steel is the world’s most recycled material, with 650 million tons recycled every year. By volume, steel accounted for 79% of recycled metal demand worldwide in 2019. Steel can be infinitely recycled without loss of quality and can be easily separated from other types of metal scrap during the recycling process using large industrial magnets. Despite the large amount of steel that’s recycled, there isn’t enough scrap available to meet the demand for steel products. On average new steel products contain about 37% recycled steel.

China is the largest steel producer in the world, producing more than 996 million tons in 2019, or about 53% of global production. Of that, 215 million tons were sourced from scrap recycling, the most in the world. That year, the United States ranked third in steel production, behind the European Union. It produced 87.9 million tons of steel, using 60.7 million tons of steel scrap.

While aluminum and copper make up a small fraction of the metals recycled by volume, recycling rates for both are quite high. The global recycling rate for aluminum is 76%, with 30 million tons being recycled yearly. Three-quarters of the 1.5 billion tons of aluminum ever produced is in use currently. Only about 12% of the 5.8 trillion pounds in the world’s known copper reserves have been mined, but almost all of it is still in circulation. Each year about 8.5 million tons of copper are recovered from scrap.1 In the United States, about 72% of copper used by copper and brass mills, excluding wire production which uses newly refined copper, comes from recycled copper. In Europe, 50% of the copper consumed is sourced from recycled material.

By industry, the construction sector held a greater than 46% share by volume in 2019, followed by the automotive sector with a 25% share. Although there was decreased demand for metal in several industries including the construction and automotive sectors in much of 2020 due to the coronavirus pandemic, demand is expected to recover in 2021 and beyond as restrictions ease once vaccination becomes widespread. In fact, by late November 2020 in the United States overseas demand for recycled ferrous metals increased substantially due to governments investing in steel-intensive infrastructure projects. However, the supply of scrap metal has remained below pre-pandemic levels due to seasonal factors and public health restrictions, causing prices to rise.

The Asia-Pacific region is the largest producer of metals worldwide. With its well-established recycling industry, it accounted for more than 67% of global recycled metal revenue. This region is expected to be the fastest-growing market for metal recycling at least through 2027. Rapid urbanization, a need for proper waste management, and a growing manufacturing sector in India, China, Vietnam, Thailand, Myanmar, and Indonesia are expected to increase demand. Europe produces less metal than the Asia-Pacific region, however, its rate of recycled metal usage is higher in comparison to its virgin metal usage. Strict government regulation of energy usage along with an emphasis on the circular economy is expected to lead to increased demand for recycled metal in this region. Several leading metal recyclers maintain a presence in these two regions and in the United States including European Metal Recycling, CMC, Utah Metal Works, GFG Alliance, Norsk Hydro ASA, Kimmel Scrap Iron & Metal Co. Inc., Schnitzer Steel Industries Inc., Novelis Inc., Tata Steel Ltd., and Sims Metal Management Ltd. Tata Steel started its first recycling plant in Haryana, India in June 2019 to gain an early advantage in the Indian market.

1 In comparison, in 2019, 20 million metric tons of copper were mined worldwide.

Sources: “Metal Recycling Market Size, Share & Trends Analysis Report by Product (Aluminum, Steel, Copper), by Application (Construction, Automotive, Consumer Goods), by Region, and Segment Forecasts, 2020 – 2027,” Grand View Research Report Summary, July 2020 available online here; “Metal Recycling Market Size Worth $1.4 Trillion by 2027 | CAGR 4.9%: Grand View Research, Inc.,” CISION PR Newswire, January 21, 2021 available online here; “The Environmental and Financial Benefits of Recycling Metal,” Greener Ideal, April 6, 2020 available online here; “How Recycling Your Metal Can Benefit the Economy,” Taroni Metal Recycling available online here; “Steel Recycling,” World Steel Association available online here; “Steel: The Most Recycled Material in the World,” Napa Recycling and Waste Services available online here; World Steel Recycling in Figures 2015-2019, 11th Edition, Bureau of International Recycling, Ferrous Division, 2020 available online here; M. Garside, “Copper – Statistics & Facts,” Statista, December 4, 2020 available online here; “Copper Recycling,” International Copper Association, Copper Alliance available online here; “Europe Leading the World in Copper Recycling,” Energy Industry Review, August 7, 2018 available online here; “Copper – The World’s Most Reusable Resource,” Copper Development Association Inc. available online here; Brian Taylor, “Ferrous Market Booms Its Way Into 2021,” Recycling Today, December 11, 2020 available online here.
Image source: Alexas_Fotos, “copper-scrap-metal-scrap-disposal-1504098,” PIxabay, July 8, 2016 available online here.


Diamond Rings

An article about wedding jewelry caught our attention. In a New York Times article over the weekend the subject of how much is spent in the United States annually on diamond engagement and wedding rings was presented. According to the article, couples paid an average of $4,000 on engagement rings in 2012 and another $1,000 for her wedding band, $500 for his. Now, averages, as we know, can be deceptive. What we were unable to find are statistics on just how many of these rings were purchased, which would be nice to know since the range in price for a diamond ring can be quite large. What we can say, by way of putting today’s market size into some context, is that in each year between 2000 and 2011 the number of marriages in the United States was between 2 and 2.3 million.

Today’s market size is the total value of diamond engagement and wedding jewelry sold in the United States in 2012.

Geographic reference: United States
Year: 2012
Market size: $11 billion
Source: Tara Siegel Bernard, “With Engagement Rings, Love Meets Budget,” The New York Times, February 1, 2014, page B1, available online here.
Original source: Bain & Company
Posted on February 3, 2014

Cast Iron Cookware

Photo of cast iron pot and pan

In the past 10 years, sales of cast iron cookware has gone from 4 percent to 10 percent of the entire cookware market. Lodge Manufacturing, founded in 1896 in the United States, and Le Creuset, founded in 1925 in France are two of the oldest manufacturers of cast iron cookware. Data show industry sales of cast iron cookware in 2011.

Geographic reference: United States
Year: 2011
Market size: $114 million
Source: Josh Ozersky, “A Pan for All Seasons,” Time, March 26, 2012, available online here.
Posted on May 14, 2013

3D Printing

The arrival on the market of consumer level 3D printers in 2012 has brought a great deal of attention to the subject of 3D printing. In essence, 3D printing may be defined as follows: A way of making objects using a computer-driven, additive process, one layer at a time. A computer-aided design (CAD) system is used by a printer-like machine which creates thousands of cross sections of the designed object and then produces that object, in plastic or metal, layer by layer. Although the name is relatively new, the technology behind 3D printing emerged in the 1980s for use, primarily, in the manufacturing sector.

There are two distinct branches of 3D printing: (1) small-scale 3D printing, where individuals or small groups with comparatively cheap machines print plastic objects in their homes or small shops, and (2) industrial 3D printing, which is usually called additive manufacturing (AM). The current industrial applications of 3D printing (primarily the creation of models, molds and dies) are seen by many as having the potential to have a revolutionary impact on manufacturing as a whole, in part because of its replacement of more traditional machine tooling tasks.

Today’s market size is an estimated value of the 3D printer market in 2012 and a forecast as to its value within a decade. This forecast comes from a gentleman who is a founding member of a company selling 3D printers to the public, 3D Systems. His forecast may refer only to 3D printers sold for nonindustrial applications, in other words, the first of the two branches of this market, as described above.

Geographic reference: World
Year: 2012 and 2022
Market size: $500 million and $35 billion respectively.
Source: Abe Reichental in a video interview with the Financial Times, “3D Printing ‘Bigger than Internet,'” June 21, 2012, available online here. “How Will 3D Printing Impact The Manufacturing Industry?” Seeking Alpha, March 18, 2013, available online here.
Original source: 3D Systems
Posted on April 2, 2013

Gold Demand

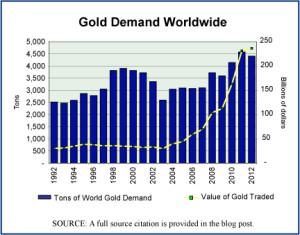
Gold demand trends worldwide, 1992-2012

The sharp rise in the price of gold since 2007 is a sign of how uncertain the financial world feels to many people since it went through a serious crisis in 2008. Although the United States abandoned the gold standard in 1933—thus severing the direct convertibility of the U.S. dollar for a set weight and quality of gold—gold is still seen as one of the precious metals that will hold its value during deflationary times or times when other investments are risky. The trade in gold tends to rise during uncertain times as does the price of gold. The annual average price of gold rose during the first decade of the century by 340%, from $279.1 per troy ounce to $1,224.5.

Today’s market size is the volume and value of gold traded in 2000 and in 2012. The graph shows what the global demand for gold has done annually over the period 1992–2012. The increased demand in the last few years has been large but not nearly as large as the rise in the price of gold.

Geographic reference: World
Year: 2000 and 2012
Market size: 3,818 tons valued at $34.26 billion and 4,405 tons valued at $236.40 billion respectively
Source: “Gold Demand Trends, Full Year 2012,” February 2013, World Gold Council, available online here. The graph was produced with data from this same report, as well as the earlier editions of the same, from 1996 and 2005, both of which are available on the same WGC website cited above.
Original source: LBMA, Thomson Reuters GFMS, and World Gold Council
Posted on February 28, 2013

Waste & Scrap Exports

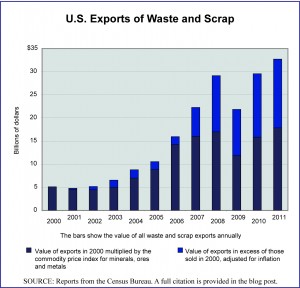
U.S. Waste Exports 2000-2011

With the growth of globalization and the increased demand on raw materials, the prices of basic commodities such as minerals, metals, wood, and paper have been volatile and have risen sharply since 2000. This has stimulated the trade in reusable waste and scrap materials, including international trade. Today’s market size is the value of all waste and scrap material exported from the United States in 2000 and in 2011.

The graph presents these data as well as the figures for the intervening years. It also shows by a differentiation in color on each bar the approximate share of the increased export value that is attributable to rising commodity prices and the share that is the result of actual increased volume. The dark blue portion of each bar is the value of exports in 2000 multiplied by the international commodity price index for minerals, ores and metals. (Please note that the Waste & Scrap category as a whole includes more than just minerals, ores and metals—although they do dominate the trade—therefore this calculation provides only an approximation). The lighter blue portion of each bar is the value of exports in excess of the inflation-adjusted value of exports in the year 2000.

Geographic reference: United States
Year: 2000 and 2011
Market size: $5.12 and $32.74 billion respectively
Source: “U.S. International Trade Statistics,” (910 Waste and Scrap), a searchable database presented by the Census Bureau and availalble online here. The commodity price index data used to calculate the inflation adjusted value of the 2000 exports is from “Free Market Commodity Price Indices, 1960–2011,” a report from the United National Conference on Trade and Development available online here.
Original source: U.S. Department of Commerce, Bureau of the Census and the UNCTAD
Posted on September 24, 2012

Postal Service Mailboxes

Blue USPO Mailbox

While the United States Postal Service publicizes the closing of thousands of post offices nationwide, the laying off of workers, and the end of Saturday delivery, one service the Postal Service offers has been slowly, quietly disappearing: the corner mailbox.

Once a staple in many neighborhoods, the blue mailbox on the corner is now slowly fading into history. Nancy Pope of the Smithsonian Institution commented thus about the significance of the corner mailbox: “Nothing says you’re on an American street more than the blue mailbox. It’s part of a neighborhood identity. It’s reassurance, it represents our ability to communicate with one another. When you take this away, something is lost.” At one time these blue mailboxes were seemingly everywhere. A convenience that perhaps has been taken for granted over the years. Data show the number of United States Postal Service blue mailboxes nationwide.

Geographic reference: United States
Year: 1985 and 2011
Market Size: 400,000 and 160,000 respectively
Source: Bob Greene, “Farewell My Mailbox,” CNN.com, September 8, 2011, available online here. The charming little image used above was obtained from this site, and used with our thanks.
Original Source: Research by Carolyn Jones of the San Francisco Chronicle.
Posted on October 28, 2011

The Business of Weddings

Today’s market size is an estimate of the size of the entire wedding industry in the United States—we take some license in using the word “industry” here. The things included in measuring the size of the wedding industry are many, from planning, apparel and jewelry through the ceremony, flowers, food, reception and honeymoon.

Geographic reference: United States
Year: 2010
Market size: $47.2 billion
Source: Toon Van Beeck and George Van Horn, “Wedding Bells are Ringing,” The RMA Journal, December 2010-January 2011, page 22-27, available online here.
Original source: IBISWorld
Posted on October 5, 2011

Molybdenum

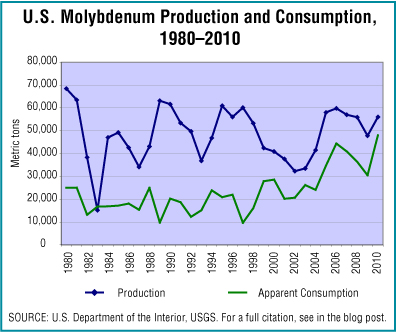
U.S. production and consumption figures for Molybdenum over 30 years

Molybdenum, a Group 6 chemical, is a refractory metallic element. The ability of molybdenum to withstand extreme temperatures without expanding or softening very much makes it useful in a variety of applications that involve intense heat. The manufacture of armour, aircraft parts, electrical contacts, industrial motors and filaments are among the industrial uses of molybdenum. It is used principally as an alloying agent in steel, cast iron, and superalloys to enhance corrosion resistance, strength, toughness, and weldability.

Today’s market size is the value of domestically produced molybdenum based on the average oxide price in 2010. The graphic shows production and apparent consumption figures for a period of 30 years, from 1980 to 2010. Apparent consumption is a calculated figure based on production, plus imports, minus exports, plus or minus change in stock.

Geographic reference: United States
Year: 2010
Market size: $885 million
Source: “Molybdenum Statistics and Information” part of a series of reports on different minerals and commodities produced by the U.S. Geological Survey and available online here.
Original source: U.S. Department of the Interior, U.S. Geological Survey (USGS)

Minerals in Wyoming

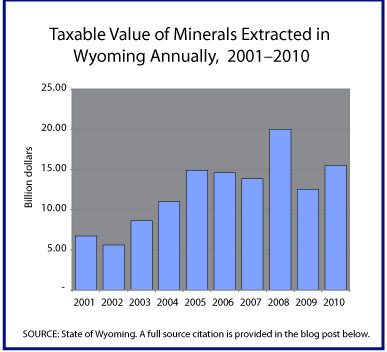
Taxable value of WY minerals

Mining and extraction industries in Wyoming saw a significant decline in 2009 after peaking in 2008 for the decade but 2010 saw a strong recovery over 2009. The graph shows taxable value for all minerals extracted annually in Wyoming from 2001 through 2010. Wyoming’s mineral wealth is providing the state with a strong base for recovery from the recession that began in December 2007.

Today’s market size is the total value of all minerals extracted in 2010. The minerals included in this total are oil, natural gas, coal, bentonite, trona, uranium, sand and gravel.

Geographic reference: United States
Year: 2001 and 2010
Market size: $6.74 and $15.49 billion respectively
Source: Barron, Joan, “State’s Mineral Valuation Booms,” Casper Star Tribune, June 1, 2011, page 1.
Original source: State of Wyoming

Iron & Steel

Iron & Steel in the U.S. over 30 years

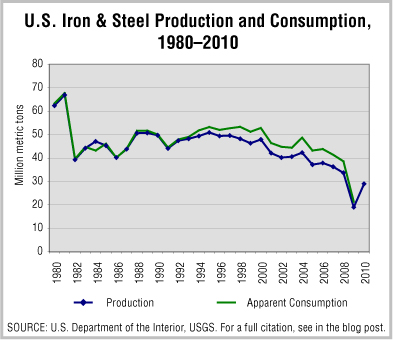
The year 2010 saw a strong recovery for iron ore production in the United States after a particularly strong downturn in 2009. The market size presented today is the value of all iron and steel production in the country in 2010. The state of Indiana accounted for 24% of the total raw steel production, followed by Ohio with 10%, and Michigan and Pennsylvania each accounting for 7%.

The graphic shows iron and steel production and apparent consumption figures for a period of 30 years, from 1980 to 2010. Apparent consumption is a calculated figure based on production, plus imports, minus exports plus or minus change in stock.

Geographic reference: United States
Year: 2010
Market size: $139 billion
Source: “Iron and Steel, Statistics and Information,” Mineral Industry Survey, a series of reports produced by the U.S.Geological Survey, made available online and last updated on May 19, 2011. Here is a link to the USGS site.
Original source: U.S. Department of the Interior, USGS

Gold

Gold has long been considered essentially a monetary metal. In the late 20th century, however, gold’s superior electrical conductivity and resistance to corrosion caused it to emerge as an essential industrial metal. Gold now performs critical functions in computers, communications equipment, jet aircraft engines, and a host of other products, although the largest single use for gold is still in the production of jewelry.

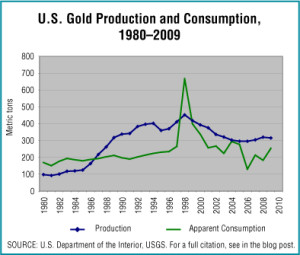
The trade in gold has been robust of late—particularly since the financial crisis that began with the last recession and the bursting of the housing bubble—and gold prices have risen sharply. The estimated price in 2010 was 23 percent higher than in 2009, hitting a high in November 2010 of $1,424.07 per troy ounce.

The graphic shows gold production and apparent consumption figures for a period of 30 years, from 1980 to 2010. Apparent consumption is a calculated figure based on production, plus imports, minus exports plus or minus change in stock.

Geographic reference: United States
Year: 2010
Market size: $8.9 billion
Source: “Gold, Statistics and Information,” Mineral Industry Survey, a series of reports produced by the U.S.Geological Survey, made available online and last updated on May 19, 2011. Here is a link to the USGS site.
Original source: U.S. Department of the Interior, USGS

Copper

Copper mining history in the U.S.

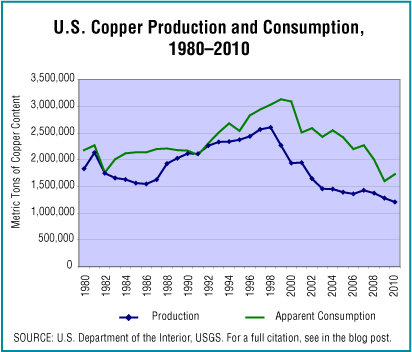
The price of copper has been rising for a few years now so a 5% decline in the quantity of copper mined in the United States between 2009 and 2010 did not result in a loss of value of the total copper mined. Today’s market size is the quantity and value of copper mined in the United States in 2010. The graphic shows production and apparent consumption figures for a period of 30 years, from 1980 to 2010. Apparent consumption is a calculated figure based on production, plus imports, minus exports plus or minus change in stock.

Geographic reference: United States
Year: 2010
Market size: 1.12 million metric tons valued at $8.4 billion
Source: “Copper,” Mineral Commodity Summary 2011, January 2011, page 48, available online here.
Original source: U.S. Department of the Interior, USGS

Steel Production

The production of crude steel around the world rebounded in 2010, rising 15% over the 2009 production levels. In terms of crude steel production by nation, China led the world in 2010 with 44.32% of world production, followed by Japan with 7.75%, the United States with 5.70% and Russia with 4.47%.

Geographic reference: World
Year: 2010
Market size: 1,414 million metric tons
Source: “World Crude Steel Output Increases by 15% in 2010,” January 21, 2011, available online here.
Original source: World Steel Association

Metal Household Furniture Market

This market covers both furniture for the interior and exterior of the home as well as furniture sold assembled and that sold ready-to-assemble.

Geographic reference: United States
Year: 2008
Market size: $2.26 billion
Source: Annual Survey of Manufactures, 2008, March 30, 2010 available online here.
Original source: U.S. Bureau of the Census