LNG Bunkering

cargo ship LNG bunkering
The increase in demand for cargo shipping through 2027 is expected to lead to a 45.4% compound annual growth rate for LNG bunkering over this time period.
Geographic reference: World
Year: 2019 and 2027
Market size: $0.38 billion and $5.14 billion, respectively

Today’s market size shows the total global revenues from LNG (liquefied natural gas) bunkering in 2019 and projected for 2027. LNG bunkering is the process of fueling a ship with liquefied natural gas. On January 1, 2020, new International Maritime Organization regulations concerning sulfur dioxide emissions went into effect. The new rule limits sulfur in fuel oil used in marine vessels (bunker fuel) to 0.50% mass by mass (m/m), much lower than the previous 3.5% limit.1 Sulfur dioxides are linked to asthma, and pulmonary, cardiovascular, and respiratory diseases. Sulfur dioxides also cause acid rain. Traditional bunker fuel contains 27,000 parts per million (ppm) of sulfur compared to 10-15 ppm in vehicle fuel. Heavy fuel oil accounts for 14% of sulfur emissions. The use of liquefied natural gas, on the other hand, reduces sulfur dioxide emissions by 100%. In addition, carbon dioxide emissions are reduced by 25% and nitrogen oxide emissions are reduced by 90%. In 2020, fewer than 400 out of more than 80,000 registered ships globally ran on liquefied natural gas.2 This number is expected to grow to 1,000 by 2030. About 13% of the new build order book is for LNG-fuelled ships.

Ship-to-ship bunkering held 60.5% of the market in 2019 and is expected to maintain the highest share through 2027 due to the increasing number of LNG-fuelled ships, a fuel ship’s high capacity, and the fast transfer rate of fueling operations. The increase in demand for cargo shipping is expected to lead to a 45.4% compound annual growth rate in the cargo fleet segment through 2027. This segment also held the highest share of the market in 2019. By region, Europe had the highest revenue share in 2019 and is expected to maintain its lead through 2027 due to a broad customer base and a rise in shipping activity. In addition, this region is increasing its investment in LNG bunkering infrastructure. Some leading global LNG bunkering companies include Broadview Energy Solutions B.V., Crowley Maritime Corp., Gasum Oy, Harvey Gulf International Marine, Klaw LNG, Korea Gas Corp., Polskie LNG S.A., Royal Dutch Shell PLC, Petronas, and Exxon Mobile Corp. among others. 

1 Certain parts of the world—the Baltic Sea area, the North Sea area, the North American area, and the United States Caribbean Sea area—have limits of 0.10% m/m.
2 Those that did not invest in LNG-fuelled ships took other steps to comply with the new environmental regulations. Some shipowners fitted their ships with exhaust-gas cleaning systems that prevent sulfur from being released into the atmosphere. Others started using very low-sulfur fuel oil (VLSFO) to meet the higher standards. By the end of 2020, 70% of major ships were using VLSFO. In some parts of the world, prices for such fuel were double that of heavy fuel oil and there were shortages at some ports. In addition, some shipping companies were reporting engine failures after switching to this new fuel blend.

Sources: “LNG Bunkering Market Size to Reach USD 5.14 Billion by 2027 at a CAGR 45.2% | Valuates Reports,” CISION PR Newswire, April 1, 2021 available online here; “LNG Bunkering Market by End-User (Container Fleet, Tanker Fleet, Cargo Fleet, Ferries, Inland Vessels and Others) – Global Opportunity Analysis and Industry Forecast, 2017-2023,” Valuates Reports Description, November 2019 available online here; “Bunker (Fuel),” Science Direct, 2019 available online here; Jack Wittels, “Shipping’s Big Bang Sends Two Global Industries Spinning,” Transport Topics, January 14, 2020 available online here; “IMO 2020 – Cutting Sulphur Oxide Emissions,” International Maritime Organization available online here; Peter Keller, “The Outlook for LNG as a Marine Fuel,” The Maritime Executive, February 20, 2021 available online here; “LNG: An Energy of the Future,” Elengy available online here; Jessica Jaganathan, “LNG-fuelled Tankers to More Than Double by 2030 – Petronas Exec,” Reuters, September 15, 2020 available online here; Nishan Degnarain, “Shipping-Gate: Why Toxic VLSFO ‘Frankenstein Fuel’ Is Such A Danger For The Planet,” Forbes, December 21, 2020 available online here.
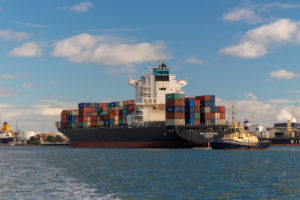
Image source: John Simmons, “Melbourne Shipping,” Unsplash, April 9, 2021 available online here. Photo is used for illustration purposes. This particular vessel may not be LNG-fuelled.

International Data Flow

The World Wide Web. A decentralized network of data stored on servers all around the world. But many countries—China, Russia, Germany, and Belgium, to name a few—are enacting laws requiring multinational companies to store and process country-specific data on local servers. According to the source, relaxing such restrictions has become a priority of President Donald Trump’s administration as they negotiate trade agreements, including the upcoming renegotiation of NAFTA.

Proponents of these laws say that having their users’ data stored locally aids in cyber security. Opponents say that storing data on local servers is more expensive, especially for small to medium sized companies. High tech companies worry about having their source codes stolen. Some companies worry that governments or political groups will use the data stored on these servers for illegitimate reasons. And many argue that limiting data flow also limits job growth and innovation. According to Nigel Cory, a trade policy analyst at the Information Technology and Innovation Foundation, “data needs to flow to create value.”

Today’s market size is the estimated value of data flowing through international borders in 2014, according to a report by the McKinsey Global Institute.

Geographic reference: World
Year: 2014
Market size: $2.8 trillion
Sources: Yu, Roger, “More Firms Push Back on Foreign Data Rule,” USA TODAY for the Lansing State Journal, August 13, 2017, page 4B
Original source: Manyika, James, et. al., Digital Globalization: The New Era of Global Flows, McKinsey Global Insitute, February 2016 available online here.
Image source: Geralt, “Binary-hands-keyboard-tap-enter-2372131,” Pixabay, June 2017 available online here.

American Craft Beer Market in Belgium

Belgians who drink beer love their locally-made beer. In years past, many Belgians considered American beer inferior, but this attitude may be changing. American craft beers are now appearing in Belgian supermarkets and in bars. A craft beer brewed by Seattle’s Schooner EXACT brewery won the top award at the Brussels Beer Challenge in 2015. American beers also won several other gold medals, 5 more than Belgian beers did, that same year.

Today’s market size shows the amount of craft beer exported to Belgium by American brewers in 2015. In comparison, the United States imported 50 million gallons of Belgian beer that year.

Geographic reference: Belgium
Year: 2015
Market size: 160,000 gallons
Source: Thompson, Linda A., “U.S. Suds No Longer Duds,” Lansing State Journal, August 7, 2016, page 4B.

Paper Manufacturing

The production of paper of all types in the United States fell, as did most production activity, during the recession of 2007–2009 but regained most of the losses by 2011. The industry also adjusted to lower demand by increasing exports and reducing imports, a pattern seen in many industries over the past six years. Between 2007 and 2011 paper production fell and then regained all but 0.1% of its 2007 total while paper exports rose 26.2% and exports fell by 7.2%.

Today’s market size is the value of U.S. paper manufacturer shipments in 2007 and 2011.

Geographic reference: United States
Year: 2007 and 2011
Market size: $176.12 billion and $175.88 billion respectively
Source: “General Statistics: Statistics for Industry Groups and Industries: 2011 and 2010,” Annual Survey of Manufactures, available on the Census Bureau’s American FactFinder website here. Data for NAICS 322-Paper Manufacturing from U.S. International Trade Statistics, database also produced and made available online by the Census Bureau, here.
Original source: U.S. Department of Commerce, Bureau of the Census
Posted on April 16, 2014

Sake

Sake is an alcoholic beverage, made with rice, that originated in Japan. It is often referred to as rice wine but is actually closer to a beer than a wine based on the way that it is brewed. In the production of wine, the natural sugars in the fruits from which it is made are fermented. In making sake, the sugars that are fermented to produce the alcohol must first be converted from the starches in rice. It is a process very similar to the one used to brew beer.

Today’s market size is the value of Japanese sake exports to the world in 2002, 2012 and the industry’s declared goal for exports by 2020. In 2012, one-third of the sake exported from Japan was imported by the United States.

Geographic reference: Japan
Year: 2002, 2012, and a forecast for 2020
Market size: ¥7.5 billion, ¥8.9 billion and ¥60 billion respectively. In dollar terms, based on average exchange rates each year and using 2013’s exchange rate for the 2020 forecast, those values are $60 million, $112 million, and $616 million.
Source: Eric Peanner and Zhiyi Yang, “In Sake, Japan Sees A Potential Stimulus,” The New York Times, February 22, 2014, pages B1-B2. The average exchange rate data used to convert the Yen to Dollars was obtained at this OzForx Group Limited website.
Original source: National Tax Agency of Japan
Posted on March 11, 2014

Bourbon

The last decade has been one of unexpected growth for whiskey distillers in the United States and in particular for those producing bourbon. Bourbon is made in the United States only—in the same way that Scotch Whiskey must be made in Scotland—and is a type of whiskey made from a grain mash consisting of at least 51% corn mash. The distinctions that define types of whiskey are the primary grain used in the mash with which the whiskey is distilled, the length of time it is aged in a barrel, and the place in which it is made.

Bourbon whiskey was a very fashionable and popular drink in the United States after prohibition and through the 1950s. The drink went out of fashion in the 1960s and spent the next several decades in decline. But that has all changed since the turn of the century. Bourbon is once again a fashionable drink, demand for which is rising so quickly that distillers are having a hard time keeping pace. After all, a high-quality bourbon must spend years in a barrel to age making quick adjustments to inventory problematic.

Today’s market size is the value of bourbon exports from the United States in 2002 and 2013.

Geographic reference: U.S. exports
Year: 2002 and 2013
Market size: $376 million and $1 billion respectively
Source: Clay Risen, “The Billion-Dollar Bourbon Boom — How Did American Bourbon Get So Damn Hot?” Fortune, February 24, 2014, pages 56-65.
Original source: Distilled Spirits Council of the United States
Posted on March 4, 2014

Non-Alcoholic Beer

The volume of non-alcoholic beer consumed worldwide is on the rise. According to The Economist (full citation below), the volume of non-alcoholic beer consumption globally was 80% higher in 2012 than it had been in 2007. Part of this rise is the result of increased consumption of this beverage in the Middle East. Increasing penalties for drunk driving in several European countries has also been seen by industry analysts as a contributor to the rise in demand for non-alcoholic beer.

Today’s market size is the volume of non-alcoholic beer sales globally in 2012.

Geographic reference: World
Year: 2012
Market size: 2.2 billion liters (by way of comparison, world consumption of beer annually is in the range of 148 billion liters)
Source: E.H. “Why Are Sales of Non-alcoholic Beer Booming?” The Economist, August 11, 2013, available online here.
Posted on September 17, 2013

Seaborne Freight

SeaborneFreight

The most energy efficient means of moving freight is by moving it over water. The increase in global trade over the last few decades and particularly the increase in moving raw materials long distances as part of the overall manufacturing process has meant a significant rise in seaborne freight. The chart we offer here shows that increase by charting the tonnage moved annually by sea, broken into three categories: (1) tonnage moved in shipping containers, (2) movements of oil and gas, and (3) movements of cargo in bulk which includes all those things which may be moved in a dry cargo container ship. This final category is further broken down into the five major bulk products and all other bulk. The five major bulk products are iron ore, grain, coal, phosphates and bauxite.

The overall trajectory of growth is clear. What may not be quite as clear is the growth in how much of that freight is moved in container ships, the category shown in blue at the bottom of each bar. The growth of containerized freight movements has been the most striking. Over the period 1990 to 2012 the movement of containerized freight, when measured in tons moved, increased by 16% per year For those interested in more on container shipping, here’s a link to an earlier post we did covering the container ship market.

Today’s market size is the number of tons of freight moved by sea in 2000 and 2012. Of these totals, the percentage of freight moved in container ships, and thus, for the most part, finished goods as opposed to raw materials, was 10% in 2000 and 16% in 2012.

Geographic reference: World
Year: 2000 and 2012
Market size: 5,984 and 9,297 million tons respectively
Source: “Figure 1.2 International Seaborne Trade, by Cargo Type, Selected Years, 1980-2012,” Review of Maritime Transportation 2012, United National Conference on Trade and Development, 2013, page 9, available online here.
Original source: United Nations
Posted on August 19, 2013

Moroccan Argan Oil Hair Products

Some say it strengthens hair and tastes good drizzled on a salad. Moroccan argan oil is the latest new trend in the personal-care market. Argan oil is appearing in more and more products as one of the highlighted ingredients. Under fair trade production standards, dime-sized kernels from acorn-shaped nuts are extracted by hand by Moroccan women earning the equivalent of $4 a day. These kernels are then ground down and the oil extracted. The wholesale price of argan oil in 2011 was approximately $30 per liter while in beauty boutiques around the world, a liter of argan oil sells for around $400.

In 2012, Morocco exported 700 tons of the oil, twice that exported in 2007. Today’s market size is the number of hair products containing argan oil that were introduced in 2008 and 2012.

Geographic reference: United States
Year: 2008 and 2012
Market size: 29 and 588 respectively
Source: Matthew Boyle, “Cosmetics’ Hot Elixir: Argan Oil From Morocco,” Bloomberg Businessweek, July 25, 2013, available online here.
Original source: Mintel
Posted on August 6, 2013

Apparel Exports from Bangladesh

The enormous loss of life resulting from the collapse of a garment factory in Bangladesh a few weeks ago has brought the media spotlight onto that country, as well as the global network of low-end apparel manufacturing. Bangladesh, with a population of approximately 164 million, is the world’s second-largest exporter of apparel. The first largest is China with 1.35 billion people.

Today’s market size is the value of all apparel exports from Bangladesh last year. Of that total, a quarter came as general imports to the United States ($4.47 billion).

Geographic reference: Bangladesh
Year: 2012
Market size: $18 billion
Source: Adam Davidson, “Clotheslined,” The New York Times Magazine, May 19, 2013, pages 16-17.
Original source: A&M University, Texas, Prof. Munir Quddus
Posted on May 20, 2013

The Clothes We Buy

The decline of apparel manufacturing in the United States is an interesting development and outcome of globalization over the last decade or two. It is estimated currently that only 2% of apparel purchased in the United States is made in the United States.

Today’s market size is the value of imported apparel and accessories into the United States in 2002 and 2012.

Geographic reference: United States
Year: 2002 and 2012
Market size: $62.31 and $81.19 billion respectively
Source: “U.S. International Trade Statistics,” (315 Apparel and Accessories), a searchable database presented by the Census Bureau and available online here.
Original source: U.S. Department of Commerce, Bureau of the Census
Posted on May 6, 2013

Petroleum Product Imports from Egypt

Petroleum from Egypt

The graph to the right shows crude oil and petroleum product imports to the United States from Egypt, from 1993 through 2012. The trade in petroleum products is one that is strongly influenced by geopolitical concerns. The rise in imports from Egypt into the United States in 2012 may well be seen, at least in part, as an attempt by the United States to help stabilize that country after its revolution of 2011.

Egypt’s domestic consumption of its fuel has been rising steadily for decades as its population increased rapidly. Consequently, its exports of petroleum products (from crude oil to fuel ethanol) declined. However, when one of its major industries, tourism, was devastated by the upheavals of 2011 and continued political unrest in wake of the revolution, Egypt has been forced to increase exports in other areas as much as possible in order to meet its foreign currency debt payment obligations.

Today’s market size is the number of barrels of crude oil and petroleum products imported by the United States from Egypt, in 2012.

Geographic reference: United States and Egypt
Year: 2012
Market size: 11.44 million barrels, or 0.29% of all such imports into the United States that year.
Source: “U.S. Imports by Country of Origin,” a detailed statistical presentation on “Petroleum & Other Liquids,” dated March 15, 2013, published by the U.S. Energy Information Administration. The table is available online here.
Original source: U.S. Energy Information Administration
Posted on April 18, 2013

Gold Demand

Gold demand trends worldwide, 1992-2012

The sharp rise in the price of gold since 2007 is a sign of how uncertain the financial world feels to many people since it went through a serious crisis in 2008. Although the United States abandoned the gold standard in 1933—thus severing the direct convertibility of the U.S. dollar for a set weight and quality of gold—gold is still seen as one of the precious metals that will hold its value during deflationary times or times when other investments are risky. The trade in gold tends to rise during uncertain times as does the price of gold. The annual average price of gold rose during the first decade of the century by 340%, from $279.1 per troy ounce to $1,224.5.

Today’s market size is the volume and value of gold traded in 2000 and in 2012. The graph shows what the global demand for gold has done annually over the period 1992–2012. The increased demand in the last few years has been large but not nearly as large as the rise in the price of gold.

Geographic reference: World
Year: 2000 and 2012
Market size: 3,818 tons valued at $34.26 billion and 4,405 tons valued at $236.40 billion respectively
Source: “Gold Demand Trends, Full Year 2012,” February 2013, World Gold Council, available online here. The graph was produced with data from this same report, as well as the earlier editions of the same, from 1996 and 2005, both of which are available on the same WGC website cited above.
Original source: LBMA, Thomson Reuters GFMS, and World Gold Council
Posted on February 28, 2013

Container Ships

The sharp rise in global trade over the last decades has been a boon to the shipping industry. The number of large container ships, which move so much of the increased quantity of partially and/or fully finished products being traded internationally, has grown and that growth is anticipated to continue through 2016 according to the World Shipping Council. The size of those ships is also on the rise.

The capacity of container ships—referred to in the trade as cellular vessels as they are designed to efficiently load and store freight containers one on top of the other with vertical braces at the four corners—is measured in terms of twenty-foot equivalent units (TEUs), or the number of twenty-foot containers that the vessel can carry (these containers measure 20′ x 8′ x 8’6″). In the year 2000, the world fleet of container ships was primarily made up of ships with a capacity of 1,000 or fewer TEUs. Vessels this size made up approximately three-quarters of the world fleet. In 2012, they represented less than 30% of the fleet with much larger vessels dominating the trade. While the number of ships rose by only 2.8% between 2000 and 2012, the fleet’s carrying capacity almost tripled, rising 182%. So, the average per container ship capacity went from 1,200 TEUs in 2000 to 3,295 in 2012.

Today’s market size is the number and carrying capacity of cellular shipping vessels worldwide in 2000, in 2012, and a projection for where this fleet will stand in 2016.

Geographic reference: World
Year: 2000, 2012, 2016
Market size: Number of ships respectively: 4,828; 4,961 and 5,433
Market size: Carrying Capacity in million TEUs: 5.8; 16.34 and 19.83
Source: “Container Ship Types,” GlobalSecurity.org, July 7, 2011, available online here. “Cellular Fleet Forecast,” Alphaliner, February 2013, available online here.
Original source: Alphaliner
Posted on February 21, 2013

High School Wrestlers

Our attention was caught last week by the announcement from the International Olympic Committee that it had recommended the elimination of wrestling from the Olympic Games starting in 2020. Their decision will not be ratified until later this year so one can expect to see wrestling fans around the world gathering their resources to defend the sport and its inclusion in the Olympic Games after the games of 2016. After all, wrestling was one of the original sports in the ancient games, has been in the modern games since they were reestablished in 1896 and wrestling is a recognized sport in 180 countries.

Today’s market size is the number of high school students participating in wrestling in the United States during the academic year, 2010-2011. In that school year, wrestling was the 6th most popular sport for high school males. The source document, linked to below, provides data on high school participation in all major sports programs.

Geographic reference: United States
Year: 2010-2011
Market size: 280,384
Source: “2011-2012 High School Athletics Participation Survey,” August 2012, available online here.
Original source: National Federation of State High School Associations
Posted on February 19, 2013

U.S. Exports

US Exports in Goods and Services Annually 1980-2012

The expansion of international trade over the last two decades has trans- formed the world in many ways and led to what is commonly referred to as, simply, globalization. Today we look at U.S. exports annually since 1980, divided into all goods exported and all services exported. To see the trend clearly—not that it is subtle—we have prepared a graph that shows U.S. exports of goods and services in two separate lines. They are shown in constant dollars (base year 2000) so that the impact of inflation has been removed and what one sees is the actual rise in exports from the United States.

While services still make up a smaller share of all exports than do goods—30% in 2010, up from 17.5% in 1980—the United States exports more services than it imports. This gives service exports a positive trade balance, something not seen with goods exports since the mid-1970s. The services exported are broken into several large categories as follows, each with its share of total 2012 exports in parenthesis: Travel (20.6%); Passenger Fares (6.4%); Other Transportation (7.0%); Royalties and License Fees (19.5); Other Private Services (among these are financial services and computer services) (45.0%); Transfers under U.S. Military Sales Contracts (2.9%), and Misc. Government Services (0.2%).

Today’s market size is the value of exported goods and exported services from the United States in 2012.

Geographic reference: United States
Year: 2012
Market size: Goods, $1.564 trillion and Services, $623 billion
Source: “U.S. International Trade in Goods and Services, December 2012,” U.S. Bureau of Economic Analysis, February 8, 2013, available here. the graph was made with data from another Census Bureau report, “U.S. Trade in Goods and Services – Balance of Payments (BOP) Basis,” June 2012, available as either a PDF or Excel spreadsheet from their website here.
Original source: Two bureaus in the U.S. Department of Commerce; the Census Bureau and the Bureau of Economic Analysis
Posted on February 8, 2013

Intercountry Adoptions

Foreign Adoptions and Fertility Rates

The decade between 1995 and 2005 was a high point in adoptions by U.S. citizens of children from other countries, as can be seen in the graph. Since then, the numbers of adoptions has plummeted despite growing waiting lists of U.S. citizens interested in adopting. The reasons for the decline are varied but explained this way in a report by Time magazine, “… a combination of forces in the developing world, from reform efforts to economic growth to resurgent nationalism, is turning the attitude against the practice, even in countries where kids may need the most help.”

Today’s market size, we use the term market loosely here, is the number of children adopted by U.S. citizens from abroad in 2004 (the peak year for intercountry adoptions) and 2012. The graph shows the number of children adopted in this way each year from 1991 through 2012 as well as the fertility rate in the United States for each of these years. The fertility rate is the number of children born for every 1,000 women of childbearing age, namely 15 to 44 years.

Geographic reference: United States
Year: 2004 and 2012
Market size: 22,991 and 8,668 respectively
Source: Kayla Webley, “The Baby Deficit,” Time, January 21, 2013, page 34. “Statistics – Adoptions by Year,” a report put out by the U.S. State Departments’ Bureau of Consular Affairs and available online here. “International Adoption Facts,” a report published by The Evan B. Donaldson Adoption Institute in 2002 and available online here. “National Vital Statistics Reports — Births: Final Data for 2010, August 28, 2012, U.S. Department of Health and Human Services, Centers for Disease Control and Prevention (CDC), available online here, with updates from another CDC report available here.
Posted on February 1, 2013

Cuban Imports

On the whole the United States has been a supporter and booster of free trade and globalization since the end of the second World War and with increased energy since the 1990s. Yet with one neighboring country, Cuba, trade relations have been unusual. The frictions in trade between the United States and Cuba date back to the 1950s and the Cuban Revolution, followed by a forty-year trade embargo imposed by the United States. In 2000, President Clinton signed the Trade Sanctions Reform and Export Enhancement Act which opened the door for some restrictive trade with Cuba, specifically, U.S. exports of farm and forestry products and some medicines. The act did not open the door for any imports from Cuba.

Today’s market size is the total value of products exported from the United States to Cuba in 2000, 2008, and 2011. The drop in exports from 2008 to 2011 is largely the result of the fact that under the restrictions imposed on this trade, Cuba is required to pay in advance for all U.S. imports in cash, something that became much harder as the financial crisis of 2008 took hold. By way of placing this level of international trade into perspective, according to CIA estimates, Cuba’s imports in 2011, from all over the world, totaled $14 billion.

Geographic reference: United States and Cuba
Year: 2000, 2008, 2011
Market size: $1.3, $711.5, and $363.3 million
Source: “2011 Exports of NAICS Total All Merchandise,” and interactive, online data resource published by the International Trade Administration and available online here. “The World Factbook,” entry on Cuba, published by the U.S. Central Intelligence Agency and make available online here.
Original source: ITA (U.S. Department of Commerce, International Trade Administration) and the CIA
Posted on January 11, 2013

Champagne

By definition, champagne is a product of France. In order to be called champagne, a sparkling wine must be made with grapes from the Champagne region of France and must meet an additional set of requirements imposed by the Comité Interprofessionel du Vin de Champagne (CIVIC). The United Kingdom is the largest importer of champagne, followed by the United States and then Germany. U.S. imports of champagne started off the first decade of the new century averaging 18 million bottles annually, it peaked at 23.2 million bottles in 2006 and fell thereafter for three consecutive years. In 2010, champagne imports to the United States saw a small increase from prior year imports.

Today’s market size is the estimated total number of bottles of champagne exported by France in 2011.

Geographic reference: Worldwide
Year: 2011
Market size: 335 million bottles
Source: Tiffany Hsu, “Champagne Sales Surged in 2011, Booze Headed for 2012 Boost,” January 1, 2012, Los Angeles Times, available online here.
Original source: Comité Interprofessionel du Vin de Champagne and the Champagne Bureau
Posted on December 27, 2012

World Cement Market

Cement production in the world is dominated by China, whose production in 2011 accounted for 53.7% of all cement made globally. The third largest cement company in the world is China National Building Materials Company Limited often seen abbreviated as CNBM. Chinese companies also account for 7 additional companies on the 2011 list of the top 20 cement companies globally. The top two companies on that list are Lafarge (from France) and Holcim (from Switzerland).

Today’s market size is the total number of metric tons of cement produced worldwide in 2011, a number which represents a 9% increase on the 2010 figure.

Geographic reference: Worldwide
Year: 2011
Market size: 3.6 billion metric tons
Source: “Top 20 Global Cement Companies,” Global Cement Magazine, December 2012, page 14.
Original source: European Cement Association
Posted on December 13, 2012