Injectable Cosmetic Treatments

injectable cosmetic treatments syringe

The two most popular types of minimally-invasive cosmetic treatments in the United States are botulinum toxin type A and soft tissue filler injections. Both are used to temporarily reduce or eliminate wrinkles. Botulinum toxin type A — commonly known as Botox, but other brand names include Dysport and Xeomin — is a neurotoxin derived from bacteria. It blocks nerve signals to the muscle in which it’s injected. The muscle is unable to contract thereby eliminating wrinkles. It’s most commonly used to smooth frown lines, forehead creases, and crows feet. Soft tissue fillers, also known as dermal fillers, are gel-like substances injected under the skin to smooth out wrinkles. They’re also used to enhance lips and improve symmetry among facial features. The U.S. Food and Drug Administration has approved several types of fillers: hyaluronic acid, calcium hydroxylapatite, poly-l-lactic acid, and polymethylmethacrylate. Hyaluronic acid and calcium hydroxylapatite are naturally found in skin and bones, respectively. Poly-l-lactic acid and polymethylmethacrylate are synthetic, biocompatible substances. Some brand names include Juvéderm, Radiesse, Sculptura, and Bellafill.

Today’s market size shows the amount spent on injectable cosmetic treatments in 2016 and forecast for 2025 worldwide. In the United States, more than 10 million injectable cosmetic treatments were performed in 2018. Botulinum toxin type A procedures were the most popular; 7.4 million were performed, up 5.4% from 2016. Nearly 2.7 million soft tissue filler procedures were performed in 2018, a 2.9% increase from 2016. While women still comprise the vast majority of patients, globally an estimated 15% of injectable cosmetic treatments are performed on men.

Geographic reference: World
Year: 2016 and 2025
Market size: $6.5 billion and $17.2 billion, respectively
Sources: “Facial Injectables Market Analysis by Product (Collagen, Hyaluronic Acid, Botulinum Toxin Type A, Calcium Hydroxylapatite, Polymer Fillers), by Application (Aesthetics, Therapeutics), by Region, and Segment Forecasts, 2018 – 2025,” Grand View Research Press Release, May 2017 available online here; “Global Facial Injectables Market Size Worth $17.2 Billion By 2025,” Grand View Research Press Release, May 2017 available online here; 2018 National Plastic Surgery Statistics, American Society of Plastic Surgeons, March 2019 available online here; 2017 Plastic Surgery Statistics Report, American Society of Plastic Surgeons, 2018 available online here; “What Is Botulinum Toxin Type A?” American Society of Plastic Surgeons available online here; “Hold Still,” The Economist, February 9, 2019, page 22; “Injectable Fillers Guide,” American Board of Cosmetic Surgery available online here.
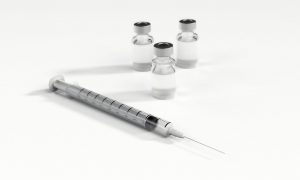
Image source: qimono, “syringe-shot-medicine-bottle-1884758,” Pixabay, December 6, 2016 available online here.

Radiopharmaceuticals

radiopharmaceuticals technetium injection

Radiopharmaceuticals are medicinal products containing radioactive isotopes. Radiopharmaceuticals can be swallowed, injected or inhaled and are selected based on the type of tissue or organ that will be scanned or treated. In the manufacturing process, radioactive isotopes and organic molecules bond. It is the organic molecules that transport the radioisotopes to specific tissue or organs. Of the more than 10 million nuclear medicine procedures performed in the United States every year, 85% use the radioisotope technetium-99m.

For diagnostics, after the radiopharmaceutical is administered, the patient’s tissue or organ is scanned using a SPECT or PET scanner,1 allowing the doctor to detect changes at the cellular level. Radiopharmaceuticals are helpful in diagnosing various diseases of the blood vessels, bones, brain, kidney and liver as well as detecting heart disease, heart muscle damage and cancer.

Radioisotopes for diagnosis emit radiation that can be detected outside the body by scanners. Radioisotopes for treatment emit all their energy in a small area; therefore, they’re used for localized destruction of cancer cells. They are also used to treat hyperthyroidism and pain as a result of bone cancer and severe arthritis.

Today’s market size shows the amount spent on radiopharmaceuticals globally in 2018 and forecast for 2023. More than 100 radiopharmaceuticals have been developed using radioisotopes produced by nuclear research reactors or cyclotrons. As of the end of 2018, fifty FDA-approved radiopharmaceuticals were used for the diagnosis and treatment of medical ailments in the United States. GE Healthcare, Curium, Lantheus Medical Imaging, DRAXIMAGE, and Pharmalucence are 5 of the 18 manufacturers of these approved products.2

1 SPECT stands for single photon emission computed tomography. PET stands for positron emission tomography. Often these scans are combined with CT or MRI scans to provide more detailed images.
2 Top 5 based on the number of different FDA-approved radiopharmaceuticals the company manufactures.

Geographic reference: World
Year: 2018 and 2023
Market size: $3.95 billion and $5.26 billion, respectively
Sources: “Radiopharmaceuticals/Nuclear Medicine Market by Type (Diagnostic (SPECT (Technetium), PET (F-18)), Therapeutic (Beta Emitters (I-131), Alpha Emitters, Brachytherapy(Y-90))), Application (Oncology, Thyroid, Cardiology) – Global Forecasts to 2023,” MarketsandMarkets Press Release, Accessed February 18, 2019 available online here; “FDA-Approved Radiopharmaceuticals,” Cardinal Health, December 28, 2018 available online here; Phillippe van Put, “What Is Nuclear Medicine?” available online here; “Radiopharmaceutical (Oral Route),” Mayo Clinic available online here; “Radiopharmaceutical Production,” International Atomic Energy Agency available online here; “Nuclear Medicine,” National Institute of Biomedical Imaging and Bioengineering, July 2016 available online here; Haley Hansen, “Niowave Enters $4 Billion Medical Isotope Market,” Lansing State Journal, February 18, 2019, pages 1A and 4A; Dr. Craig Hacking and Dr. Ayush Goel, et. al., “SPECT vs. PET,” Radiopaedia available online here.
Image source: Bionerd [CC BY-SA 3.0], via Wikimedia Commons. No alterations were made to image.

Halal Nutraceuticals and Vaccines

NutraceuticalsAccording to recent research, more than 60% of the 1.8 billion Muslims around the world consume nutraceuticals in some form daily.1 Nutraceuticals are products that provide health benefits in addition to their nutritional value. They are thought to improve overall health, delay the aging process, prevent chronic diseases and increase life expectancy. They can be in the form of fortified foods and beverages or dietary supplements. In 2016 the global nutraceutical market was valued at nearly $200 billion. Not all nutraceuticals are halal, however.

Halal, translated as “lawful” or “permitted”, is a set of dietary guidelines based on the Qur’an. By definition, halal foods (which include dietary supplements and vaccines) are “free from any component that Muslims are prohibited from consuming according to Islamic law” and “processed, made, produced, manufactured and/or stored using utensils, equipment and/or machinery that have been cleansed according to Islamic law.”2 Many nutraceuticals contain beta-carotene, gelatin, stearates, glycerine, enzymes, emulsifiers and flavors that may be derived from unpermitted, or haram, ingredients such as pork. However, companies can substitute plant, fish or other permissible foods in the manufacture of these ingredients in order to make them halal and permissible for Muslims to consume.

Vaccines have become less popular among Muslims as evidenced by several outbreaks of preventable diseases such as polio, pertussis, and measles in majority Muslim countries in recent years. While some of the hesitancy about vaccines is due to misinformation spread by social media and influential celebrities, a majority of parents who fail to vaccinate their children cite concerns about the vaccines not being halal. Islamic law, however, does recognize that in dire and necessary circumstances, necessity outweighs prohibitions. “The Fatwa Council in Malaysia and internationally have ruled that vaccination is permissible for the purpose of treatment and prevention, and refusing vaccinations will result in greater harm.”3 Before 2018, there were no halal-certified vaccines available globally. The pharmaceutical company AJ Pharma Holding Sdn Bhd is expected to open a facility in Malaysia sometime in 2018 that will create halal vaccines and export them around the world. According to the company, the worldwide halal vaccine market will be worth between $1.3 billion and $1.4 billion by 2020. Overall, the global vaccine market, of which the halal vaccine market is a part, is expected to reach $34.7 billion in 2020, according to Evaluate Pharma.

Today’s market size shows the expected revenues earned from the sales of halal nutraceuticals and vaccines in 2018 and 2023 worldwide. Leading companies in these industries include Abbott Laboratories, AJ Biologics Sdn Bhd, PT Kalbe Farma Tbk, Amway, NoorVitamins, Chemical Company of Malaysia Berhad, Agropur Inc. and Kotra Pharma (M) Sdn Bhd.

1 “Halal Guidelines,” Halal International Certification Pvt Ltd., 2016.
2 “What is Halal? A Guide for Non-Muslims,” Islamic Council of Victoria.
3 Ali Ahmed, et. al., “Outbreak of Vaccine-Preventable Diseases in Muslim Majority Countries,” Journal of Infection and Public Health, March-April 2018, pages 153-155.

Geographic reference: World
Year: 2018 and 2023
Market size: $39.3 billion and $81.2 billion
Sources: Stefan Marwa, “Global Halal Nutraceuticals & Vaccines Market Size to Worth USD 81,207 Million by 2023,” Healthcare Journal, April 9, 2018 available online here; “Halal Guidelines,” Halal International Certification Pvt Ltd., 2016 available online here; Conrad Hackett and David McClendon,” Christians Remain World’s Largest Religious Group, But They Are Declining in Europe,” Pew Research Center, April 5, 2017 available online here; Hamid Nasri, et. al., “New Concepts in Nutraceuticals as Alternative for Pharmaceuticals,” International Journal of Preventative Medicine, December 2014, pages 1487-1499 available online here; “What is Halal? A Guide for Non-Muslims,” Islamic Council of Victoria available online here; Ali Ahmed, et. al., “Outbreak of Vaccine-Preventable Diseases in Muslim Majority Countries,” Journal of Infection and Public Health, March-April 2018, pages 153-155 available online here; Salama, “AJ Pharma to Turn Malaysia into Halal Vaccine Hub,” Halal Focus, January 6, 2018 available online here; Pearl Liu, “Annual Hajj Points to Untapped, Growing Halal Vaccines Market,” BioWorld available online here; and “Global Nutraceuticals Industry Report: 2017-2021 – Analysis of the Multi-Billion Functional Food and Beverage Industries – Research and Markets,” PR Newswire Press Release, March 13, 2017 available online here.
Image source: kerkanno, “acupuncture-alternative-aroma-906144,” Pixabay, August 28, 2015 available online here.

Intraocular Lenses

intraocular lenses, eyeIntraocular lenses are artificial lenses that are implanted in the eyes to replace a person’s natural lenses that were damaged by cataracts or another eye disease. Monofocal-type intraocular lenses captured the largest share of the market in 2015. Why? They cost less than other types of intraocular lenses, insurance companies are more likely to adequately reimburse providers for implanting them, and monofocal lenses have fewer post-operative complications than other types of lenses according to the source.

Although hospitals were the highest end users of intraocular lenses in 2015, ambulatory surgery centers and ophthalmology clinics are expected to experience a higher compound annual growth rate in their use of these lenses from 2016 to 2024 due to the growing popularity of outpatient cataract surgery at these venues. An aging population with an increased incidence of cataracts, an acceptance of more technologically advanced products and techniques, and a demand for premium intraocular lenses by patients led to North America having the highest share of the global intraocular lens market in 2015. North America’s share, valued at more than $1.1 billion, accounted for more than a third of the global market that year.

Today’s market size shows the total value of sales of intraocular lenses globally in 2015 and projected for 2024. Five manufacturers of intraocular lenses combined—Biosensors International, Biotronik, Terumo Europe NV, Abbott Laboratories, and Boston Scientific, Inc.—had an 80.5% share of the market in 2016.

Geographic reference: World
Year: 2015 and 2024
Market size: $3.2 billion and $5.0 billion, respectively
Sources: “Global Intraocular Lens Market Size US$5.0 bn by 2024,” Transparency Market Research, Nasdaq GlobeNewswire Press Release, November 29, 2017, available online here and “Intraocular Lenses Market,” Transparency Market Research available online here.
Image source: Engin_Akyurt, “eye-human-macro-beauty-portrait-2586698,” Pixabay, December 1, 2016, available online here.

Skin Grafting Market

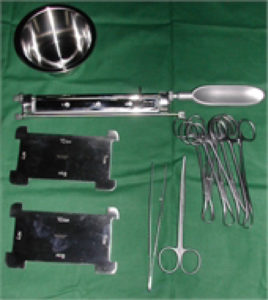
Skin grafting is a surgical procedure in which healthy skin is removed from one part of the body and attached to another part of the body that was damaged by burns, trauma, infection or disease. While skin grafting has been done for centuries, first recorded around 600 BC in India, most modern skin grafting has been done in the past century and a half. Since the 1870s and 1880s, the depth of the donor skin has been recognized as a major factor in healing. Back then surgeons would freehandedly remove the skin using a knife, the depth of the donor skin controlled by varying the angle of the knife. Starting in the early 1900s, various knives with attached guards that could be calibrated in order to more accurately measure the depth of the donor skin were used. In 1939, a semi-cylindrical calibrated dermatome was invented by Dr. Earl Padgett and George J. Hood. Until this time, only expert plastic surgeons would be able to cut skin grafts, but now any trained surgeon was able to do so. This was a major advancement in the treatment of wounded soldiers during World War II. Since then various technological advancements have improved the accuracy of the dermatomes surgeons use today.

Today’s market size shows the projected total revenue earned from the global sales of skin grafting instruments and supplies in 2018 and 2023. According to the source, the skin grafting market is expected to have a compound annual growth rate of 12.29% over this time period. As bioengineered skin and skin substitute technologies become more advanced, the need for skin grafts using a person’s healthy skin may diminish for some applications. In 2015, the top three companies developing bioengineered skin and skin substitutes were MiMedx, Organogenesis and Integra LifeSciences.

Geographic reference: World
Year: 2018 and 2023
Market size: $3.8 billion and $6.8 billion, respectively
Sources: “Global Skin Grafting Market Forecasts to 2022 – Total Market Size to Reach US$6.825 Billion by 2023 – Research and Markets,” BusinessWire Press Release, December 15, 2017 available online here; “Skin Graft,” MedlinePlus, December 21, 2017 available online here; Faisal Ameer, Arun Kumar Singh, and Sandeep Kumar, “Evolution of Instruments for Harvest of the Skin Grafts,” Indian Journal of Plastic Surgery, January-April 2013 available online here; “Dermatome (instrument),” Wikipedia, March 4, 2017 available online here; and “U.S. Market Shares 2015: Bioengineered Skin & Skin Substitutes,” MedMarket Diligence, May 7, 2017 available online here.
Image source: Adapted from “Set, Skin Graft, Instruments,” International Federation of Red Cross and Red Crescent Societies Emergency Items Catalog, January 1, 2011 available online here.

Blood Donation

Blood donations
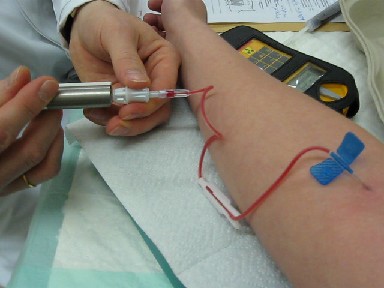
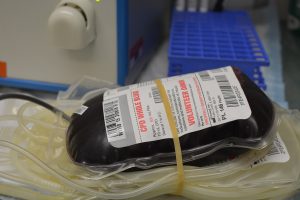
Nearly 45% of blood donors are over the age of 50 and 60% are over the age of 40. According to Marie Forrestal, president of the Association of Donor Recruitment Professionals, those who grew up during World War II and their children saw giving blood as a civic duty. They realized the importance of the country keeping an adequate supply of blood on hand. People in their 20s or 30s, however, are less likely to donate than other age groups, and as a result, as the older donors age and can no longer donate, there are fewer younger people to take their place.

Over the past decade, blood banks have focused their recruitment efforts on teenagers and young adults through blood drives at high schools and colleges and through the use of social media. Although people lined up to donate blood after tragedies like 9/11, the Pulse nightclub shooting, and more recently after the mass shooting in Las Vegas, few of those people come back to donate when the crisis has passed. From 2013 to 2017 the number of blood donors dropped by about 800,000. Because of this, some parts of the country occasionally experience blood shortages, especially during the summer, the winter holidays, and flu season.

Today’s market size shows the number of blood donations in 2013 and 2017. Because of improved surgical techniques and an emphasis on blood conservation, the number of units of whole blood and red blood cells transfused dropped by 4.4% from 2011 to 2013, the last years for which data are available. During this time period, the number of donations dropped 12.1%. From 2013 to 2017, the number of units of blood donated dropped 22.5%.

Geographic reference: United States
Year: 2013 and 2017
Market size: 14.2 million units and an estimated 11 million units respectively
Sources: Aleccia, JoNel, “As Blood Donors Age, Industry Eyes Young Blood,” USA Today for the Lansing State Journal, September 24, 2017, page 6B; “Survey Report Fewer Blood Collections and Transfusions in 2013,” Transfusion News, September 7, 2016 available online here.
Original source: AABB
Image source: rdelarosa0, “blood-donation-give-732297,” Pixabay, April 21, 2015 available online here.

Traditional Chinese Medicine

Traditional Chinese medicineTraditional Chinese medicine (TCM) is a 2,500-year-old system of diagnosis and treatment that emphasizes the prevention of diseases. TCM medicines are tailored to each individual and may need to be altered from time to time, therefore, patients are encouraged to see their TCM doctor frequently. After the fall of the Qing dynasty in 1911, TCM was regarded as superstition but in recent years the practice has seen an increase in popularity. An interest in preventative medicine as a way to avoid costly trips to the hospital as well as President Xi Jinping’s endorsement of it, calling it “the gem of Chinese traditional science,” have contributed to its popularity. In 2015 there were 452,000 licensed practitioners in China, an increase of 50% from four years prior. One-third of China’s pharmaceutical market consists of TCM medicines approved by the government.

Today’s market size shows the number of hospitals in China that offered TCM either alone or in conjunction with modern medicine in 2003 and 2015.

Geographic reference: China
Year: 2003 and 2015
Market size: 2,500 and 4,000 respectively
Source: “Health Care With Chinese Characteristics,” The Economist, September 2-8, 2017, pages 37-38.
Image source: mac8739, “chinese-medicine-donguibogam-2178253,” Pixabay, April 2017 available online here.

Smart Wearable Healthcare Market

fitbit-imgThe market for smart wearable healthcare devices is one part of the larger smart wearables market as a whole. The term wearables is used to refer to any electronic device, usually small, that can be worn relatively easily during the normal activities of life. Examples include wristbands such as the Fitbit, smart watches, clip on devices like pedometers and even clothing into which sensors have been sewn.

Smart wearable healthcare devices are those that are specifically designed to help a person monitor his or her own health—activity level, hours of sleep, heart rate, temperature, blood pressure, etc.—as well as devices designed to communicate remotely with medical providers so that they may monitor a patient from afar.

Geographic reference: United States
Year: 2014 and forecasted for 2020
Market size: $2 billion and $41 billion respectively
Source: “Healthy Beats — With Health Being the ‘Great Motivator,’ Wearables Are Gaining Popularity,” Corp! Sept./Oct. 2016, pages 36-39.
Original source: Soreon Research

Training Doctors

The education and training of a doctor is a long and costly endeavor. First comes the classroom education, the cost of which is picked up, for the most part for those not fortunate enough to get a scholarship, by the future doctor him or herself. Then comes a final on-the-job training period in which doctors with new diplomas spend four or more years working in a residency program.

During this residency, doctors in training see and treat patients under the supervision of more seasoned physicians. Most of these residency programs are carried out in teaching hospitals, which account for approximately 20% of the nation’s hospitals. Residency programs are arduous. Residents are expected to routinely work 80 hours a week and they are paid half or far less of what they will receive for much the same work after the residency. This training is expensive for the system as a whole and has been, for all practical purposes, nationalized.

The U.S. federal government pays for most of this training with money from the Medicare and Medicaid systems. Our market size today is the money spent by the federal government annually to support this graduate medical education.

Geographic reference: United States
Year: 2012
Market size: $11.5 billion of U.S. government funds are used to support residency slots in training hospitals, approximately 115,000 in 2012
Source: Catherine Dower, “Graduate Medical Education,” a health policy brief published in Health Affairs, on August 31, 2012 and available online here.
Original source: U.S. Department of Health and Human Services, Center for Medicare and Medicaid Services
Posted on January 22, 2014

Home Health Care Services

With an aging population it will come as no surprise to most people that the home health care services industry has seen steady growth over the last decades and is forecast to see continued growth well into the next decade.

Today’s market size post is the revenue earned in 2002 and 2012 by all firms with employees in the business of providing home health care services in the United States. This industry [NAICS 6216] is defined as follows by the Census Bureau: “This industry comprises establishments primarily engaged in providing skilled nursing services in the home, along with a range of the following: personal care services; homemaker and companion services; physical therapy; medical social services; medications; medical equipment and supplies; counseling; 24-hour home care; occupation and vocational therapy; dietary and nutritional services; speech therapy; audiology; and high-tech care, such as intravenous therapy.”

Geographic reference: United States
Year: 2002 and 2012
Market size: $30.39 billion and $66.07 billion respectively
Sources: (1) “Table 8.1. Health Care and Social Assistance (NAICS 62)—Estimated Revenue for Employer Firms: 2002 Through 2010,” Service Annual Survey 2010, February 2012, page 151, available online here. (2) “Table 1 – Selected Services Estimated Quarterly Revenue for Employer Firms Fourth Quarter 2003 Through Fourth Quarter 2012,” Annual Benchmark Report for Services through 2012, a link to which is available on the U.S. Census Bureau’s website, here.
Original source: U.S. Department of Commerce, Bureau of the Census
Posted on November 13, 2013

Pharmacy Benefit Managers

The cost of prescription drugs in the United States is a subject about which there is much controversy. As the Affordable Care Act—or, Obamacare—gets off to a rocky start across the nation, we decided to look at just one small part of the prescription drug distribution network, about which most people are not particularly conscious. That is the segment made up of Pharmacy Benefit Managers (PBMs), middlemen who stand in a central position in the prescription drug supply chain and who, it turns out, have carved out for themselves a rather lucrative business. The three largest PBMs—Express Scripts, CVS Caremark, and OptumRx—together control about 70% of all prescriptions filled in the United States.

PBMs are firms that provide an administrative service to insurance companies, large self-insured employers, and government benefit providers. They develop and maintain drug formularies—lists of specific drugs to be covered and the prices for each—for their insurance providing customers. They also negotiate with pharmaceutical companies for preferred pricing on the drugs covered in those formularies and they negotiate with retailers to accept those terms and participate in the PBM’s network of preferred pharmacies.

According to an article in Fortune magazine, “PBMs started as paper pushers: They began hand-processing medical claims in the 1970s and evolved into middlemen who touted their ability to use corporate customers’ combined purchasing power to negotiate huge discounts from pharmaceutical companies. Today the top PBMs are as big as or bigger than their clients.” The United States has a unique health care delivery system, one which is significantly fuller of lucrative middleman-businesses than the systems present in other industrialized nations.

Today’s market size is the total estimated revenue earned by Pharmacy Benefit Managers in the United States in 2012.

Geographic reference: United States
Year: 2012
Market size: $250 billion
Source: Katherine Eban, “Painful Prescription,” Fortune, October 28, 2013, pages 202-207.
Original source: J.P. Morgan analysts
Posted on November 4, 2013

Dentistry

Dentists

The practice of dentistry is a part of the overall health care industry and recent trends in this segment of the health care industry show a pattern similar to that of the industry as a whole. Steady growth. The graph shows estimated revenue taken in by Offices of Dentists annually from 1998 through 2012. While the rate of increase slowed a bit after the recession and financial crisis that hit in 2007 and 2008, growth in revenue continued. The growth in revenue for dentist offices between 1998 and 2012 exceeded inflation by 61.6% (dentistry’s 102.6% increase versus inflation which grew 41%).

Factors influencing that rate of growth for dentists are many of the same factors driving the overall health care industry, primarily among them, demographics and technology. As we age, we need more health care services of all sorts, including dental care. Technological advances are a driver in the field because they make available services that simply did not exist before and improve the ones that did. According to the American Dental Trade Association in the early 2000s nearly half of dentists’ revenues were being generated from procedures and treatments that were not available 20 years earlier.

Today’s market size is the total estimated revenue earned by offices of dentists in the United States in 2000 and in 2012.

Geographic reference: United States
Year: 2000 and 2012
Market size: $58.8 billion and $104.3 billion respectively
Sources: “Table 8.1. Health Care and Social Assistance (NAICS 62)–Estimated Revenue for Employer Firms: 2002 Through 2010,” Service Annual Survey 2010, U.S. Census Bureau, February 2012, page 171, a link to which is offered here. Data for years before 2002 come from the Service Annual Survey 2003, available from the same website. The data from 2011 and 2012 come from the “Estimated Quarterly Revenue for Employer Firms, Fourth Quarter 2003 Through Fourth Quarter 2012,” part of the same Annual and Quarterly Services tracking done by the Census Bureau in preparing their annual report. The quarterly data are available here. Jeffrey R. Lavers, “Market Trends in Dentistry,” Dental Economics, available online here.
Original source: U.S. Department of Commerce, Bureau of the Census
Posted on October 24, 2013

High-Deductible Health Insurance Plans

High-deductible health insurance plans are insurance policies in which consumers pay lower monthly premiums but incur higher out-of-pocket costs when visiting doctors and hospitals. In the past decade, high-deductible health plans have become more common. Some believe that these insurance policies will reduce overall health spending, especially on discretionary services, and thereby keep premiums affordable. But some studies show that while trips to the emergency room are reduced, especially for minor ailments, many consumers are also forgoing getting treatment for more serious conditions such as kidney stones or heart trouble. And, when treatment is sought, the cost of treatment is higher due to the increased severity of the illness.

Today’s market size is the number of consumers in the United States with high-deductible health insurance plans as of early 2013, a three-fold increase since 2006.

Geographic reference: United States
Year: 2013
Market size: 13.5 million
Source: Ashley Griffin, “Men Put Off Health Care When It Costs More,” Lansing State Journal, July 21, 2013, pages 1C, 4C
Posted on August 2, 2013

Hospitals in the United States

Hospitals2

Today we update an earlier post on a part of the huge health services industry, namely, hospitals. The graph shows the total annual revenues of all U.S. hospitals as they are defined by the Census Bureau, below, over a fifteen year period. Annual revenues for this industry appear to rise, regardless of economic conditions, recessions, financial crisis, or business cycles.

This industry is identified within the industry coding system, NAICS, with the code 622 and is defined by the Census Bureau as including hospitals whose primary business is to “provide medical, diagnostic, and treatment services that include physician, nursing, and other health services to inpatients and the specialized accommodation services required by inpatients. Hospitals may also provide outpatient services as a secondary activity. Establishments in the Hospitals subsector provide inpatient health services, many of which can only be provided using the specialized facilities and equipment that form a significant and integral part of the production process.”

Geographic reference: United States
Year: 2005 and 2012
Market size: $620.85 billion and $904.47 billion respectively
Source: “Table 1 – Selected Services, Estimated Quarterly Revenue for Employer Firms,” Annual Benchmark Report for Services through 2012, a series of reports put out by the Census Bureau in conjunction with their Service Annual Survey, published every non-Economic Census year. The Service Annual Survey reports are accessible on the Census web site here.
Original source: U.S. Department of Commerce, Economics and Statistics Administration, U.S. Census Bureau
Posted on July 10, 2013

Plastic Surgery

Procedures that fall under the umbrella of plastic or cosmetic surgery include minimally intrusive procedures such as laser hair removal and injections of Botulinum toxin or collagen. They also include more extensive, often reconstructive procedures that are necessary to restore a person after an accident, animal bite, or surgery to remove a tumor, for example.

Today’s market size is the number of, and estimated total spent on, cosmetic surgical procedures performed in the United States in 2012. This includes all surgical procedures but does not include the minimally-intrusive procedures such as chemical peels, laser hair removal nor soft tissue filling procedures. In terms of spending, cosmetic surgeries make up 55.6% of the total spent on all cosmetic procedures and in terms of number of procedures, surgeries account for 10.9% of all procedures.

Geographic reference: United States
Year: 2012
Market size: 1,594,526 surgeries valued at $6.12 billion
Source: 2012 Plastic Surgery Statistics Report, “2012 Average Surgeon/Physician Fees,” American Society of Plastic Surgeons, 2013, page 20, available online here.
Posted on May 3, 2013

Psychiatric Hospitals

A great deal of attention is paid to the health care industry and its remarkable rates of growth. However, one segment of that industry has not experienced growth, has in fact shrunk. That segment is psychiatric hospitals. Because of changing policies and attitudes about how the mentally ill should be treated, psychiatric hospitals have been on a steady decline for many decades in the United States. The number of beds available in psychiatric hospitals in 1955 was equal to 1 bed for every 300 people in the general population. In 2005, that number had fallen to 1 bed for every 3,000 people.

Yet the rate of serious mental illness in the society has not changed during the fifty years between these two measures. This means that many, many mentally ill people end up incarcerated and/or, when they reach a breaking point, in the emergency rooms of general hospitals. According to a 2007 report from the National Health Policy Forum, there were nearly 2 million admissions to general hospitals in 2004 of patients suffering from mental health problems. Clearly, demand for some important things is not met through the mechanisms of a free market.

Today’s market size is the number of beds available in psychiatric hospitals in the United States in 2005.

Geographic reference: United States
Year: 2005
Market size: 99,800
Source: “More Mentally Ill Persons Are in Jail and Prison Than Hospitals: A Survey of the States,” a report published by the National Sheriffs Association and the Treatment Advocacy Center, May 2010, available online here. Eileen Salinshy and Christopher Loftis, PhD, “Shrinking Inpatient Psychiatric Capacity: Cause for Celebration or Concern?” National Health Policy Forum, August 1, 2007.
Posted on April 30, 2013

Nutritional Supplements Market

The market we’re presenting today is one that includes a large range of ingestible products, from vitamins and calcium pills to protein shakes, diet pills and energy drinks. The market is also referred to by various names, among them: nutritional supplements, dietary supplements, and simply, supplements. By whatever the name, this is a lucrative market and one that many people feel is less regulated than would be prudent. The federal guidelines regulating the ingredients used in the production of nutritional supplements are far less restrictive than those imposed on food and drink makers. Worth noting is the fact that federal requirements of pharmaceutical companies are even more restrictive than those regulating the food and drink industry. Nutritional supplements are not bound by the regulations for either of these industries—food and drink nor pharmaceuticals.

The supplements market has been growing steadily since the turn of the century and is expected to continue growing. Driving the growth are a number of factors. An older population looking to supplements to minimize the effects of aging is one such driver. The young, too, are using supplements heavily. Having grown up in a society that appears to approve of the use of chemicals to augment human capacities of all sorts, they turn to supplements to help build muscle, lose weight, and stay awake.

Geographic reference: United States
Year: 2011
Market size: $30 billion
Source: Natasha Singer and Peter Lattman, “Is the Seller to Blame,” The New York Times, March 17, 2013, page B1, available online here. Brittany McNamara, “Monster Energy Switches from Supplement to Beverage,” Nutrition Business Journal, February 14, 2013, available online here.
Original source: Nutrition Business Journal
Posted on March 20, 2013

The Sleep Business

In 2012, approximately three-fourths of internet users searched online for health information. Half of them searched specifically for sleep remedies. According to the National Sleep Foundation, only 56% of Americans report getting a “good night’s sleep” on a typical night. Some sleep studies have found a link between insufficient sleep and hypertension, depression, diabetes, and other illnesses. Spending related to sleep has increased 8.8% yearly since 2008. Spending on over-the-counter sleep aids increased 31% from 2006 to 2011, with the biggest increase being spending on natural and homeopathic products.

Today’s market size is the estimated amount spent in the United States, in 2012, on things designed to aid sleep, from pills and medical devices to sleep consultants who work with hospitals and deluxe mattresses made with tension-relieving foams.

Wishing all our readers a sound night’s sleep!

Geographic reference: United States
Year: 2012
Market size: $32 billion
Source: Kit Yarrow, “The Sleep Industry: Why We’re Paying Big Bucks for Something That’s Free,” Time, January 28, 2013, available online here.
Posted on March 1, 2013

Face-Lift Market

Some people choose to undergo cosmetic surgery because of perceived economic benefits to being more attractive. Some simply feel that they will be happier if they are more attractive according to society’s standards of beauty. Today’s market size shows the amount Americans spent on face-lifts in 2010.

Geographic reference: United States
Year: 2010
Market Size: $845 million
Source: Abigail Tucker, “How Much is Being Attractive Worth?” Smithsonian, November 2012, page 18, also available online here.
Posted on January 4, 2013

Medicare Enrollment

Medicare Enrollment Stats

Today is the 70th anniversary of the attack on Pearl Harbor. Today is also the final day of the Medicare annual enrollment period. Only one of these topics lends itself to a market size post. Worth noting—and by way of tying these two things together a little—is the fact that anyone (now an American citizen) who was around on the day that Pearl Harbor was attacked, is now eligible for Medicare.

Today’s market size is the number of people enrolled in the Medicare health insurance system in the United States in 2010. The graphic provides data on enrollment from 1970 to 2010 and shows how this population relates to the total U.S. population over this period.

Geographic reference: United States
Year: 2010
Market size: 47.2 million
Source: “Table I.1 Medicare Enrollment Trends,” part of the statistical offerings on the Federal Government’s CMS website here.
Original source: Center for Medicare and Medicaid Services, U.S. Department of Human Health and Services
Posted on November 7, 2011