Women-Owned Businesses

Women-owned businesses
On March 8 we celebrate International Women’s Day. A day to bring awareness to gender inequality and injustice across the globe and to inspire people to take action to bring about change. This year, 2020, marks the 25th anniversary of the adoption by 189 United Nations Member States of the Beijing Declaration and Platform for Action. This document presents a way forward toward gender equality not only in the late 20th-century but in the 21st century as well. As Ban Ki-Moon, former Secretary-General of the United Nations, wrote in the Forward of the 20th Anniversary Edition of this document: “When we empower women and girls, we realize a better future for all.”

The Beijing Declaration states: “We are determined to … promote women’s economic independence, including employment, and eradicate the increasing burden of poverty on women…” Two ways to do this are to encourage entrepreneurship and support women-owned businesses.1 Globally in 2018, 252 million women were entrepreneurs, with another 153 million women operating established businesses.

Worldwide for every 10 male entrepreneurs, there are 7 female entrepreneurs. Only 6 countries in the world have equal rates of entrepreneurship among men and women: Indonesia, Thailand, Panama, Qatar, Madagascar, and Angola. The countries with the highest percentage of female entrepreneurs include Angola (40.7% of the adult female population are entrepreneurs), Guatemala (24.5%), Chile (21.2%), Madagascar (21.1%), Peru (20.9%), Thailand (19.3%), Colombia (17.8%), Lebanon (17.4%), Brazil (17.3%), and Sudan (17.1%). Where does the United States rank? 14th, with 13.6% of the adult female population being entrepreneurs.

Why did women establish their businesses? Did they seize opportunities given to them or did they start their businesses out of necessity? In almost all of these countries, a majority of women saw an opportunity to start a business and took it. Only in Angola did more women start businesses out of necessity rather than after an opportunity presented itself, 49.5% versus 47.2%, respectively.

Today’s market size shows the number of women-owned businesses in the United States in 2007, 2012, 2017 and 2019. Data for 2017 and 2019 are projections based on the 2012 Survey of Business Owners from the U.S. Census Bureau and adjusted using the gross domestic product figures for January of that year. Over this time period, the number of women-owned businesses grew by 66.1%. In 2007, 28.8% of businesses in the United States were owned by women; in 2019, 42% were. Revenues increased 54.6%, from $1.2 trillion to $1.85 trillion. While most women-owned businesses have no employees—in 2012, this amounted to about 90%—the number of people employed by those that do increased 24% from 7.5 million in 2007 to 9.4 million in 2019.

Half of all women-owned businesses fall into three industries: other services; healthcare and social assistance; and professional, scientific, and technical services. “Other services” includes hair and nail salons and petcare businesses. Women who start these types of businesses tend to do so out of necessity or a need for a job with flexible hours. “Healthcare and social assistance” includes child daycare and home healthcare. “Professional, scientific, and technical services” includes lawyers, bookkeepers, architects, public relations firms and consultants.

The top 10 fastest-growing women-owned companies in the United States are Not Ordinary Media (revenue of $21.4 million in 2018), nutpods ($19.1 million), Kindred Bravely ($9.6 million), SD3IT ($11.9 million), Skinny Dipped ($10.2 million), TalEx ($48.5 million), TrueChoicePack ($7.8 million), 4th & Heart ($14.3 million), Core Software Technologies ($4.6 million) and WT Stevens Construction ($7.2 million). Not Ordinary Media ranked number 10 on the 2019 Inc. 5000 list with a growth rate of 11,996% from 2015 to 2018. The Inc. 5000 is a list of the fastest-growing privately held companies in the United States.

1 Women-owned businesses are businesses that are at least 51% owned, operated and controlled by one or more women.

Geographic reference: United States
Year: 2007, 2012, 2017 and 2019
Market size: 7.8 million, 9.9 million, 11.6 million and 12.9 million respectively.
Sources: “Statistics for All U.S. Firms by Number of Owners by Industry, Gender, Ethnicity, Race, and Veteran Status for the U.S.: 2007,” 2007 Survey of Business Owners, U.S. Census Bureau, December 15, 2015 available online here; “Statistics for All U.S. Firms by Number of Owners by Industry, Gender, Ethnicity, Race, and Veteran Status for the U.S.: 2012,” 2012 Survey of Business Owners, U.S. Census Bureau, February 23, 2016 available online here; Beijing Declaration and Platform for Action, United Nations, 1995, reprinted by UN Women in 2014 available online here; Global Entrepreneurship Monitor 2018/2019 Global Report, Global Entrepreneurship Research Association, January 21, 2019 available online here; “More Than 250M Women Worldwide Are Entrepreneurs, According to the Global Entrepreneurship Monitor Women’s Report from Babson College and Smith College,” CISION PR Newswire, November 18, 2019 available online here; Brit Morse, “These Are the 20 Fastest-Growing Female-Founded Companies in 2019,” Inc., September 19, 2019 available online here; The 2017 State of Women-Owned Business Report, American Express, 2017 available online here; The 2019 State of Women-Owned Business Report, American Express, 2019 available online here; “Women-Owned Businesses,” U.S. Census Bureau available online here.
Image source: Christin Hume, “Workspace Wonder Woman,” Unsplash, July 12, 2017 available online here

Apprenticeships

Apprenticeships are programs in which employers provide on-the-job mentored training to apprentices, employees who receive related technical and academic instruction at community colleges, technical schools or apprenticeship training programs. Businesses may also provide instruction online and on the job site. Apprentices receive wages that increase as more knowledge and skills are attained. The average starting wage for apprentices in programs registered with the U.S. Department of Labor is $15 an hour. Apprenticeships last between one and six years depending on the type of occupation and the amount of training needed. Graduates receive nationally-recognized industry credentials and in many cases college credit that can be used toward an associate or bachelor’s degree.

Apprenticeships are used to train workers in a variety of industries. Most apprentices work in the construction sector, 166,629, followed by public administration (19,447), manufacturing (15,630), transportation and warehousing (12,335), and utilities (7,281). Electrician is the most popular occupation. Nearly 44,000 apprentices trained to work in this field in 2018. Carpenter (25,921), construction craft laborer (15,612), plumber (14,471), and heavy truck driver (11,410) round out the top 5 apprenticeship occupations.

The expansion of apprenticeship program availability has been signature policies of both former President Barack Obama and current President Donald Trump. However, apprenticeships have yet to win over many parents and educators. While some see apprenticeships as an alternative pathway to a lifelong, well-paying career, especially for students who learn better by doing or those who do not want to take on staggering debt, others see it as a lower-level pathway to employment that will create a two-tier class system: those who can afford to will go to elite colleges and obtain white-collar careers while lower-income students will be discouraged from going to college while encouraged to apprentice in blue-collar professions. Many parents and educators believe that the only way students, especially low-income students, can obtain a high-paying, secure career is through, at minimum, a 4-year college degree.

Today’s market size shows the number of people that were participating in registered apprenticeship programs in the United States in 2013 and 2019.1 Not all apprenticeship programs are registered with the Federal government, however. Some experts estimate that there were about one million apprentices in 2019, one-twentieth the number of those enrolled in colleges and universities. In 2018 there were a total of 23,441 apprenticeship programs registered with the U.S. Department of Labor, 3,229 of which were new programs. This was the highest number of new programs in at least 10 years. According to the U.S. Department of Labor, in the past two years, more than 700 new programs have been created in fields such as cybersecurity, financial services, information technology, healthcare, and other white-collar industries. Overall in 2018, California had the most apprentices, 89,949, followed by South Carolina (20,763), Michigan (20,576), Ohio (19,081), and New York (18,337).

1 Excludes the United Services Military Apprenticeship Program, which had 98,435 apprentices in 2018.

Geographic reference: United States
Year: 2013 and 2019
Market size: 375,000 and 633,625, respectively
Sources: Farah Stockman, “Want a White-Collar Career Without College Debt? Become an Apprentice,” The Denver Post, December 29, 2019, pp. 1K, 6K; “Apprenticeship Toolkit: Frequently Asked Questions,” U.S. Department of Labor available online here; “Data and Statistics,” U.S. Department of Labor, Employment and Training Administration available online here.
Image source: Gerd Altmann, “dream-job-application-location-job-2904780,” Pixabay, November 1, 2017 available online here.

Collaborative Robots

Global Sales of Collaborative Robots
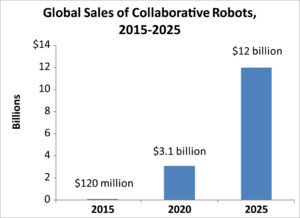
Collaborative robots, or co-bots, are robots that work alongside human workers. Many workers are wary of the increased use of robots in general, fearing the loss of their jobs. M.I.T. and Boston University estimated that up to six people lose their jobs for each robot per 1,000 workers a company adds. Employers, however, cite increased productivity, cost savings, and healthier work environments when robots are used in the workplace. Robots can work in hazardous jobs or do repetitive tasks thereby reducing worker injuries.

Today’s market size shows the total global sales of collaborative robots in 2015, 2020, and 2025. Figures for 2020 and 2025 are projections. According to the Robotic Industries Association, the United States is third behind Japan and China in the total number of industrial robots in use—250,000 in 2017. According to the Brookings Institution, metro Detroit has more than 15,000 industrial robots in place, almost five times the number of any other major city in the U.S.

Geographic reference: World
Year: 2015, 2020 and 2025
Market size: $120 million, $3.1 billion (projected) and $12 billion (projected).
Source: Dolan, Matthew, “Rise of the Robots,” Lansing State Journal, October 30, 2017, page 8A.
Original source: Barclays Equity Research analysts

Employment Websites for Freelancers

Man working with a laptop and notebookAccording to the survey, Freelancing in America: 2016, commissioned by UpWork in partnership with Freelancers Union, 35% of the workforce—55 million people—in the United States were freelancers in 2016. As of June 2017, there were at least 79 active employment websites for freelancers. Employers post jobs they would like to outsource and freelancers apply for or bid on the work. Many of these jobs are temporary, an employer wanting to outsource a particular project for example. Most of the jobs listed on these sites allow the worker to work remotely.

Pricing for these services vary. Some of the firms that run these websites charge employers, freelancers, or both a percentage of the agreed upon hourly wage or fixed-rate salary for the job when a freelancer is hired. Others charge the freelancer a monthly fee or charge employers for posting jobs on their sites. Today’s market size shows the total revenue freelance employment website firms earned in 2016 according to Staffing Industry Analysts, a market research company.

Geographic reference: World
Year: 2016
Market size: $6 billion
Sources: “The Human Cumulus,” The Economist, August 26, 2017-September 1, 2017, page 55; “New Study Finds Freelance Economy Grew to 55 Million Americans This Year, 35% of Total U.S. Workforce,” Marketwired Press Release, October 6, 2016 available online here; Muhammed, Abdullahi, “79 Websites to Get Freelance Jobs Fast,” Forbes, June 16, 2017 available online here.
Original source: Staffing Industry Analysts
Image source: StartupStockPhotos, “Office-startup-business-home-office-594132,” Pixabay, January 9, 2015 available online here.

Exam Preparation Firms

ExamPrep

Business is booming for those involved in the business of helping to prepare students to take examinations, primarily standardized tests ranging from college entrance exams to the tests given children to select for admittance to private kindergarten. The graph provides employment figures nationally from 1998 through 2011 for all firms involved with exam preparation and tutoring. The rate of employment growth in this area has been very strong. From 1998 to 2011 it nearly quadrupled, growing 391%. This was the standout industry within the overall educational service sector, which as a whole saw employment grow 46% over the period. The red line in the graph shows overall sector employment.

The reason we have used employment data to show the growth of this industry is because data on revenues is not plentiful. Growth in revenue for the industry between 1997 and 2007, two Economic Census years, was 331%. Over that same period, employment grew 241%. It is reasonable to assume that between 2007 and 2011, revenue in the industry also kept pace with employment growth, suggesting that this is an industry that was not strongly impacted by the recession of 2007–2009.

Today’s market size is the total value of revenues earned by Exam Preparation and Tutoring businesses in the United States in 1997 and 2007. For those familiar with the NAICS coding system, this industry is NAICS 611691.

Geographic reference: United States
Year: 1997 and 2007
Market size: $815 million and $3.5 billion respectively
Sources: (1) “Educational Services: Geographical Area Series: Comparative Statistics for the United States (2002 NAICS basis): 2007 and 2002,” 2007 Economic Census, U.S. Census Bureau, available online here. (2) Arsen J. Darnay, editor, Information, Finance, & Services USA, 2001, page 549, Gale Group. (3) “2010 County Business Patterns (NAICS),” U.S. Census Bureau, available online here.
Original source: U.S. Department of Commerce, Bureau of the Census
Posted on March 19, 2014

Apprenticeships

YouthUnEm

Apprenticeship programs have been around for centuries. In the most basic sense, an apprentice is somebody learning the skills of a particular trade by working with a skilled worker. In industrialized countries, apprenticeship programs vary greatly from a regulated arrangement between private companies and schools and/or trade unions to less formal arrangements in which a person new to a field of endeavor works alongside somebody already skilled in that field. Most apprenticeship programs include classroom work as well as on-the-job training.

There are many things that play a role in the fluctuations of unemployment rates and these rates tend to be higher for younger people than for those more established in their work lives. Thus, having a youth population that is well trained for the jobs that are available seems a natural aid to keeping the youth unemployment rate down. From the data available on countries of the European Union—where the prevalence of apprenticeship programs is greater than in the United States, although it does vary from country to country—there seems to be a discernible connection between lower youth unemployment rates and the prevalence of robust apprenticeship programs. By way of comparison, we offer the graph that shows the youth unemployment rate for the first decade of the current century for the European Union, for Germany, and for the United States.

While the youth unemployment rate in the European Union as a whole, in 2012, was 23% it ranged widely from a low of 8.1% in Germany to a high of 55.3% in Greece. Interestingly, the two European countries with the lowest youth unemployment rate are also two of the countries in the Union with the most robust apprenticeship programs, Germany and Austria.

In the United States, apprenticeship programs are not as heavily used as they are in Europe. Trade unions used to be primarily a source of such programs in the United States but with the decline in union membership over the last decades these programs have also been in decline. That is until recently. European companies are starting to establish apprenticeship programs in the United States to train the workforce they need for their U.S. facilities.

Today’s market size is the number of people in the United States participating in apprenticeship programs that are registered with the U.S. Department of Labor. The approximate number participating in such programs in Germany is also provided.

Geographic reference: United States and Germany
Year: 2012
Market size: United States: 358,000 (with an additional, approximately 450,000 involved in programs not registered with the Department of Labor)
Market size: Germany: 1.6 million
Sources: (1) “Registered Apprenticeship National Results,” U.S. Department of Labor, Employment and Training Administration, June 7, 2013, available online here. (2) Unemployment Rate by Age Group,” Eurostat, October 31, 2013, available online here. (3) “Apprenticeships: Earn while you learn,” Bureau of Labor Statistics, Summer 2013, available online here.
Original source: U.S. Department of Labor and Eurostat
Posted on December 2, 2013

World Labor Force

LaborForce

On the first day of May, International Labor Day, we thought it only right to report on the world labor force. The graph shows, as a red line, the number of people in the labor force worldwide from 1990 through 2011. These data come from the World Bank which defines the labor force as follows:

Total labor force comprises people ages 15 and older who meet the International Labour Organization definition of the economically active population: all people who supply labor for the production of goods and services during a specified period. It includes both the employed and the unemployed. While national practices vary in the treatment of such groups as the armed forces and seasonal or part-time workers, in general the labor force includes the armed forces, the unemployed, and first-time job-seekers, but excludes homemakers and other unpaid caregivers and workers in the informal sector.

The labor force is, of course, a subset of the overall population and so we’ve included world population on the graph, as well as labor force participation rates, annually. Over the period 1990–2011 the labor force participation rate has actually declined, slightly, from 66.32% to 64.18%. Yet the labor force has grown at a faster rate than has population overall, 39.3% for the participation rate versus 31.4% for world population. Growing longevity is part of the reason for this seeming divergence.

To labor and laboring, within or outside the official labor force!

Geographic reference: World
Year: 2011
Market size: 3.26 billion.
Source: “Labor Force, Total,” part of a data set maintained by The World Bank and available online here. World population data are from the United Nations, Department of Economic and Social Affairs, Population Division (2011).
Original source: The United Nations and The World Bank Group
Posted on May 1, 2013

Nonemployer Professional, Scientific and Technical Services

We recently posted the size of the professional, scientific and technical services market in the United States, here, and today we add detail to that market post by offering the size of a subset of the market. Today we show the revenue for all nonemployer firms in this service industry which represents 8.6% of the total revenue generated by professional, scientific and technical service providers in 2009. Most nonemployer firms are individual proprietorships but some are partnerships and even corporations. The point is, they have no paid employees. There were 21 million such firms in the United States in 2009, 18.7 million of them were individual proprietorships.

Geographic reference: United States
Year: 2009
Market size: $118.3 billion
Source: “2009 Nonemployer Statistics: Geographical Area Series: Nonemployer Statistics by Legal Form of Organization: 2009,” one of the many offerings on the Census Bureau’s American FactFinder platform, available here.
Original source: U.S. Census Bureau
Posted on September 13, 2011

Size of the Labor Force

Employment by sector

Today—in honor of International Labor Day, celebrated on May 1st around the world—we provide a market size for the U.S. labor force in both 2008 and 2018. The projected size of the labor force is just one of many interesting projections published in a work titled Occupational Outlook Handbook, published periodically by the U.S. Bureau of Labor Statistics.

Areas that are projected to see the greatest number of new jobs are the Healthcare and Social Assistance Sector (slightly more than 4 million jobs), the Professional, Scientific and Technical Services Sector (2.66 million jobs), and the Educational Services Sector (1.69 million jobs). The white segments of the bars on the graph show the number of jobs expected to be added between 2008 and 2018 for each major industry. When it looks as if there is no white segment for a particular industry’s bar, well, that means the number of new jobs projected is tiny, invisible at this range.

Geographic reference: United States
Year: 2008 and 2018
Market size: 136,800,000 and 166,900,000 respectively, an increase of 22%
Source: “Overview of the 2008-18 Projections,” Occupational Outlook Handbook, 2010-2011 Edition, December 3, 2010, available on the BLS website here.
Original source: U.S. Department of Labor, Bureau of Labor Statistics

U.S. Postal Service

The U.S. Postal Service (USPS) employed 656,000 people in 2010 making it one of the largest single employers in the United States. It handles billions of pieces of mail annually and has been in service since before we were even a nation (1775). In fact, the constitution itself calls for the establishment and maintenance of a postal service. While the rise of electronic means of exchanging data has had an impact on the USPS by reducing the number of items it is charged with carrying annually, the USPS continues to provide an important function in our society. Do not be fooled, no for-profit entity would charge the same amount for daily mail pick-up and delivery to those in distant and hard to reach rural areas as it would charge residents of a densely packed city.

It is true that the USPS is operating at a bit of a loss these days but that could be remedied with a few cent increase in the price of a stamp. While the USPS has been downsizing to adjust to the new realities of the Internet age it is also true that from November 1981 to 2010 the price of a standard stamp increased by less than the cost of inflation. The United States has one of the least expensive postal services anywhere. If you’re interested in how the USPS compares with postal rates in other countries, there is a nice chart on that subject available here.

Geographic reference: United States
Year: 1960 and 2010
Market size: Pieces of Mail Handled: 63.7 and 170.6 billion respectively
Market size: Number of Post Offices: 35,238 and 27,077 respectively
Source: Pieces of Mail Handled, Number of Post Offices, Income, and Expenses, 1789 to 2010, available online here.
Original source: United States Postal Service

Coal Mining Industry

The United States has the largest proven coal reserves in the world. The market size presented here is based on employment within the U.S. coal mining industry.

Geographic reference: United States
Year: 2009
Market size: 87,755 people
Source: “Annual Coal Report, 2009,” October 1, 2010.
Original source: Energy Information Administration, U.S. Department of Energy

Are Women Better Able to Weather Economic Storms?

V1Ch2P7B

The chart above shows the percentage of job losses and gains by gender and by periods of employment decline and recovery from 1970 to 1993.  The data used to create the chart include only non-farm employment. They do not include self-employment.

In every economic recovery since September 1971, women have gained a larger percentage of the newly created jobs than men have, even though men have consistently lost most of the jobs during times of economic downturn.

Most of the jobs lost during the economic downturns have been in industries that are easily affected by the ups and downs of the economy, such as construction and manufacturing.  Men, traditionally, have held most of these jobs.  On the other hand, many of the jobs that are traditionally held by women continued to grow during the last economic downturn and gained even more during the economic recovery. These jobs include health care occupations, social services, and public school occupations.  The following table shows the percentage of men and women in the various industries.

 Approximate Percentage of Employment by Gender, 1993

Industry

Men (%)

Women (%)

Construction

90

10

Manufacturing

67

33

Health care

18

82

Social services

22

78

Local public schools

30

70

 In an economic downturn, the goods-producing sector and those industries that deal with that sector, such as retail trade, are the ones that lose the most jobs.  Even when there was a recovery, the manufacturing industry still continued to lose jobs.  This was due to automation, foreign competition, and cutbacks in government and commercial contracts. 

While people are less likely to buy goods during an economic slowdown, there is always a need for health care, social services, and schools. The aging of the population, the increased priority people put on health care, and the added jobs when new treatments are developed all contribute to the increase in health care and social service jobs. During the last recovery, the number of jobs in state and local government also expanded, with much of that growth in the school system.

In conclusion, overall, women are more likely to keep and gain jobs during economic cycles than men due to the types of industries that employ the majority of women.  More men are employed in goods-producing industries, which are affected more by economic slowdowns, automation, and foreign competition. More women are employed in service industries and state and local government. These industries do not lose as many jobs during economic downturns and, in recent years, tend to expand the number of jobs both in downturns and recoveries. 


SOURCE NOTE–This essay is one from the first volume of a four volume reference work titled Social Trends & Indicators USA, written by the staff of Editorial Code and Data, Inc. and published, in 2003, by Thomson Gale. It is being used here, by Editorial Code and Data, Inc., to do some testing of electronic data presentation.