Staff Training

staff training

According to the Bureau of Labor Statistics, in November 2018, more than 6.0 million people were unemployed in the United States. That same month, nearly 6.9 million job openings were reported. Forty-five percent of employers have jobs open, they say, because they cannot find qualified applicants to fill those positions. In a CareerBuilder survey, 66% of employers reported that they planned to hire and train workers who may not have the skills needed but who showed potential.

In 2018 companies spent an average of $986 per employee on training. The highest percentage of training dollars budgeted, 39%, went to training hourly workers, followed by non-managerial salaried workers (27%) and salaried managers (24%). Only 10% of the average training budget went to train executives. Training can take many forms, from instructor-led classroom learning to webcasts to self-directed online courses. In practice, most companies use a variety of methods to train their workers. Of those that use only one method, most prefer instructor-led classroom learning, followed by online or computer-based courses and virtual classrooms or webcasts.

More companies expect to purchase online learning tools and systems next year than any other type of training product. At least some mandatory or compliance training is done online at 82% of companies, with 28% of companies providing this training completely online. A vast majority of companies also use online training for sales training, IT systems training, and desktop application training. Online training is least likely to be used for onboarding and executive development.

Today’s market size shows the total amount companies in the United States spent on training in 2018. This figure includes payroll for staff assigned to do the training and spending on external products and services, travel, facilities, and equipment. Overall spending in 2018 declined from $93.6 billion in 2017 due to a 33.5% decrease in expenditures for travel, facilities, and equipment. However, spending on outside products and services increased during this time period, from $7.5 billion to $11.0 billion. Payroll for training staff also increased, from $41.6 billion to $47.0 billion.

Geographic reference: United States
Year: 2018
Market size: $87.6 billion
Sources: “2018 Training Industry Report,” Training, November/December 2018, pages 18-31 available online here; “Job Openings and Labor Turnover – November 2018,” News Release, Bureau of Labor Statistics, U.S. Department of Labor, January 8, 2019 available online here; “Labor Force Statistics From the Current Population Survey: (Seas) Unemployment Level,” Series ID: LNS13000000, Bureau of Labor Statistics, U.S. Department of Labor, Data extracted on February 6, 2019 available online here; “44 Percent of Employers Plan to Hire in the New Year, According to CareerBuilder’s Annual Forecast,” CareerBuilder Press Room, January 8, 2018 available online here.
Image source: claude_star, “convention-conference-meeting-1410870,” Pixabay, May 24, 2016 available online here.

Summer Enrichment Programs

summer enrichment programs, summer campWhat did you do on your summer vacation? The ubiquitous question that’s asked of children and young adults as they return to classes in the fall. The responses may differ greatly depending upon what country the student lives in or how wealthy their parents are. Many students may say they attended summer camp. When parents and grandparents in the United States think of their experiences at summer camp they may remember rustic cabins, swimming, canoeing, arts and crafts, and sitting around a campfire in the evenings. However, increasingly in the U.S. and around the world summer camps, or summer enrichment programs as they are sometimes called, cater to niche interests or focus on in-demand workforce skills. According to the American Camp Association, the percentage of camps offering science, technology, engineering, and math programs grew from less than 25% in 2014 to more than 33% in 2017. Demand for such camps is increasing as more affluent parents want to give their children not only an enjoyable experience but also a competitive advantage in school and in the workforce, even if many of these students are still in elementary school. As summer enrichment programs become more specialized, exclusive, and expensive, fewer students from lower- and middle-income families will be able to take advantage of these opportunities.

In China, many wealthy parents send their children abroad in the summer to take advantage of study tours in the hopes of broadening their children’s view of the world and preparing them to attend college in other countries. Today’s market size shows the estimated amount Chinese parents will spend on study tours abroad in 2018. An estimated 1 million Chinese students will take these tours this year. According to Chu Zhaohui, a researcher at the National Institute of Education Sciences,1 the United States, the United Kingdom, and Australia are the top three destinations for study abroad tours.

1 The National Institute of Education Sciences is a research division of the Ministry of Education in the People’s Republic of China.

Geographic reference: China
Year: 2018
Market size: $4.5 billion
Sources: “Mutually Assured Distraction,” The Economist, August 11, 2018, page 47; Ma Xuejing, “Study Tours Abroad More Hype Than Substance,” China Daily, June 22, 2018 available online here.
Original source: Ctrip, a Chinese travel agency
Image source: davidraynisley, “paddle-summer-camp-camp-summer-3414020,” Pixabay, May 2018 available online here.

Bookmobiles

Bookmobiles GraphBookmobiles, mobile libraries in vans, trucks or other large vehicles, reach underserved populations in the community. In many parts of the country, especially in rural, remote areas, people live too far from a library branch to take advantage of its services. In poor neighborhoods, children may not have access to the public library. Their parents may not have time to take them to the library after a long day’s work or may not make reading at home a priority. Seniors in assisted living facilities and nursing homes are two other groups served by bookmobiles. Besides providing books and movies, bookmobiles also provide high-speed internet access to people who may not have access otherwise.

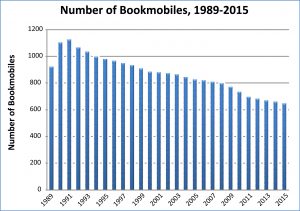
Today’s market size shows the number of bookmobiles in the United States in 1990 and 2015. As the graph above shows (click the graph to see more detail), the number of bookmobiles across the country has been on a steady decline since 1991. When library funding is cut or does not keep up with increasing expenses, many times bookmobiles are one of the first services to go. But some libraries see the advantages in having bookmobiles when budgets are tight. Bookmobiles provide outreach to the community, a “way to reach more patrons and prove their worth … as people become more accustomed to having goods and services delivered to their doors.”1 Some counties in Washington, Oklahoma, New York, Lousiana, and Virginia have added more than one bookmobile in the past decade.

1 Jen Fifield, “Yes, Bookmobiles Are Still a Thing,” The Pew Charitable Trusts, March 28, 2018

Geographic reference: United States
Year: 1990 and 2015
Market size: 1,102 and 647
Sources: “Bookmobiles in the U.S.,” American Library Association available online here; “Table 3. Number of Public Libraries with Branches and Bookmobiles, and Number of Service Outlets, by Type of Outlet and State: Fiscal Year 2015,” Supplementary Tables: Public Libraries Survey Fiscal Year 2015, Insititute of Museum and Library Services, September 2017 available online here; and Jen Fifield, “Yes, Bookmobiles Are Still a Thing. (We Checked),” Stateline, The Pew Charitable Trusts, March 28, 2018 available online here.
Image source: Created in-house using data from the American Library Association and the Institute of Museum and Library Services. Click on the image to see more detail.

Student Loan Debt

Today’s market size is the amount owed in the United States for loans taken to finance higher education. The figures, which come from reports produced by the Federal Reserve Banking system, appear in an interesting article about the opportunity costs of having a large part of the younger generation beginning its productive life carrying a significant debt load. This fact may begin to explain the decline in first-time home purchases as well as declining numbers of new business start-up, two activities that require a population with more debt capacity than young people in the United Sates have these days.

Geographic reference: United States
Year: 2003 and 2013
Market size: $300 billion and $1.1 trillion respectively
Source: Phyllis Korkki, “Ripple Effects From Rising Student Debt,” The New York Times, May 25, 2014, pages B6.
Original source: Professor Brent W. Ambrose of Pennsylvania State University and Larry Cordell and Shuwei Ma of the Federal Reserve Bank of Philadelphia.
Posted on May 30, 2014

Exam Preparation Firms

ExamPrep

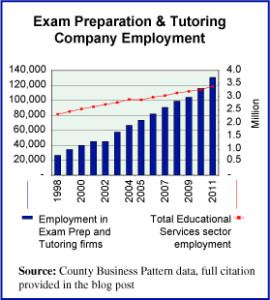
Business is booming for those involved in the business of helping to prepare students to take examinations, primarily standardized tests ranging from college entrance exams to the tests given children to select for admittance to private kindergarten. The graph provides employment figures nationally from 1998 through 2011 for all firms involved with exam preparation and tutoring. The rate of employment growth in this area has been very strong. From 1998 to 2011 it nearly quadrupled, growing 391%. This was the standout industry within the overall educational service sector, which as a whole saw employment grow 46% over the period. The red line in the graph shows overall sector employment.

The reason we have used employment data to show the growth of this industry is because data on revenues is not plentiful. Growth in revenue for the industry between 1997 and 2007, two Economic Census years, was 331%. Over that same period, employment grew 241%. It is reasonable to assume that between 2007 and 2011, revenue in the industry also kept pace with employment growth, suggesting that this is an industry that was not strongly impacted by the recession of 2007–2009.

Today’s market size is the total value of revenues earned by Exam Preparation and Tutoring businesses in the United States in 1997 and 2007. For those familiar with the NAICS coding system, this industry is NAICS 611691.

Geographic reference: United States
Year: 1997 and 2007
Market size: $815 million and $3.5 billion respectively
Sources: (1) “Educational Services: Geographical Area Series: Comparative Statistics for the United States (2002 NAICS basis): 2007 and 2002,” 2007 Economic Census, U.S. Census Bureau, available online here. (2) Arsen J. Darnay, editor, Information, Finance, & Services USA, 2001, page 549, Gale Group. (3) “2010 County Business Patterns (NAICS),” U.S. Census Bureau, available online here.
Original source: U.S. Department of Commerce, Bureau of the Census
Posted on March 19, 2014

Training Doctors

The education and training of a doctor is a long and costly endeavor. First comes the classroom education, the cost of which is picked up, for the most part for those not fortunate enough to get a scholarship, by the future doctor him or herself. Then comes a final on-the-job training period in which doctors with new diplomas spend four or more years working in a residency program.

During this residency, doctors in training see and treat patients under the supervision of more seasoned physicians. Most of these residency programs are carried out in teaching hospitals, which account for approximately 20% of the nation’s hospitals. Residency programs are arduous. Residents are expected to routinely work 80 hours a week and they are paid half or far less of what they will receive for much the same work after the residency. This training is expensive for the system as a whole and has been, for all practical purposes, nationalized.

The U.S. federal government pays for most of this training with money from the Medicare and Medicaid systems. Our market size today is the money spent by the federal government annually to support this graduate medical education.

Geographic reference: United States
Year: 2012
Market size: $11.5 billion of U.S. government funds are used to support residency slots in training hospitals, approximately 115,000 in 2012
Source: Catherine Dower, “Graduate Medical Education,” a health policy brief published in Health Affairs, on August 31, 2012 and available online here.
Original source: U.S. Department of Health and Human Services, Center for Medicare and Medicaid Services
Posted on January 22, 2014

Charter Schools

The National Education Association defines charter schools as follows: “Charter schools are publicly funded elementary or secondary schools that have been freed from some of the rules, regulations, and statutes that apply to other public schools, in exchange for some type of accountability for producing certain results, which are set forth in each charter school’s charter.” The first charter school was established in Minnesota in 1991 as a part of ongoing educational reform efforts and more specifically, an expansion of market-based school reform. Proponents of charter schools claim that they bring much needed entrepreneurial spirit and a competitive ethos to public education. Opponents claim that to outsource the running of public schools to private entities is to redirect already scarce resources to service fees and profits while creating new layers of administration.

Since the first charter school was established in Minnesota, 40 additional states have passed legislation permitting the formation of charter schools and the number of such schools has grown with each passing year. The formation of Education Management Organizations (EMOs), both nonprofit and for-profit, has been one result of the legislation enabling charter schools. Some EMOs are now quite large, managing dozens of schools while others manage a single school. The diversity of this category of management companies is quite extreme. While not all charter schools are operated by EMOs, in the academic year 2011-12 such EMOs accounted for approximately 39% of all charter schools and 50% of all students enrolled in charter schools. And of the nearly one million students enrolled in EMO-run schools that year, 51% were enrolled in for-profit EMOs.

Today’s market size is the total number of charter schools operating in the United States in the academic years beginning in 2000 and 2010. While charter schools still make up a very small percentage of all public schools in the country (5.3%), it is an area that some people feel holds great promise for further privatization of government services.

Geographic reference: United States
Year: School year starting in the fall of 2000 and 2010
Market size: 1,993 and 5,274 respectively
Sources: (1) “Charter Schools,” a fact sheet on the National Education Association web site from which we quote the definition of these schools, available online here. (2) Gary Miron and Charisse Gulosino, Profiles of For-Profit and Nonprofit Education Management Organizations, November 2013, National Education Policy Center, available online here. (3) Tables 71, 98, and 161 from chapter two of the Digest of Education Statistics: 2012, published by the NCES in 2013 and available online here.
Original source: U.S. Department of Education, National Center for Education Statistics (NCES); National Education Policy Center, Commercialism in Education Research Unit (CERU)
Posted on January 8, 2014

Apprenticeships

YouthUnEm

Apprenticeship programs have been around for centuries. In the most basic sense, an apprentice is somebody learning the skills of a particular trade by working with a skilled worker. In industrialized countries, apprenticeship programs vary greatly from a regulated arrangement between private companies and schools and/or trade unions to less formal arrangements in which a person new to a field of endeavor works alongside somebody already skilled in that field. Most apprenticeship programs include classroom work as well as on-the-job training.

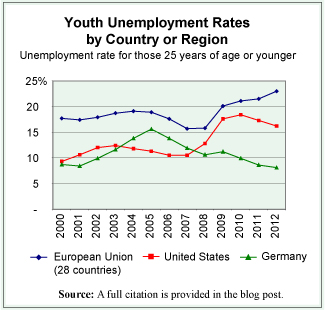
There are many things that play a role in the fluctuations of unemployment rates and these rates tend to be higher for younger people than for those more established in their work lives. Thus, having a youth population that is well trained for the jobs that are available seems a natural aid to keeping the youth unemployment rate down. From the data available on countries of the European Union—where the prevalence of apprenticeship programs is greater than in the United States, although it does vary from country to country—there seems to be a discernible connection between lower youth unemployment rates and the prevalence of robust apprenticeship programs. By way of comparison, we offer the graph that shows the youth unemployment rate for the first decade of the current century for the European Union, for Germany, and for the United States.

While the youth unemployment rate in the European Union as a whole, in 2012, was 23% it ranged widely from a low of 8.1% in Germany to a high of 55.3% in Greece. Interestingly, the two European countries with the lowest youth unemployment rate are also two of the countries in the Union with the most robust apprenticeship programs, Germany and Austria.

In the United States, apprenticeship programs are not as heavily used as they are in Europe. Trade unions used to be primarily a source of such programs in the United States but with the decline in union membership over the last decades these programs have also been in decline. That is until recently. European companies are starting to establish apprenticeship programs in the United States to train the workforce they need for their U.S. facilities.

Today’s market size is the number of people in the United States participating in apprenticeship programs that are registered with the U.S. Department of Labor. The approximate number participating in such programs in Germany is also provided.

Geographic reference: United States and Germany
Year: 2012
Market size: United States: 358,000 (with an additional, approximately 450,000 involved in programs not registered with the Department of Labor)
Market size: Germany: 1.6 million
Sources: (1) “Registered Apprenticeship National Results,” U.S. Department of Labor, Employment and Training Administration, June 7, 2013, available online here. (2) Unemployment Rate by Age Group,” Eurostat, October 31, 2013, available online here. (3) “Apprenticeships: Earn while you learn,” Bureau of Labor Statistics, Summer 2013, available online here.
Original source: U.S. Department of Labor and Eurostat
Posted on December 2, 2013

Libraries

Anyone who is truly interested in knowledge will be a friend of the library. Even in an age which defines itself as the “information age,” libraries play an essential role in society. In fact, based on U.S. library usage data from this century, that role is growing.

Today’s market size is the estimated total number of libraries in the United States. The largest category of library is the school library, which accounts for slightly over 80% of all libraries and does not include the academic library which is associated with higher education. The second largest category of library is the public library with a 7.5% share of the total.

Geographic reference: United States
Year: 2010
Market size: 119,987
Source: “Number of Libraries in the United States — ALA Library Fact Sheet 1,” American Library Association, August 2013, available online here.
Original source: The ALA web site provides a long list of sources upon which the organization drew in order to reach the total count.
Posted on September 23, 2013

“Big Ten” Conference TV Revenues

The “Big Ten Conference” is the oldest Division I college athletic conference in the United States. It has twelve member institutions, despite its name, and is slated to add two more in 2014. These are flagship research universities in their respective states, well-regarded academically and with relatively large student enrollment. They are located primarily in the Midwest.

In the Big Ten conference, revenue from television contracts helps to cover the cost of coaches salaries, scholarships, travel and game-day expenses. TV revenue also helps to cover the cost of athletic programs that do not bring in sufficient revenues to sustain themselves, such as tennis, gymnastics and rowing.

The National Collegiate Athletic Association requires athletic programs to maintain at least 16 varsity sports. The Big Ten conference requires 20. According to Sports Illustrated, the expansion of the Big Ten conference to 14 schools in the 2014-2015 school year will help to nearly double the per-school television contract revenue by 2017-2018. The data shown are on a per-school basis.

Geographic reference: United States
Year: 2012-2013 and 2017-2018
Market size: $25 million and $40 million, respectively, per school
Source: Editorial Staff, “MSU Athletics Win Off The Field, Too,” Lansing State Journal, July 14, 2013, page 7F and Chris Solari, “Power Play,” Lansing State Journal, July 14, 2013, pages 1D, 5D.
Original source: Sports Illustrated
Posted on July 16, 2013

Instructional Technology

There is a lot of churn going on in the publishing world and the textbook segment of that industry is no different. In fact, it may be experiencing more upheaval and change than is the industry as a whole, though that would be very hard to quantify. Everyone in the publishing trade is adapting to the digital world in one way or another.

Today’s market size focuses on an industry in which eTextbooks are but a small part. The market size comes from a press release about a new market study. The elaborate title of that study is “Global Smart Education & Learning Market Advanced Technologies, Digital Models, Adoption Trends & Worldwide Market Forecast (2012—2017),” a title whose very complexity says a lot about the market being studied. That market, as defined by the study authors, includes far more than eTextbooks. It includes software applications, electronic libraries, curriculum systems, and much more. This market “caters to the needs of national governments and international standard bodies, educators from all streams and from different levels, stakeholders for training and workforce skills.”

Geographic reference: World
Year: 2011
Market size: $73.8 billion, of which, the North American market accounted for approximately 60% of this total revenue.
Source: “Global Smart Education and Learning Market Is Expected to Reach a Value of $220 Billion by 2017, New Report Says,” San Francisco Chronicle, February 13, 2013, available online here.
Original source: Research And Markets
Posted on March 7, 2013

College Enrollment

While we at ECDI don’t really see education as a market-driven endeavor, there is no question that educational services are an important part of the U.S. economy. Public expenditures on education account for between 5% and 6% of Gross Domestic Product (GDP) annually, as measured in value added. Educational services in the private sector account for another 1% to 1.5% of GDP. Today we look at enrollment in post-secondary educational institutions of all sorts in the United States as our market.

Several interesting details about 2011 college enrollment in the United States are these: of the total enrolled, more than half were females (55.2% versus 44.8%); most were full-time (73%); most were enrolled in public institutions (79%), and slightly more than half of the students were employed, either part-time (27.5%) or full-time (25.7%). For anyone interested in more details about this “market,” the source from which we obtained today’s market size—link provided below—offers a very detailed breakdown of college enrollment in the United States, by demographic characteristics as well as by type of institution and by years in school.

Geographic reference: United States
Year: 2011
Market size: 20.4 million
Source: “Table 5. Type of College and Year Enrolled for College Students 15 Years Old and Over, by Age, Sex, Race, Attendance Status, Control of School, Disability Status, and Enrollment Status: October 2011,” part of the Current Population Survey series produced and made available to us all by the U.S. Census Bureau on their website here.
Original source: U.S. Department of Commerce, Census Bureau.
Posted on November 30, 2012

Public School Students

School bus arrives on day 1

As the summer comes to a close and school-aged children head back to school we present the estimated number of children in the United States attending public elementary or secondary schools during the 2011-2012 academic year. Worth noting is the fact that, based on 2010 U.S. Census data, there were 53,980,105 people in the United States between 5 and 17 years of age, the age range of the majority of those in the elementary and secondary school system at the beginning of an academic year.

Geographic reference: United States
Year: 2011-2012
Market size: 49,255,742 students, 61.4% of whom were elementary level students and 38.6% secondary school level students.
Source: “Highlights Table 1. 2011–12 versus 2010–11: Estimates for 50 States and D.C. Statistics of Public Elementary and Secondary School Districts,” page 66. Rankings & Estimates, a report by the National Education Association (NEA) dated December 2011, available online here. The population figure mentioned above is from a U.S. Census Bureau report, available here.
Original source: NEA
Posted on September 4, 2012

Waldkindergartens

Waldkindergartens, or forest kindergartens, are outdoor schools for three to five year olds. As the name implies, the classes are held in forests. Although these types of schools became popular in Europe in the 1950s and 1960s, the idea of outdoor classrooms began in the 1800s when Friedrich Froebel, a German educator and former forest intern, introduced the concept of kindergartens, or children’s gardens. When working with young children, he would teach them in garden settings or in the countryside. Later other educators expanded on his idea with a play-based curriculum.

In the United States, kindergartens are teacher-directed indoor classrooms; however, in the mid-2000s after the book Last Child in the Woods, by Richard Louv, was published there was a renewed interest in getting children outdoors for play and for education. While waldkindergartens are rare in the United States currently, the few programs that are in existence have waiting lists of students wanting to be part of the program. Are these programs beneficial? A study in Europe found that children who went through the waldkindergarten program had more self-confidence, a greater sense of independence, stamina, coordination, motivation and concentration. Some parents in the United States report that their children have better problem-solving and critical-thinking skills. Data show the approximate number of waldkindergartens in Germany.

Geographic reference: Germany
Year: 2012
Market Size: 450 schools
Source: Ruth A. Wilson, “Teaching Among the Trees,” American Forests, Winter 2012, pages 42-43
Posted on March 6, 2012

Textbooks

An announcement is expected on Thursday, January 19th, from Apple Corporation having to do with their plans in the area of electronic textbooks. As one might imagine, much attention is being paid to this news by the academic world and the publishing world alike.

Today’s market size is an estimated total value of textbook sales in the United States based on a quote from Steve Jobs in the recently published biography about him by Walter Issacson. A brief look at the Census Bureau’s data on the topic suggests that the estimate is reasonable. The Census Bureau figure is provided here as well.

Geographic reference: United States
Year: 2007 and 2010
Market size: $7.06 billion in 2007 (Census data) and $8 billion (Jobs quote from 2010 which appears in the biography Steve Jobs
Source: “Sector 51: Information: Industry Series: Preliminary Product Lines by Kind of Business for the United States: 2007,” 2007 Economic Census, available here. The Jobs quote is from an article by Roger Yu in USA Today, titled “Technology, Costs, Lack of Appeal Slow E-textbook Adoption,” published on January 16, 2012 and available here.
Original source: U.S. Census Bureau
Posted on January 18, 2012

Foreign Students in the United States

While within the United States there is a great deal of debate about how the higher education system as a whole is functioning, its appeal to those from outside the country is as strong as ever. The number of students traveling from outside the United States to attend a U.S. institute of higher learning has been increasing steadily during the first decade of the 21st century. This is both a challenge and a benefit for U.S. colleges and universities as these students often need intensive language assistance but also pay full tuition. According to the U.S. Department of Commerce, foreign students in the United States contribute approximately $20 billion to the economy annually.

Today’s market size is the size of the population of foreign students at U.S. institutions of higher learning in 2009.

Geographic reference: United States
Year: 2009/2010 School Year
Market size: 690,923 students — in terms of country of origin, the three leading countries are China which sent 18.5% of the students in 2009/2010, India which sent 15.2% and South Korea which sent 10.4%
Source: A press release for the report titled Open Doors 2010 which is put out annually by the Institute of International Education. The report is issued annually and the press release announcing the 2010 edition is available online here.
Original source: Institute for International Education and the U.S. Department of State’s Bureau of Educational and Cultural Affairs
Posted on November 7, 2011

“e-Learning” Hardware and Software

The use of computers and other technological devices in the classroom has long been a source of debate among educators. Equipping schools with the most cutting edge technology is costly and the benefits of these expenditures in actually teaching students is not always evident. Nonetheless, in a world in which computers are ubiquitous the desire to have our children use modern technology with confidence helps to drive growth in the market for “e-learning” devices and software.

Today’s market size is a forecast of the value of the e-learning sub-sector of “the global education market” in the year 2015.

Geographic reference: World
Year: Forecast for 2015
Market size: $69 Billion
Source: “Brave New World: The Changing Landscape of Education and Technology,” April 2010, a report posted online by the firm Spire Research & Consulting and available here.
Original source: Marijk van der Wende, “The Role of US Higher Education in the Global E-Learning Market,” Center for Higher Education Policy Studies (CHEPS), Research & Occasional Paper Series, University of California, Berkeley, 2002
Posted on September 14, 2011

Higher Education Publishing

Higher education publishing includes “multiplatform course learning systems and materials for college and university students and faculty.” From 2008 to 2010, net revenue in this area of publishing saw annual growth of 15.5% and 6.6%, respectively. This segment of the publishing world has long known that during times of economic slowdown many people try and make the best of a bad situation and go back to school. Data show the net revenue for 2010.

Geographic reference United States
Year: 2010
Market Size: $4.55 billion
Source: Association of American Publishers, “BookStats Publishing Categories Highlights,” 2011, available online here and Association of American Publishers, “BookStats and Publishing Industry Glossary,” 2011, available online here.
Original source: BookStats
Posted on September 1, 2011

K-12 School Publishing

K-12 school publishing includes a wide range of learning tools for students and teaching aids for teachers in both public and private schools. Unlike other publishing, revenue in this category is affected by federal and state government funding. After dropping 12.4% from 2008 to 2009, net revenue increased 7.1% from 2009 to 2010. Data show the net revenue in 2010.

Geographic reference: United States
Year: 2010
Market size: $5.51 billion
Source: The Association of American Publishers, “BookStats Publishing Categories Highlights,” 2011, available online here.
Original source: BookStats
Posted on August 31, 2011

Golfing

Today we look at the size of the market for golfing related expenditures in Michigan, generated by the organization Executive Women’s Golf Association (EWGA). This nonprofit organization, founded in 1991, has the mission of connecting women with golf for both business advantage and fun.

Geographic reference: State of Michigan
Year: 2010
Market size: $1.1 million
Source: “Seeing Green, Golf Courses Increasingly Catering to Women and Families,” Corp!, July/August 2011, page 20
Original source: EWGA estimates