Craft Rum

craft rum
Geographic reference: World
Year: 2019 and 2027
Market size: $1.06 billion and $1.60 billion

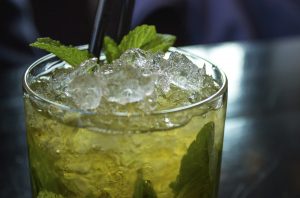
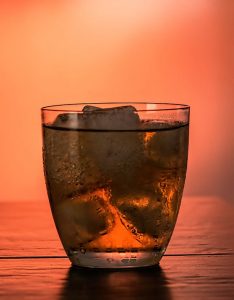
July 19th is National Daiquiri Day in the United States. A daiquiri is a cocktail made with rum, sugar, and lime although other ingredients can be added for a more fanciful drink. Strawberries can be added, for example, to make a strawberry daiquiri. The daiquiri was invented by Jennings Cox, an engineer who supervised a mine in the village of Daiquiri, Cuba in 1898. After work, Cox and his colleagues would go out to the local bar to socialize. One day he mixed Bacardi rum, sugar, and lime into a glass filled with ice. The drink was named after the Daiquiri mines and eventually became a popular drink in Havana.

This post focuses on one of the ingredients in this cocktail: rum. Craft rum to be more specific. Today’s market size shows total global revenues for craft rum in 2019 and projected for 2027. Revenues for craft rum accounted for 6.93% of the $15.3 billion craft spirits market in 2019. Many craft rum producers manufacture their product on a small scale using a hands-on process to distill their product in such a way as to control for taste and quality. By managing the fermentation process and distillation speed, the distiller can control the product’s flavor. A rising interest in craft rum and craft spirits in general, especially among millennials; an increasing number of product launches; and product promotions on social media and in magazines are all expected to contribute to growth over this time period.

Bars, pubs, and restaurants are the major distribution channels for craft rum, representing more than 60% of the market in 2019.1 Craft spirit producers tend to sell to high-end bars and restaurants before selling their products in supermarkets and other retail establishments. Having a wide variety of rum and other spirits boosts the appeal of some bars, pubs, and restaurants and in turn, boosts demand for craft rum and other spirits. The popularity of cocktails, especially high-end cocktails, has also boosted sales. According to the CGA Mixed Drinks Report 2019, cocktail drinkers frequent bars, pubs, and restaurants 25% more than non-cocktail drinkers. The growing availability of craft rum at supermarkets, liquor stores, and other retail venues, including online, is expected to lead to the fastest revenue growth in this segment through 2027.

Europe held the highest share of the market in 2019, with the United Kingdom, Germany, and France being the largest consumers. The Asia-Pacific region, currently the second-largest market in the world, is expected to see the highest compound annual growth rate through 2027 due to rapid urbanization, increasing disposable income, and a growing bar, pub, and cocktail culture. 

Because of the presence of many local and regional distillers, and few international ones, the craft rum industry is fragmented. In Europe, popular brands include Merser & Co., Drum & Black, Copalli, Burning Barn, Equiano, and Dark Matter. In North America, the third-largest market worldwide, Wicked Dolphin Rum, Drum Circle Distilling, Arizona Craft Beverage, Cannon Beach Distillery, Lost Spirits Distillery, and Lyon Distilling Co. are popular distillers. Worldwide, leading distillers include Bacardi Ltd., Suntory Holdings Ltd., Diageo, Maine Craft Distilling LLC, Charles Merser & Co., Drum & Black Rum Co., Wicked Dolphin Rum, Domaines Ellam, Arizona Craft Beverage, Belize Spirits Marketing Inc., and Rockstar Spirits Ltd.

1 In 2020, many restaurants, bars, and pubs were shut down to control the spread of COVID-19. As a result, the share of the craft rum market at these establishments dropped significantly. As establishments begin opening up and capacity restrictions ease, market share is expected to rebound.

Sources: “Craft Rum Market Size, Share & Trends Analysis Report by Distribution Channel (On-trade, Off-trade), by Region (North America, Europe, APAC, Central & South America, MEA), and Segment Forecasts, 2020 – 2027,” Grand View Research Report Summary, October 2020 available online here; “Global Craft Spirits Market – Forecasts from 2020 to 2025,” Research and Markets, May 2020 available online here; “National Daiquiri Day – July 19, 2021,” National Today, July 19, 2020 available online here.
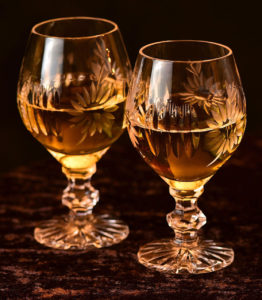
Image source: Adapted from Alexas_Fotos, “rum-alcohol-after-work-cozy-mood-3898745,” Pixabay, December 30, 2018 available online here.

Champagne

champagne
May 16th is National Mimosa Day in the United States. Mimosas have just 2 ingredients: fruit juice and champagne.
Geographic reference: France
Year: 2010 and 2019
Market size: 319.5 million 750 ml bottles and 297.6 million 750 ml bottles, respectively

Today’s market size shows the number of bottles of champagne shipped in 2010 and 2019. Champagne is a sparkling wine from the Champagne region of northern France. In much of the world (although not in the United States), it’s illegal to label a product “champagne” unless the grapes and the wine that’s produced come from that region. It must also be produced under the regulations of the Champagne appellation. This drink is primarily made with pinot noir, Meunier, and chardonnay grapes. It comes in 7 levels of sweetness, from Brut Zero (0-3 grams of sugar per liter) to Doux (50 or more grams of sugar per liter). 

Champagne shipments fluctuated between 2010 and 2019, however, since 2017 shipments have trended downward, from 307.4 million bottles in 2017 to 297.6 million bottles in 2019. In 2019, 72.2% of champagne came from Champagne houses, up from 68.6% in 2010. A larger share of bottles came from cooperatives also, 9.2% in 2019 vs. 8.7% in 2010. A lower percentage of bottles shipped from wineries, however, 18.6% vs. 22.7%. Champagne houses are establishments whose main activity is the making of Grande Marque champagnes. They source most of their grapes from a variety of vineyards in the Champagne appellation. The grapes are vinified separately, then blended to replicate the specific taste a particular house is known for. The oldest Champagne house is Gosset located in Épernay. It was founded in 1584. As of 2019, there were 360 Champagne houses, 140 cooperatives, and 16,100 vineyards in the Champagne region of France.

From 1844 to 1917, France exported most of the champagne produced, in some cases exporting nearly eight times as much as shipped domestically. Between 1918 and 1930, some years saw more exports; others saw more domestic shipments. Since then, domestic shipments have been outpacing exports, however, starting in 2018, exports again took the lead.1 In 2019, exports represented 52% of total shipments. Most exports went to the United Kingdom, followed by the United States, Japan, Germany, Belgium, Italy, Australia, Switzerland, Spain, and Sweden. Nearly 75% of exports went to these 10 countries. Eighty-seven percent of total exports came from Champagne houses. Worldwide, leading brands include Veuve Clicquot, Möet & Chandon, Billecart-Salmon, Perrier-Joüet, Ruinart, Dom Perignon, GH Mumm, Krug, Bollinger, and Taittinger.

1 There were no shipments from 1940 to 1946 due to World War II.

Sources: Les Expéditions de Vins de Champagne en 2019, Comité Interprofessionnel du Vin de Champagne, April 2020 available online here; “Protection of the Champagne Name,” Champagne Bureau, USA, Comité Champagne available online here; Hamish Smith, “Brands Report 2021: Champagne,” Drinks International, January 6, 2021 available online here; “List of Champagne Houses,” Wikipedia, February 25, 2021 available online here; “Ranking by Turnover,” Grandes Marques & Maisons de Champagne available online here; “Shipments Since 1844,” Grandes Marques & Maisons de Champagne available online here; Hunter Robillard, “Champagne (Taste, Best Bottles, Prices 2021)”, Vinovest, January 22, 2021 available online here; “The Economy of Champagne: Key Market Statistics,” Comité Champagne available online here; “May Holidays,” National Today available online here.
Image source: Claudia Peters, “glasses-champagne-drink-prost-449011,” Pixabay, September 17, 2014 available online here.

Bubble Tea

bubble tea
Geographic reference: World
Year: 2019 and 2027
Market size: $2.1 billion and $4.2 billion, respectively

April 21st is National Tea Day in the United Kingdom. Founded in 2016 to inspire the world to drink more tea, this date was chosen because it is also Queen Elizabeth’s birthday. Worldwide, tea is the second-most consumed nonalcoholic beverage behind packaged water. National Bubble Tea Day was first celebrated on April 30, 2018, as a marketing strategy for Kung Fu Tea in New York. This bubble tea franchise currently has locations throughout most of the United States.

Today’s market size shows global revenues for the tea-based drink called bubble tea (or boba) for 2019 and projected for 2027. Bubble tea was invented in Tiachung, Taiwan in the early 1980s. Traditionally, it contained brewed tea, dairy milk, black tapioca pearls, and a sweetener such as honey or sugar. Newer varieties contain assorted flavorings and can be fresh-fruit-based. Milk-based bubble tea can contain soy milk, almond milk, or other non-dairy milk varieties. The chewy black tapioca pearls, made by boiling and steeping white tapioca pearls in caramelized sugar for hours, are what give bubble tea its name.1 There are currently more than 21,000 boba shops in Taiwan, and thousands more in North America, Europe, and other parts of Asia. Boba’s popularity began in earnest over the last decade as Instagram, the new word-of-mouth advertising, became popular in Taiwan. Since then, the variety of boba offered by shops has expanded greatly as these businesses compete to offer something new to attract customers.

Black tea held the highest market share in 2019 at 45%, perhaps because of it being the traditional tea used in the drink or because of its distinct taste. Green tea is expected to experience the fastest growth through 2027 as more people become aware of green tea’s health benefits, such as lowering blood pressure and cholesterol and decreasing the risk of certain cancers. However, boba may not be the best way to enjoy the health benefits of green tea. While the average 8-ounce boba contains just 120 calories with little to no fat, it also has 28 grams of sugar, and that’s not taking into consideration that some varieties of boba are made with pudding, yogurt, fruit, jellies, and syrups. Consumption of high levels of sugar increases one’s risk for obesity and diabetes.

Fruit-flavored boba held 37% of the market, the highest share in 2019, followed by classic and coffee flavors. Fruit-flavored boba is expected to maintain its lead through 2027 owing to shops offering a wide range of flavors such as strawberry, passionfruit, honeydew, avocado, coconut, and lychee among others to satisfy a wide range of tastes. Coffee is expected to be the fastest-growing flavor over this time period due to coffee’s popularity as a healthy energy drink especially in Europe and Scandanavia. 

Not surprisingly, the Asia Pacific region is the largest market with a more than 35% share, Thailand being one of the major consumers. The average consumption in this country is six cups per person per month. Europe is expected to experience the highest growth through 2027 with the United Kingdom, Germany, and Italy being some of the countries with the highest demand in the region. North America is also expected to experience steady growth during this time period.2 Major companies are focused on expanding their presence globally and to gain market advantage are launching new flavor and tea varieties. Major suppliers in this industry include Bobabox Ltd., Bubble Tea House Co., Bubble Tea Supply Inc., Fokus Inc., Lollicup USA Inc., and Troika JC Inc. Leading bubble tea shop franchises include Gong Cha, ChaTime, T BUN International, and Ten Ren’s Tea Time.

1 According to Leslie Nguyen-Okwu, a journalist based in Taipei, Taiwan, although there are differing accounts as to who exactly invented boba, “[t]he one thing that everybody agrees upon is that the name “boba” is a reference to the 1980s Hong Kong sex symbol Amy Yip, whose nickname, ‘Boba,’ is also a Chinese slang term for her most famous pair of physical assets.”
2 A surge in demand for products assembled abroad and a shortage of workers due to coronavirus cases and public health protocols have created problems in the global supply chain in 2021, leaving dozens of ships delivering goods from Asia waiting out to sea. This created a shortage of boba in the United States and Canada in the first half of the year. Fully formed boba comes from Taiwan and cassava root, which is used to make tapioca, comes from Taiwan and islands in the Pacific Ocean. Low supply has led to supplier rationing and some shops had already run out of boba by April. As Brian Tran, co-owner of Honeybear Boba in San Francisco states: “A boba shop without boba is…like a steakhouse without steak.” While some customers may leave without buying anything, it may be an opportunity for others to try new toppings in their tea. Supplies weren’t expected to return to normal until the summer. Source: Kellen Browning, “Another Unlikely Pandemic Shortage: Boba Tea,” The New York Times, April 16, 2021 available online here.

Sources: “Bubble Tea Market Size, Share & Trends Analysis Report by Product (Black, Green, Oolong), by Flavor (Classic, Coffee, Fruit), by Region (APAC, North America, Europe, MEA), and Segment Forecasts, 2020 – 2027,” Grand View Research Report Summary, June 2020 available online here; “Bubble Tea Market Size Worth $4.2 Billion by 2027 | CAGR 8.9%: Grand View Research, Inc.,” CISION PRNewswire, June 11, 2020 available online here; Leslie Nguyen-Okwu, “Boba Explained: Types of Bubble Tea, and How to Order,” Eater, March 16, 2019 available online here; “National Tea Day — April 21, 2021,” National Today available online here; “Boba Tea: Are There Health Benefits?” WebMD available online here; “Bubble Tea,” Wikipedia, February 26, 2021 available online here; Kellen Browning, “Another Unlikely Pandemic Shortage: Boba Tea,” The New York Times, April 16, 2021 available online here.
Image source: Hiroaki Kaneda, “boba-pearl-milk-tea-boba-milk-tea-4402053,” Pixabay, August 13, 2019 available online here.

Bottled Water

Bottled water
Geographic reference: World
Year: 2020 and 2028
Market size: $217.66 billion and $505.19 billion, respectively

March 22nd is World Water Day. Created by the United Nations, it’s a day dedicated to bringing awareness about the millions of people around the world who don’t have access to clean, safe drinking water. It is also dedicated to bringing awareness about other water-related issues affecting humans from poor sanitation to the effects of prolonged drought. Every living being on this planet needs clean water to live. Unfortunately, 785 million people globally lack access to clean water and 2 billion people, 1 in 3, lack access to adequate sanitation.

The World Water Day theme for 2021 is Valuing Water. “In households, schools, and workplaces, water can mean health, hygiene, dignity, and productivity. In cultural, religious, and spiritual places, water can mean a connection with creation, community, and oneself. In natural spaces, water can mean peace, harmony, and preservation.”1 For some, water is a commodity to be sold for a profit. Today’s market size shows the total global revenues for bottled water in 2020 and projected for 2028. Revenues are expected to increase by 132.1%.

Portability, convenience, and growing health consciousness among consumers are contributing to growth in the market. Younger generations, especially, prefer bottled water over tap water. As a result, more and more restaurants are offering their patrons bottled water with their meals. As government restrictions meant to slow the spread of the COVID-19 virus took hold — stay-at-home orders and the closing of restaurants, especially — demand for bottled water surged among households as many consumers became more aware of health and hygiene practices.

The purified water segment had the highest market share in 2020, 35%. Increasing global population, increasing per capita consumption of water, urbanization, and economic development in addition to decreasing potable water supplies due to a changing climate and contamination will lead to increasing demand for purified water derived from desalination plants. As of 2018, there were nearly 16,000 desalination plants in 177 countries around the world.

Sparkling water, holding the 4th highest market share in 2020, behind spring water and mineral water, is expected to be the fastest-growing segment through 2028. Growth in demand is expected to come mainly from the United States, France, Canada, Germany, and the United Kingdom. 

The Asia-Pacific region held 42% of the global market for bottled water in 2020, the highest revenue share. Through 2028, this region is also expected to be the fastest-growing market driven mainly by a preference for bottled water due to health concerns about consuming contaminated water. Several governments in the region are investigating desalination as a way to produce fresh water. In 2017, India and Israel partnered to promote India’s desalination technology. This government-led initiative is expected to contribute to growth in the industry at least through 2028. A combination of changing consumption habits, a more organized retail sector, and the introduction of new products, especially flavored waters, are also expected to contribute to industry growth in this region over the next decade. 

Most bottled water manufacturers are large corporations, although there are also some smaller and medium-sized businesses in the industry. Some major manufacturers include Nestlé, PepsiCo, The Coca-Cola Company, Danone, Primo Water Corp., FIJI Water Company LLC, Gerolsteiner Brunnen GmbH & Co. KG, Voss Water, Nongfu Spring, and Rhodius Mineralquellen Und Getranke GmbH & Co. KG. Companies such as Nestlé, PepsiCo, The Coca-Cola Company, Danone, and Rhodius Mineralquellen Und Getranke GmbH & Co. KG have diversified product portfolios with bottled water being only one segment of their business. 

In the United States in recent years, bottling companies have faced lawsuits and potential restrictions over the bottling of groundwater as drought becomes more of a problem. A bill introduced in Washington State in 2020 would ban all bottling of groundwater in the state. According to Mary Grant, a water policy specialist with the environmental group Food and Water Watch, “the Washington state bill is groundbreaking. As water scarcity is becoming a deeper crisis, you want to protect your water supply so it goes for local purposes. [Bottled water] is not an industry that needs to exist.”2 However, while most of the bottled water in the United States came from groundwater two decades ago, that is not the case today. In 2000, 67% of bottled water sold was spring water, water that comes from underground aquifers. By 2018, purified water constituted nearly that same percentage sold. Purified water is tap water that has undergone extra filtering. The Washington state bill does not address bottling from this type of water source. Few would argue that in some cases bottled water is necessary when a safe water supply is not available. This could be due to a natural disaster, or when a private well or public water system is deemed unsafe or is unavailable. While environmentalists and municipal and state government leaders debate the issue, consumers are adding their voices to the conversation at the cash register. Bottled water sales have been on the rise since 2010 and in 2016, bottled water became the top packaged beverage sold in the United States.3

1 Source: “Learn: Valuing Water,” UN Water 22 March World Water Day: 2021 Valuing Water available online here.
2 Source: Alex Brown, “Lawmakers Open Groundwater Fight Against Bottled Water Companies,” Pew, February 12, 2020 available online here.
3 Despite no shortage of safe drinking water in most of the United States, and assurances by authorities that the virus was not in drinking water, at the start of the coronavirus pandemic people hoarded bottled water along with toilet paper, hand sanitizer, and cleaning supplies. Bottled water sales soared 57% in March 2020 compared to March 2019.

Sources: “Bottled Water Market Size, Share & Trends Analysis Report by Product (Purified, Mineral, Spring, Sparkling, Distilled), by Region (North America, Asia Pacific, Europe, CSA, MEA), and Segment Forecasts, 2021 – 2028,” Grand View Reserach Report Summary, January 2021 available online here; “Learn: Valuing Water,” UN Water 22 March World Water Day: 2021 Valuing Water available online here; “The Water Crisis,” Water.org available online here; “World Water Day — March 22, 2021 available online here; Alex Brown, “Lawmakers Open Groundwater Fight Against Bottled Water Companies,” Pew, February 12, 2020 available online here; Ryan Felton, “How Coke and Pepsi Make Millions From Bottling Tap Water as Residents Face Shutoffs,” Consumer Reports, July 10, 2020 available online here; “Bottled Water: Questions and Answers,” Minnesota Department of Health available online here; Andrew Ba Tran and Alvin Chang, “Bottled Water: Where It Comes From and What It Means,” Boston Globe available online here; “Press Release: Bottled Water, The Largest Beverage in the U.S., Continues to Grow,” Beverage Marketers Association, May 29, 2019 available online here.
Image source: congerdesign, “bottle-mineral-water-bottle-of-water-2032980,” Pixabay, February 3, 2017 available online here.

Coconut Milk Powder

coconut milk
Geographic reference: World
Year: 2019 and 2027
Market size: $52.5 million and $113.0 million, respectively
Sources: “Coconut Milk Powder Market Size, Share & Trends Analysis Report by Product (Organic, Conventional), by Application (B2B, B2C), by Distribution Channel (Offline, Online), by Region, and Segment Forecasts, 2020 – 2027,” Grand View Research Report Summary, June 2020 available online here; “Coconut Milk Powder Market Size Worth $113.0 Million by 2027 | CAGR 10%: Grand View Research, Inc.,” CISION PR Newswire, June 16, 2020 available online here; Boriana Slabakova, “The Age of Veganism,” Health Careers Blog, January 7, 2020 available online here.
Image source: Adapted from: Tijana Drndarski, “Raw Coconut Products, Coconut Flakes and Coconut Milk,” Pixabay, May 2, 2020 available online here.

Sixty-five percent of the global population is lactose intolerant, including 90% of the people in the Asia-Pacific region. In addition, the rise in health consciousness coupled with the rise in veganism has consumers worldwide seeking dairy alternatives. As of January 2020, the global market for dairy alternatives totaled $18.12 billion, a 144.9% increase from $7.4 billion in 2010. Plant-based milk constitutes 13% of the entire milk market and more than 50% of the vegan food market. Coconut milk powder is one type of dairy alternative that is expected to see significant growth in the near future.

Today’s market size shows coconut milk powder revenues for 2019 and projected for 2027. For consumers who like to buy in bulk and for those that cannot buy liquified coconut milk on a regular basis, coconut milk powder, with its long shelf life, is a convenient alternative. For many cultures such as Brazilian, Burmese, Indian, Thai, Indonesian, Hawaiian, Singaporean, Sri Lankan, and Vietnamese among others, it is considered a staple of their cuisine. Because of this, the Asia-Pacific region held a third of the market in 2019.

Commercially, coconut milk powder is used to prepare smoothies, shakes, ice creams, cakes, donuts, sauces and gravies. The growing demand for vegan ice cream and desserts at dine-in hotels and quick-service restaurants is expected to contribute to growth in the business-to-business (B2B) sector. In 2019, more than 66% of sales were in the B2B segment. The business to consumer segment is expected to have the fastest growth rate, a compound annual growth rate of 10.7% from 2020 to 2027.

Conventional coconut milk powder was the first type to be introduced to the market. In 2019, it claimed more than 70% of revenues. While it is more economical than the organic variety, organic coconut milk powder revenues are expected to grow the fastest through 2027 due to increased demand for organic products in general, products without chemical fungicides, herbicides, or insecticides and grown in an eco-friendly way.

Most manufacturers are small, catering to local markets. Some larger manufacturers include Nestlé Inc., Anthony’s Goods, BareOrganics, Bramble Berry Inc., Dr. Ben Kim Natural Health Solutions, Enerhealth, Grace Foods Canada Inc., Healthworks, King Arthur Flour Company Inc., and KOS.

Kombucha

kombucha
Geographic reference: World
Year: 2019 and 2027
Market size: $1.67 billion and $7.05 billion, respectively
Sources: “Kombucha Market Size, Share & Trends Analysis Report by Flavor (Original, Flavored), by Distribution Channel (Supermarkets, Health Stores, Online Stores), by Region, and Segment Forecasts, 2020 – 2027,” Grand View Research Report Summary, February 2020 available online here; “Kombucha Market Size Worth $7.05 Billion by 2027 | CAGR: 19.7%: Grand View Research, Inc.,” CISION PR Newswire, February 10, 2020 available online here; “Kombucha,” Wikipedia, May 24, 2020 available online here; “Kombucha FAQ,” Kombucha Brewers International available online here; Laura Zhang, “The Cloudy Origins of Kombucha,” Smithsonian Center for Folklife and Cultural Heritage Magazine, April 15, 2019 available online here; “Sugary Drink Tax,” Wikipedia, May 27, 2020 available online here; “Obesity and Overweight: Key Facts,” World Health Organization, April 1, 2020 available online here; “10 Facts on Obesity,” World Health Organization, October 2017 available online here; Christina Troitino, “Kombucha 101: Demystifying The Past, Present And Future Of The Fermented Tea Drink,” Forbes, February 1, 2017 available online here; “#68 Kombucha: Tea of Immortality,” Food Non-Fiction, June 18, 2018 available online here.
Image source: Tim-Oliver Metz, “Close Up Shot of a Kombucha Fermenting,” Unsplash, March 5, 2020 available online here.

Kombucha is a fizzy, sweet-and-sour, fermented beverage made from tea leaves, sugar, Symbiotic Colony of Bacteria and Yeast (SCOBY), and flavorings. Brewing this beverage involves first steeping tea leaves in hot sugar water. Then, once the sweetened tea is cooled, the leaves are removed and the SCOBY is added. The mixture is poured into a sterilized container with previously fermented kombucha. The container is then covered with a breathable fabric and left to ferment for 10 to 14 days at room temperature. After, the new SCOBY that has formed is removed along with some of the newly fermented tea. The remaining kombucha is strained and bottled for a second fermentation then refrigerated to slow the carbonation and fermentation processes.

Kombucha is thought to have originated in Manchuria, possibly as far back as 221 B.C. Ancient East Asian cultures drank kombucha as a health remedy. Practitioners of traditional Chinese medicine called it the “tea of immortality” or the “elixir of life.” The name “kombucha” may have derived from the combination of the name of a Korean doctor who brought the fermented tea to Japan to treat Emperor Inkyo’s digestive ailments, Dr. Kombu, and “cha”, the Japanese word for tea.

By the late 1800s, the drink was reportedly consumed in Russia and Ukraine. Demand increased in Europe in the mid-20th century. In the early 1990s, the beverage was popular with those with HIV and AIDS who believed that it would help their immune systems and increase their T-cells. Some doctors, however, warned that the beverage was dangerous. Homemade brews may contain aspergillus, a toxin-producing fungus. Pregnant women, the elderly, children, and those with compromised immune systems were discouraged from drinking it. In 1995 the U.S. Centers for Disease Control and Prevention issued a report linking the death of one woman and the illness of another from severe metabolic acidosis to their daily consumption of kombucha. Although not cited as a definitive cause, kombucha consumption declined thereafter. 

In the late 1990s, commercially bottled kombucha became available and by the early 2000s, kombucha was back in favor as those following low-carbohydrate diets searched for a healthy drink to replace sugary soda and juices. Kombucha’s popularity also rose as part of the larger probiotic food consumption trend. Probiotic foods contain bacteria which some studies show benefit digestion and improve the immune system. As consumers look for ways to eat healthier and boost their immune system during the COVID-19 pandemic, kombucha consumption is expected to increase even more.

Today’s market size shows global revenues for kombucha in 2019 and projected for 2027. To increase sales companies are investing in new product development and new flavors. They are also increasingly using social media influencers to market their products online. Online sales are expected to exceed $2.4 billion in 2027, or 34% of sales for that year. Supermarket sales claimed the largest share in 2019 due to easy accessibility. Most supermarkets also offer higher discounts and more promotional offers than smaller health food stores due to their ability to buy higher volumes of product. Supermarkets can also stock a greater variety of products.

Worldwide, flavored kombucha constituted nearly 75% of the market in 2019. Brewers are expected to increase their use of natural extracts and flavorings as well as increase their use of exotic flavorings through 2027, contributing to an expected compound annual growth rate (CAGR) of 21.8%. Sales of original flavored kombucha are expected to expand at a CAGR of 20% over this time period. 

North America held a 52% share of the global market. An increasing middle-class population and increasing demand for non-carbonated, low-calorie beverages are expected to contribute to higher sales through 2027. The popularity of sports and energy nutrition products among working professionals in Europe is expected to contribute to increased consumption in that region as is more product offerings from large companies such as PepsiCo, The Coca-Cola Co., and Starbucks Coffee Co. Worldwide, the obesity epidemic — obesity has tripled since 1975, contributing to 2.8 million deaths per year — and taxes on sugary beverages are also expected to drive revenue growth for kombucha beverages.

The global market is fragmented with many small and medium-sized companies producing kombucha. Some leading producers include GT’s Living Food, PepsiCo; Reed’s Inc., The Hain Celestial Co., KeVita Inc., Buchi Kombucha, LIVE Beverages, and RedBull.

Fruit Tea

fruit tea
“Some days ‘staying put’ might feel the same as Going Nowhere. Make a cup of tea, and wait for that feeling to pass.” — Vivian Swift, When Wanderers Cease to Roam: A Traveler’s Journal of Staying Put

Whether a steaming hot cup of tea on a cold winter’s night or a cold glass of iced tea on a hot summer’s afternoon, however people choose to enjoy this beverage a great many are doing just that. Worldwide tea consumption, 35.2 liters per capita in 2017, is second only to packaged water consumption. In 2018, revenues totaled $52.1 billion.

Today’s market size shows worldwide revenues for one type of tea, fruit tea, for 2019 and projected for 2027. Fruit flavored tea sales are a small fraction of overall tea sales and will continue to be in the near future; however, sales are expected to increase at a compound annual growth rate (CAGR) of 9.6% through 2027. Overall tea sales are expected to rise at a CAGR of 5.8% over most of this time period.

Growth in the fruit tea market is expected to be driven by a growing consumer preference for low caffeine beverages and fruit-infused products, especially among millennials and the health-conscious. As with other segments of the food and beverage industry that are seeing a rise in organic product sales, organic teas are gaining in popularity but they are still a small segment of the market. In 2019, conventional teas claimed more than 80% of sales. Easy accessibility and affordability are factors in conventional fruit teas maintaining their high market share.

Most people buy their tea offline. A majority of sales take place at supermarkets and discount stores. Specialty retailers and teahouses are gaining in popularity among consumers who want premium teas with unique flavors. While online sales have a small share of the market, they are expected to have the fastest growth through 2027, with a CAGR of 10.6%.

The Asia-Pacific region claimed more than 35% of the global market in 2019. China is the largest producer and consumer of fruit tea. Demand for fruit and floral-infused beverages has seen significant growth in that country in recent years. North America is expected to experience the fastest growth, a CAGR of 10.5%, from 2020 to 2027 due to shifting consumer preferences for healthier fruit-flavored beverages. The increasing popularity of ready-to-drink beverages is also expected to contribute to this growth. Leading global fruit tea manufacturers include Harney & Sons Fine Teas, R. Twining and Company Ltd., Tata Consumer Products, Hain Celestial, Unilever, The Bigelow Tea Co., Dilmah Ceylon Tea Co. PLC, Tiesta Tea, and Bettys & Taylors of Harrogate Ltd.

Geographic reference: World
Year: 2019 and 2027
Market size: $2.4 billion and $5.1 billion, respectively
Sources: “Fruit Tea Market Size, Share & Trends Analysis Report by Product (Conventional, Organic), by Distribution Channel (Offline, Online), by Region (North America, Europe, APAC, CSA, MEA), and Segment Forecasts, 2020 – 2027,” Grand View Research Report Summary, March 2020 available online here; “Fruit Tea Market Size Worth $5.1 Billion by 2027 | CAGR: 9.6%: Grand View Research, Inc.,” CISION PR Newswire, April 23, 2020 available online here; “Tea Market by Type (Green Tea, Black Tea, Oolong Tea, Fruit/Herbal Tea, and Others), Packaging (Plastic Containers, Loose Tea, Paperboards, Aluminum Tins, and Tea Bags), Distribution Channel (Supermarkets/Hypermarkets, Specialty Stores, Convenience Stores, Online Stores, and Others) and Application (Residential and Commercial): Global Opportunity Analysis and Industry Forecast, 2019-2026,” Allied Market Research Report Overview, December 2019 available online here; Dan Bolton, “Tea Consumption Second Only to Packaged Water,” Worldtea News, May 1, 2018 available online here; “Tea Quotes,” Goodreads available online here.
Image source: TerriC, “tea-cup-vintage-tea-cup-tea-cup-2107599,” Pixabay, March 1, 2017 available online here.

Decaffeinated Coffee

coffee
Does your morning routine include reaching for a cup of hot coffee? If so, you’re not alone. Worldwide, 2.25 billion cups of coffee are consumed each day.

Legend has it that coffee was discovered in Ethiopia in the 9th century. By the 15th century, coffee was being grown in Yemen. From there the coffee trade spread to the Arabian Peninsula, Persia, Egypt, Syria, and Turkey. The first known coffee shop opened in Constantinople around 1475. In the 1600s coffee houses opened in England, Austria, France, Germany, and Holland. Coffee came to America in the 18th century. In 1903, German merchant Ludwig Roselius and his co-workers invented the first commercially successful decaffeination process and patented it in 1906. Back then, benzene was used as a solvent to make decaffeinated coffee, however, that’s no longer the case as benzene has been classified as a carcinogen.

Currently, several methods are used to decaffeinate coffee. The direct method involves steaming unroasted coffee beans and then rinsing the beans in an organic solvent such as dichloromethane or ethyl acetate to extract the caffeine. This process is repeated several times until the caffeine content reaches the required standard. In the United States, 97% of the caffeine has to be removed. In the European Union, 99.9% has to be removed by volume in order for the coffee to be called decaffeinated.

In the indirect method, coffee beans are soaked in hot water for several hours, then the beans are removed from the water and either dichloromethane or ethyl acetate is used to extract the caffeine from the water. The caffeine is then extracted from the solvent. The same water is recycled through the process with new batches of beans until an equilibrium is reached where the beans and the water have a similar composition except for the caffeine so no coffee strength or flavorings are lost.

In the Supercritical CO2 process, unroasted coffee beans are steamed then added to a high-pressure container. A mixture of water and CO2 is circulated through the container. The caffeine dissolves into the CO2 while the compounds contributing to the flavor in the coffee remain in the bean. In a separate container, the caffeine is extracted from the CO2 and then the CO2 is recirculated to the high-pressure container.

The Swiss Water process uses Green Coffee Extract (GCE), a solution containing water-soluble components of green (unroasted) coffee except for the caffeine. The caffeine from the unroasted coffee beans is drawn to the GCE. Once the GCE is caffeine-rich, it’s filtered to remove the caffeine and reused to remove additional caffeine from the unroasted coffee beans.

The Triglyceride process involves soaking unroasted coffee beans in a hot water/coffee solution to draw the caffeine to the surface of the beans. The beans are then transferred to another container and immersed in coffee oils and left to soak. After several hours of exposure to high heat, the triglycerides in the oils extract the caffeine. The beans are separated from the oils and dried. Then, the caffeine is removed from the oils. The oils are reused to decaffeinate another batch of coffee beans.

Today’s market size shows the revenues for decaffeinated coffee in 2019 and projected for 2027. The decaffeinated market is a very small segment of the $424.7 billion global coffee market. Traditionally, decaffeinated coffee drinkers are older and/or have health conditions in which doctors recommend limiting caffeine intake. As populations age, the size of the decaffeinated coffee market is expected to grow. Growth is also expected to come from millennials who constitute more than 31% of the world’s population. Millennial coffee drinkers prefer organically and sustainably-grown, decaffeinated, and lightly roasted coffee beans. In the United States, 19% of decaffeinated coffee drinkers are millennials. Overall, demand for decaffeinated coffee is also expected to rise among health-conscious individuals who want to cut back or eliminate their caffeine consumption due to caffeine’s negative effects on health, including jitteriness, restlessness, insomnia, and elevated blood pressure. In a 2017 report by the National Coffee Association, 68% of consumers in the United States thought it was necessary to reduce their caffeine intake.

Arabica beans comprised the majority of the global decaf coffee market in 2019, followed by Robusta beans. Arabica beans have naturally less caffeine than other varieties and are regarded as providing a superior coffee flavor, aroma, and body. The natural fruity and sweet flavor makes coffee made with these beans suitable for drinking without added sweeteners. Robusta beans are more bitter but easier to tend on the farm and less expensive than Arabica beans. The lower cost is driving demand in this segment. This demand is expected to grow the fastest, at a compound annual growth rate of 8.1% through 2027.

In 2019, Europe was the largest market for decaffeinated coffee due to the popularity of coffee in the region along with consumers’ growing awareness of caffeine’s side effects. The Asia-Pacific region is expected to experience the fastest growth as health-consciousness and demand for other decaffeinated beverages rises. North America is the largest importing region, followed by Europe. Some leading global decaffeinated coffee processors include Swiss Water Decaffeinated Coffee Inc., LifeBoost Decaf, Cafe Don Pablo Colombia Supremo Decaf, No Fun Jo Decaf; Fresh Roasted; and Volcanica Coffee Costa Rica Tarrazu Decaf.

Geographic reference: World
Year: 2019 and 2027
Market size: $1.65 billion and $2.8 billion, respectively
Sources: “Decaffeinated Coffee Market Size, Share & Trends Analysis Report by Product (Roasted, Raw), by Bean Species (Arabica, Robusta), by Distribution Channel, by Region, and Segment Forecasts, 2020 – 2027,” Grand View Research Report Summary, April 2020 available online here; “Decaffeinated Coffee Market Size Worth $2.8 Billion by 2027 | CAGR: 7.0%: Grand View Research, Inc.,” CISION PR Newswire, April 15, 2020 available online here; “Decaffeination,” Wikipedia, April 17, 2020 available online here; “The Caffeine Fix: Coffee Consumption, History, Trends & Industry Statistics,” Much Needed, February 22, 2020, updated April 23, 2020 available online here; “Global Markets for Decaffeinated Coffee Brochure,” LMC International, April 2019 available online here; “Coffee Worldwide,” Statista available online here; Tasmin Grant, “Exploring Millennial Trends in Specialty Coffee,” Perfect Daily Grind, February 3, 2020 available online here; Lee J. Miller and Wei Lu, “Gen Z Is Set to Outnumber Millennials Within a Year, Bloomberg, August 20, 2018 available online here; “The History of Coffee,” National Coffee Association available online here; “10 Differences Between Robusta and Arabica Coffee,” The Roasters Pack, September 19, 2014 available online here.
Image source: emilie767, “smoky-mountains-coffee-nature-3021394,” Pixabay, December 19, 2017 available online here.

Cannabis-Infused Beverages

cannabis beverage tea
About two-thirds of Americans live in states where some form of cannabis is legal. Although it is illegal at the Federal level, 33 states have legalized medical cannabis and 10 states have legalized cannabis for adult recreational use. Canada legalized cannabis for medical use in 2001, recreational use in 2018 and in 2019 legalized cannabis edibles, extracts, and topicals. In the rest of the world, legalization varies by country but it has been decriminalized or made legal in some form throughout most of Central and South America and Africa. With cannabis legalized in so many locations throughout the world, the potential customer base for cannabis-infused beverages is quite large. According to a Yahoo News/Marist poll in 2017, in the United States alone, 54.5 million adults use marijuana, with 34.7 million adults using marijuana on a regular basis.1

Today’s market size shows the worldwide revenues of cannabis-infused beverages for 2018 and projected for 2025. While THC-infused product demand is driven by adults who use cannabis for recreational purposes, CBD-infused products are mainly consumed for medicinal purposes.2 Many consumers believe that CBD can treat chronic pain, anxiety, substance use disorders, and nervous system diseases among others. Growth in the cannabis-infused beverage market is expected to be fueled in part by rising demand for wellness drinks. Recently, cannabis consumer preferences have been turning away from smoking and toward the consumption of beverages, tinctures, chocolates, and other edibles. In the next few years, cannabis-infused beverages are expected to gain market share over other consumables that health-conscious consumers consider unhealthy, such as chocolates, cookies, brownies, and gummies. Those looking for healthier drinks tend to prefer nonalcoholic cannabis-infused beverages such as tea, water, carbonated beverages, and fruit and energy drinks. The nonalcoholic beverage category was the largest and fastest-growing segment in the market in 2018 with demand largely fueled by millennial women.

The alcoholic cannabis-infused beverage market was more than half the size of the nonalcoholic segment in 2018. Brewers are capitalizing on the cannabis-infused beverage demand by infusing their beers with THC and CBD. In some cases, brewers are partnering with marijuana growers to develop new products. In 2017, Constellation Brands, the third-largest beer manufacturer in the U.S., partnered with Canopy Growth, the world’s largest marijuana grower, to develop a line of new products. While trying to gain market share in this new product category, breweries may also be trying to maintain their market share overall. In a 10 year study at the University of Connecticut and Georgia State University, researchers found that in U.S. counties where marijuana was legalized, sales of beer and wine decreased by 15%.

By region, North America is the largest and fastest-growing market for cannabis-infused beverages and Europe is expected to see significant growth in the next few years due to the rising numbers of cannabis consumers in the region. Top companies in this industry include New Age Beverages Corp.; The Alkaline Water Co.; Phivida Holdings, Inc.; Koios Beverage Corp.; VCC Brand; Dixie Brands Inc.; Keef Brand; Hexo Corp.; Aphria; and Canopy Growth.

1 Once or twice a month.
2 THC stands for tetrahydrocannabinol. It is the chemical in cannabis that has psychoactive properties. CBD stands for cannabidiol. CBD does not have psychoactive properties.

Geographic reference: World
Year: 2018 and 2025
Market size: $901.8 million and $2.8 billion, respectively
Sources: “Cannabis Beverages Market Size, Share & Trends Analysis Report by Type (Alcoholic, Non-Alcoholic), by Component (Cannabidiol (CBD), Tetrahydrocannabinol (THC)), and Segment Forecasts, 2019 – 2025,” Grand View Research Report Summary, January 2020 available online here; “Cannabis Beverages Market Size Worth $2.8 Billion by 2025 | CAGR: 17.8%: Grand View Research, Inc.” CISION PRNewswire, January 14, 2020 available online here; “Yahoo News/Marist Poll: Weed & The American Family,” Marist Poll Press Release, April 17, 2017 available online here.
Image source: Kimzy Nanney, “Marijuana Herbal Tea,” Unsplash, February 28, 2019 available online here.

Tea

tea

Worldwide, tea is the second-most consumed nonalcoholic beverage behind packaged water.1 Per capita consumption totaled 35.2 liters in 2017. According to legend, tea was discovered in China in 2737 B.C. by the emperor when leaves from a wild tree blew into a pot of boiling water. He named the drink “ch’a”, which means “to investigate”, to describe the warm feeling he felt when drinking this new beverage as if the liquid was investigating every part of his body. In 200 B.C. the emperor of China at that time ruled that a special written character be used when mentioning tea. The character consisting of wooden branches, grass and a man between the two was meant to symbolize tea bringing nature and humankind into balance in the Chinese culture.

Starting in the 8th century, trade with China introduced this drink to other parts of the world. It is now an important part of the culture in countries such as Japan, the United Kingdom, and Turkey in addition to China. In 2016, Turkey ranked number one in per capita consumption in the world, 6.96 pounds, followed by Ireland (4.83 lbs.), the United Kingdom (4.28 lbs.), Russia (3.05 lbs.), and Morocco (2.68 lbs.). Although the United States ranked 34th in per capita consumption in 2016, tea played an important role in its early history. To capitalize on its popularity in the American colonies, Britain, which exported tea to the colonies, imposed a tea tax. The tax eventually reached 119% of the original price at wholesale. The Boston Tea Party, one of the events that led to the American War of Independence, was a protest against this high taxation.

Today’s market size shows worldwide revenues for tea in 2018 and projected for 2026. In 2017, the last year for which data exists, China was the top producer of tea, followed by India, Kenya, Sri Lanka, and Viet Nam. Black and green are the most popular types globally, commanding 39.2% and 30.5% of the market, respectively. In the United States, sales totaled $19.7 billion in fiscal year 2018, according to Beverage Marketing Corporation. Black tea accounted for 84% of the tea consumed; green tea, 15%. Ready-to-drink tea was the only category to see an increase in both sales volume and value from 2017 to 2018. Ready-to-drink tea represents 46% of the U.S. market by volume, followed by teabags at 44%. Loose leaf tea, tea pods, and iced tea mix account for the rest. Major global manufacturers of tea include Tata Global Beverages, Unilever, Associated British Foods Plc., TAETEA, Barry’s Tea, Apeejay Surrendra Group, Bettys & Taylors Group Ltd., McLeod Russel, ITO EN Inc., and Mighty Leaf Tea Company, among others.

Sales are expected to grow through 2026 due to rising disposable income in many countries and consumers’ growing preferences for organic products and healthier beverages. Some sources claim that the polyphenols in tea, which have anti-inflammatory and antioxidant properties, can lower the risk of type 2 diabetes and cardiovascular disease. Others claim tea can boost one’s immune system, strengthen bones and teeth, reduce the risk of cancer and kidney stones and control blood cholesterol levels. According to Qi Sun, assistant professor in the Department of Nutrition at the Harvard School of Public Health, “Tea consumption, especially green tea, may not be the magic bullet, but it can be incorporated in an overall healthy diet with whole grains, fish, fruits and vegetables, and less red and processed meat.” Sun goes on to warn, however, that any health benefits of tea will likely be negated if one chooses to drink only processed, sugar-sweetened tea beverages.

January is National Hot Tea Month in the United States. May our readers have time to brew a cup, slow down, and savor life’s beautiful moments!

1 Does not include tap water.

Geographic reference: World
Year: 2018 and 2026
Market size: $52.1 billion and 81.6 billion, respectively
Sources: Sumesh Kumar and Roshan Deshmukh, “Tea Market by Type (Green Tea, Black Tea, Oolong Tea, Fruit/Herbal Tea, and Others), Packaging (Plastic Containers, Loose Tea, Paperboards, Aluminum Tins, and Tea Bags), Distribution Channel (Supermarkets/Hypermarkets, Specialty Stores, Convenience Stores, Online Stores, And Others) and Application (Residential and Commercial): Global Opportunity Analysis and Industry Forecast, 2019-2026,” Allied Market Research Report Summary, December 2019 available online here; “The History of Tea,” Coffee Tea Warehouse available online here; “List of Countries by Tea Consumption Per Capita,” Wikipedia, November 13, 2019 available online here; “Crops,” Food and Agriculture Organization of the United Nations, January 18, 2019 available online here; Dan Bolton, “Tea Consumption Second Only to Packaged Water,” World Tea News, May 1, 2018 available online here; Dan Bolton, “RTD Leads Growth in US Tea Market,” World Tea News, December 17, 2018 available online here; “Tea Market Size, Share & Trends Analysis Report by Product (Black, Green, Oolong, Herbal), by Distribution Channel (Supermarkets & Hypermarkets, Specialty Stores, Online), by Region, and Segment Forecasts, 2019 – 2025,” Grand View Research Report Summary, August 2019 available online here; “Tea Fact Sheet – 2018-2019,” Tea Association of the U.S.A. Inc. available online here; “Tea: A Cup of Good Health?” Harvard Men’s Health Watch, August 2014 available online here.
Image source: TerriC, “tea-cup-vintage-tea-cup-tea-cup-2107599,” Pixabay, March 1, 2017 available online here.

Rum

Whether “on the rocks,” mixed in a mojito, or poured over a cake, rum remains a popular and versatile drink. It is the third most popular distilled spirit in the United States, behind vodka and whiskey. In recent years, rum distillers have been adding flavorings such as coconut, citrus, and spices to their product. In 2019, for the holidays, Captain Morgan introduced gingerbread spiced rum to its product lineup. Currently, flavored and spiced rum accounts for more than 55% of rum sold in the United States.

Rum is an alcoholic beverage made from molasses, a byproduct of sugar refining.1 It was first distilled in the early 17th century in the West Indies. Due to trade, the popularity of this drink spread to the British colonies of North America. The first distillery in the colonies opened in 1664 on Staten Island, New York. Soon after, colonial New England became a distilling center. Distilleries in Massachusetts and Rhode Island provided up to three-quarters of the rum for export. By the middle of the 18th-century, 93 distilleries in these two states were producing about 1.2 million gallons per year. 

Rum figured prominently in the trade between the North American British colonies, Africa, and the West Indies. Slaves were brought from Africa to the West Indies and traded for molasses. The molasses would be made into rum in colonial New England distilleries, then exported to Africa to trade for more slaves.

Distilleries in Connecticut, New York, and Pennsylvania mostly supplied the domestic market. By the Revolutionary War, the consumption of rum in the colonies was estimated to be three imperial gallons for every man, woman, and child.

Today’s market size shows the total U.S. rum supplier gross revenues for 2008 and 2018. Overall sales have been trending downward since 2013 when sales reached its highest in at least a decade and a half, 25.6 million 9-liter cases. In 2018, 23.9 million cases were sold, a 1.51% drop from the 24.24 million cases sold in 2008, and a 6.6% drop from 2013 levels. Gross revenues increased by 5.41% from 2008 to 2018 but trended downward 3.93% from 2013 to 2018. While value and premium types of rum have seen their sales decrease, high-end premium and super premium sales increased from 2008 to 2018. High-end premium sales increased by 21.21%, with revenues increasing by 24.11%. Sales of 9-liter cases of super premium rum increased by nearly 250% during this time period, its revenues increasing 258%. Currently, there are 194 rum distillers in the United States producing more than 400 brands. Bacardi was the top brand in 2018, selling 6.49 million 9-liter cases in the United States. Worldwide, the top five brands by 2018 sales volume include Tanduay (20.1 million 9-liter cases), Bacardi (17.1 million), Captain Morgan (11.7 million), McDowell’s No. 1 Celebration (11.2 million) and Havana Club (4.6 million).

1 Some modern brands of rum are made from sugarcane juice.

Geographic reference: United States
Year: 2008 and 2018
Market size: $2.18 billion and $2.3 billion, respectively
Sources: “Rum: More Than Just Piña Coladas…,” Distilled Spirits Council, February 2019 available online here; “Rum,” Wikipedia, November 25, 2019 available online here; “Rum,” Encyclopedia Britannica available online here; Kyle Swartz, “Captain Morgan Rolls Out Gingerbread Spiced Rum,” Beverage Dynamics, November 21, 2019 available online here; Thomas Henry Strenk, “Rum’s Conundrum,” StateWays, May 31, 2018 available online here; “American Rum Producers,” Rob’s Rum Guide available onlne here; “Colonial Molasses Trade,” Wikipedia, March 31, 2019 available online here; Jan Conway, “Rum Industry – Statistics & Facts,” Statista, August 6, 2018 available online here; Jan Conway, “Sales Volume of the United States Spirits Industry from 2010 to 2018, by Category,” Statista, February 19, 2019 available online here; Jan Conway, “Leading Rum Brands Worldwide in 2018, Based on Sales Volume (in Million 9 Liter Cases)*,” Statista, July 8, 2019 available online here; Jan Conway, “Volume Sales of the Leading Rum Brands in the U.S. 2018,” Statista, August 5, 2019 available online here.
Image source: Paul Steuber, “cocktail-mojito-drink-alcoholic-2306939,” PIxabay, May 12, 2017 available online here.

Craft Microbreweries

craft beer

Craft microbreweries differ from craft breweries. Craft breweries are limited to producing less than 6 million barrels of beer. Microbreweries, by definition, are limited to producing less than 15,000 barrels and must sell at least 75% of that outside of the brewery.1 On-site sales often take place in taprooms and restaurants. There are more microbreweries in the United States than regional craft breweries and brewpubs combined. According to Brewers Association Chief Economist Burt Watson, microbreweries will continue to grow by double-digits in the next few years because of unused brewing capacity, innovative product offerings, and consumers’ preference for local, community-oriented experiences. As Paul Gatza, director of the Brewers Association, states: “The beer drinker is changing. It’s not just drinking the beer anymore. It’s drinking the beer and posting a picture on Instagram…”

Today’s market size shows the number of craft microbreweries in 2012 and 2017, a growth of 233%. The number of microbreweries continued to grow in 2018, up 15%, to 4,522. In 2012, microbreweries comprised 46.2% of all breweries in the United States. By 2018, that jumped to 60.7%. In 2017, production totaled 5.7 million barrels. This represented 22.7% of all craft beer produced that year. Craft beer garnered 13.2% of the overall beer market in 2018, up from 12.6% the year before.

Friday, August 2, is International Beer Day. Please celebrate responsibly!

1 Definition source: American Brewers Association.

Geographic reference: United States
Year: 2012 and 2017
Market size: 1,143 and 3,812 breweries, respectively
Sources: “USA Snapshots,” USA Today, March 15, 2019, page 1A; Mary Ellen Schoup, “Brewers Association: Microbreweries and Taprooms are ‘Clearly the Growth Engine of Craft’,” BeverageDaily.com, May 3, 2018 available online here; “Number of Breweries,” Brewers Association available online here; “Craft Beer Industry Market Segments,” Brewers Association available online here; Keith Gribbins, “Craft Beer Overall Realizes 4 Percent Total Growth in 2018, While 219 Breweries Close, According to the Brewers Association,” Craft Brewing Business, April 3, 2019 available online here.
Original source: Brewers Association
Image source: tookapic, “beer-glass-drink-beverage-alcohol-932320,” Pixabay, September 28, 2015 available online here.

Irish Whiskey

Irish whiskey pot still

The first record of Irish whiskey goes back to 1405. For several hundred years, distilling whiskey was solely a private affair in Ireland, with people distilling the spirit at home. In 1608 the first license to distill whiskey was issued to landowner and Governor of County Antrim, Sir Thomas Phillips. Old Bushmills Distillery, registered in 1784, is still in operation today in Northern Ireland. In 1781, the government of the United Kingdom outlawed private distilling operations. By the late 18th century around 2,000 stills were thought to be in existence, with two-thirds of the output coming from illegal stills. By 1885, twenty-eight legal distilling businesses were operating. Before Prohibition, Irish whiskey was the most popular form of whiskey consumed in the United States. Interest waned after that and by the latter half of the 20th century, only two distilleries remained in operation. But, more recently its popularity has seen a resurgence in the United States and around the world.

In order to be called Irish whiskey, production of the beverage must adhere to regulations drafted in 1980. The whiskey must be made in Ireland from a mash of malt and cereals, not contain additives except water and caramel coloring, retain the taste and smell of whiskey and be bottled with no less than 40% alcohol by volume. Irish whiskey malt is dried in a closed kiln, away from fire and smoke. Traditionally, the whiskey is triple distilled in copper pot stills1 and by law must be aged for at least three years in wooden barrels, often in used bourbon barrels or wine casks.

Today’s market size shows the U.S. suppliers’ annual gross revenue of Irish whiskey in 2003 and 2018, a more than 1,200% increase. In 2018, Irish whiskey accounted for 60% of all beverages exported to the United States from Ireland. The United States was the largest market, valued at more than €340 million, a 9% increase from 2017. Around the world, Ireland saw double-digit increases of exports to Central and South America (+42%), Australia and the South Pacific (+36%), the United Kingdom (+25%), the European Union (+16%), and Africa (+15%) from 2017 to 2018. As of May 2018, there were 18 licensed whiskey distilleries in Ireland producing an estimated 175 brands.

Sláinte!

1 Modern Irish distilleries use column stills for grain and blended whiskey. Pot stills are used for high-quality malt whiskey.

Geographic reference: United States
Year: 2003 and 2018
Market size: $75 million and $1 billion, respectively
Sources: “USA Snapshots: Irish Whiskey Generates $1 Billion,” USA Today, March 13, 2019, page 1A; “The History” available online here; Kate Phelan, “A Brief History of Irish Whiskey,” Culture Trip, June 26, 2018 available online here; Lance Mayhew, “Irish Whiskey Basics,” The Spruce Eats, April 4, 2018 available online here; Colleen Graham, “Your Complete Guide to Whiskey Styles,” The Spruce Eats, March 23, 2018 available online here; Export Performance and Prospects 2018-2019, Bord Bia available online here; Liam Campbell, “The New and Soon to Open Irish Whiskey Distilleries You Need to Know About,” The Taste, May 4, 2018 available online here; “The Bushmills History” available online here; Jonny McCormick, “This is a Golden Age for Irish Whiskey Blends,” Whiskey Advocate, February 4, 2019 available online here; “Instant Expert: Irish Whiskey,” Whiskey Advocate, March 22, 2017 available online here; “Irish Whiskey Distillation,” Whiskey.com available online here.
Original source: Distilled Spirits Council
Image source: Richard Mcall, “whiskey-brewing-copper-kettle-2554629,” Pixabay, July 30, 2017 available online here.

Scotch Whisky

Scotch
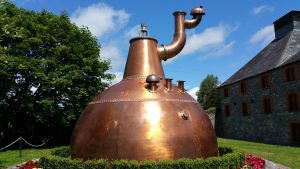
The earliest recorded distilling of Scotch whisky was in 1494, by a monk named Friar John Cor, but the drink back then was not like the Scotch of today. It was considerably more potent and in some cases dangerous to drink. The quality improved in the 16th and 17th centuries as scientific knowledge and distilling equipment improved. Early on the distilling of Scotch took place in monasteries. After the monks were forced to leave, they employed their skills in the wider society and knowledge of the distilling process spread.

Initially, Scotch was consumed for medicinal purposes but later became popular as a social drink. As Scotch became more popular taxes began being imposed, first by the Scottish Parliament and then as a result of The Act of Union with England in the late 17th and early 18th centuries. After that, smuggling became standard practice until the 1830s. According to the Scotch Whisky Association, “by the 1820s, despite the fact that 14,000 illicit stills were being confiscated every year, more than half of the whisky consumed in Scotland was being enjoyed without payment of duty.” After the Excise Act was passed in 1823, which made the distilling of whisky legal in exchange for a license fee and a set payment per gallon, smuggling almost completely disappeared.

With the invention of the Patent Still in 1831, grain whisky was invented. Grain whisky was mixed with malt whisky to create a milder form of Scotch that appealed to more people. There are five categories of Scotch: single malt, single grain, blended malt, blended grain, and blended Scotch whisky. Since November 2009, in order for whisky to be called Scotch, it must be made in Scotland and adhere to the Scotch Whisky Regulations 2009, which define and regulate the production, labeling, packaging, and advertising. In 2015, Heather Nelson became the first woman to head a Scotch whisky distillery by herself.

Today’s market size shows the export value of Scotch in 2017, which equated to 1.23 billion 70cl bottles. Scotland exports this beverage to more than 200 countries around the world. In terms of volume, the top three countries that received these exports were France, the United States of America, and India.

Geographic reference: Scotland
Year: 2017
Market size: £4.36 billion
Sources: “2017 Export Figures,” Scotch Whisky Association, February 9, 2018 available online here; “History of Scotch Whisky,” Scotch Whisky Association, May 31, 2012 available online here; “Scotch Whisky,” Wikipedia, February 21, 2018 available online here; Matthew Vickery, “Woman Challenges Notion Scotch is a Man’s Drink,” Lansing State Journal, January 26, 2018, page B1.
Image source: Adapted from: stevepb, “scotch-whisky-drink-alcohol-glass-729638,” Pixabay, April 20, 2015 available online here.

Craft Beer in Michigan

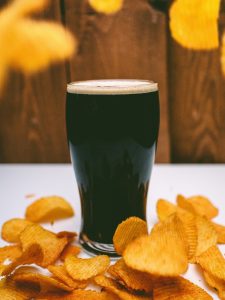
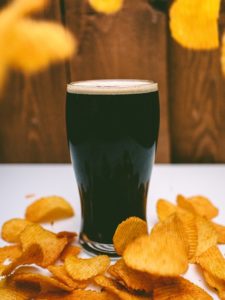
From 2012 to 2016, the number of craft breweries in the United States more than doubled from 2,420 to 5,234. In 2016, sales of craft beer made up 22%—$23.5 billion—of the overall beer market.

Today’s market size shows the number of craft breweries in Michigan and the number of gallons of beer they produced in 2016.

Geographic reference: Michigan
Year: 2016
Market size: 205 craft breweries produced 769,897 gallons of craft beer
Sources: Dillon Davis, “Standing Tall,” Lansing State Journal, April 23, 2017, page 3P; “Number of Breweries,” 2017 available online here.
Original source: Brewers Association
Image source: Tookapic, “Beer-glass-drink-beverage-alcohol-932320,” Pixabay, September 28, 2015 available online here.

Wineries in Michigan


Michigan ranks fifth in the United States in wine production. Most wine grapes are grown in Van Buren, Berrien, Leelanau, and Grand Traverse counties, all within 25 miles of the Lake Michigan coast. The top 3 wines produced are Riesling, Pinot Noir, and Chardonnay. Because several other types of fruit are grown in the state, many wineries make wine from fruit other than grapes, such as with cherries or apples.

Geographic reference: Michigan
Year: 2017
Market size: 127 wineries producing 2.4 million gallons of wine annually
Source: Bob Gross, “Wine and Spirits Industries Booming,” Lansing State Journal, April 23, 2017, page 7P.
Original source: Michigan Grape and Wine Industry Council

American Craft Beer Market in Belgium

Belgians who drink beer love their locally-made beer. In years past, many Belgians considered American beer inferior, but this attitude may be changing. American craft beers are now appearing in Belgian supermarkets and in bars. A craft beer brewed by Seattle’s Schooner EXACT brewery won the top award at the Brussels Beer Challenge in 2015. American beers also won several other gold medals, 5 more than Belgian beers did, that same year.

Today’s market size shows the amount of craft beer exported to Belgium by American brewers in 2015. In comparison, the United States imported 50 million gallons of Belgian beer that year.

Geographic reference: Belgium
Year: 2015
Market size: 160,000 gallons
Source: Thompson, Linda A., “U.S. Suds No Longer Duds,” Lansing State Journal, August 7, 2016, page 4B.

Sake

Sake is an alcoholic beverage, made with rice, that originated in Japan. It is often referred to as rice wine but is actually closer to a beer than a wine based on the way that it is brewed. In the production of wine, the natural sugars in the fruits from which it is made are fermented. In making sake, the sugars that are fermented to produce the alcohol must first be converted from the starches in rice. It is a process very similar to the one used to brew beer.

Today’s market size is the value of Japanese sake exports to the world in 2002, 2012 and the industry’s declared goal for exports by 2020. In 2012, one-third of the sake exported from Japan was imported by the United States.

Geographic reference: Japan
Year: 2002, 2012, and a forecast for 2020
Market size: ¥7.5 billion, ¥8.9 billion and ¥60 billion respectively. In dollar terms, based on average exchange rates each year and using 2013’s exchange rate for the 2020 forecast, those values are $60 million, $112 million, and $616 million.
Source: Eric Peanner and Zhiyi Yang, “In Sake, Japan Sees A Potential Stimulus,” The New York Times, February 22, 2014, pages B1-B2. The average exchange rate data used to convert the Yen to Dollars was obtained at this OzForx Group Limited website.
Original source: National Tax Agency of Japan
Posted on March 11, 2014

Bourbon

The last decade has been one of unexpected growth for whiskey distillers in the United States and in particular for those producing bourbon. Bourbon is made in the United States only—in the same way that Scotch Whiskey must be made in Scotland—and is a type of whiskey made from a grain mash consisting of at least 51% corn mash. The distinctions that define types of whiskey are the primary grain used in the mash with which the whiskey is distilled, the length of time it is aged in a barrel, and the place in which it is made.

Bourbon whiskey was a very fashionable and popular drink in the United States after prohibition and through the 1950s. The drink went out of fashion in the 1960s and spent the next several decades in decline. But that has all changed since the turn of the century. Bourbon is once again a fashionable drink, demand for which is rising so quickly that distillers are having a hard time keeping pace. After all, a high-quality bourbon must spend years in a barrel to age making quick adjustments to inventory problematic.

Today’s market size is the value of bourbon exports from the United States in 2002 and 2013.

Geographic reference: U.S. exports
Year: 2002 and 2013
Market size: $376 million and $1 billion respectively
Source: Clay Risen, “The Billion-Dollar Bourbon Boom — How Did American Bourbon Get So Damn Hot?” Fortune, February 24, 2014, pages 56-65.
Original source: Distilled Spirits Council of the United States
Posted on March 4, 2014

Craft Cider

red_apples_on_tree_193814

Sales in the United States of hard cider tripled between 2007 and 2012. Hard cider is a fermented alcoholic beverage made with fruit juice, usually apple but some ciders are made with other fruit juices, primarily peach and pear. When the term cider is used alone, it may refer to hard cider or to a nonalcoholic apple cider.

Although the hard cider market is still a small fraction of the $10.2 billion craft beer market (2012) it is growing quickly. Cider sales in multi-outlets and convenience stores during the year ended March 24, 2013, totaled $122.5 million for the top 20 cider brands. That’s an increase of 97 percent compared to a year earlier. Capitalizing on the craft cider trend, small and large craft beer manufacturers are creating their own hard cider blends to entice drinkers with new taste offerings. To spark interest in the mainstream beer drinker MillerCoors offers several hybrid beers.

Today’s market size is total sales of hard cider in the United States in 2012.

Geographic reference: United States
Year: 2012
Market size: $600 million
Source: Chris Furman, “Craft Cider Gaining Momentum,” Brewhound, June 3, 2013, available online here. The photo is from a web site offering images free of copyright, here.
Posted on January 24, 2014