Non-Alcoholic Beer

The volume of non-alcoholic beer consumed worldwide is on the rise. According to The Economist (full citation below), the volume of non-alcoholic beer consumption globally was 80% higher in 2012 than it had been in 2007. Part of this rise is the result of increased consumption of this beverage in the Middle East. Increasing penalties for drunk driving in several European countries has also been seen by industry analysts as a contributor to the rise in demand for non-alcoholic beer.

Today’s market size is the volume of non-alcoholic beer sales globally in 2012.

Geographic reference: World
Year: 2012
Market size: 2.2 billion liters (by way of comparison, world consumption of beer annually is in the range of 148 billion liters)
Source: E.H. “Why Are Sales of Non-alcoholic Beer Booming?” The Economist, August 11, 2013, available online here.
Posted on September 17, 2013

Champagne

By definition, champagne is a product of France. In order to be called champagne, a sparkling wine must be made with grapes from the Champagne region of France and must meet an additional set of requirements imposed by the Comité Interprofessionel du Vin de Champagne (CIVIC). The United Kingdom is the largest importer of champagne, followed by the United States and then Germany. U.S. imports of champagne started off the first decade of the new century averaging 18 million bottles annually, it peaked at 23.2 million bottles in 2006 and fell thereafter for three consecutive years. In 2010, champagne imports to the United States saw a small increase from prior year imports.

Today’s market size is the estimated total number of bottles of champagne exported by France in 2011.

Geographic reference: Worldwide
Year: 2011
Market size: 335 million bottles
Source: Tiffany Hsu, “Champagne Sales Surged in 2011, Booze Headed for 2012 Boost,” January 1, 2012, Los Angeles Times, available online here.
Original source: Comité Interprofessionel du Vin de Champagne and the Champagne Bureau
Posted on December 27, 2012

Hop Stocks

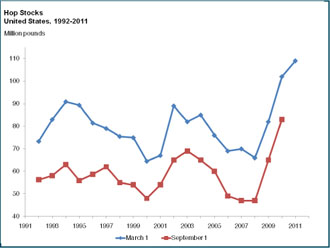
The U.S. Department of Agriculture’s National Agricultural Statistics Agency (NASS) produces annual reports on individual commodities. One of the commodities they track is hops, an aromatic flower used most commonly in the brewing of beer.

The market size presented today is the size of the stock of hops held by hops dealers, hops growers and beer brewers as of March 1, 2011. The graph is a presentation of hops stocks in the United States over a 20-year period and shows how recent stockpiles are at record highs. High stockpiles are a sign of a sluggish market and pressure on pricing, something that has not been seen in most agricultural commodity markets in the last few years.

Geographic reference: United States
Year: 2011
Market size: 109 million pounds
Source: “Hop Stocks,” March 2011, an annual report which is available online here. Unlike most graphs we present on this blog, we did not produce this one. It comes directly from the USDA report.
Original Source: U.S. Department of Agriculture, NASS
Posted on August 1, 2011

Coffee

In the Upper Midwest of the United States this time of year, our love of hot drinks is particularly noticeable, as it is, no doubt, anywhere the temperatures drop below freezing and stay there a while. This made us think of the market for coffee. The market sizes presented here are world production figures for two years.

The production of this commodity is tracked in 60-kilogram bags of the beans. The price of coffee is tracked by the International Coffee Organization and has been rising steadily in recent years. Based on the monthly composite indicator price at which coffee is traded on the New York market the price rose 160% between December 2000 and December 2009. Over the same period, world inventories grew by 40%. And, since December 2009 the price has continued to rise, reaching 173.9 cents per pound in November 2010, the equivalent to 260% of the price per pound back in December 2000. Savor every sip!

We could do a simple calculation to get a rough approximation of the value of coffee produced in 2010, based on the information in our source report. If the November composite price for all types of coffee beans was $1.74, then a 60-kilogram bag would cost about $47.33 and thus world production in 2010 was worth approximately $5.6 billion. Of course, this is a very crude approximation so take it for what it is worth.

Geographic reference: World
Year: 2008 and 2010
Market size: 133.6 million and 139 million 60-kilogram bags respectively.
Source: “Coffee: World Markets and Trade,” USDA Circular Series, Table 6 and Table 8, December 2010, available online here.
Original source: U.S. Department of Agriculture, Foreign Agricultural Service, and the International Coffee Organization.

Champagne Consumption

Not surprisingly, the nation with the largest consumption of champagne is the nation in which champagne is made, namely, France. The French consume approximately 177.6 million bottles of champagne each year. In terms of per capita consumption, two of France’s territories actually out consume the French population. Guadeloupe has an annual per capita consumption of champagne that is the highest in the world at 3.74 bottles per person. Next is Martinique with a per capita consumption of 3.3 bottles per person and France comes in third with per capita consumption of just under 3 bottles per person (2.93 bottles).

For a list of the countries with the highest champagne consumption, look at the table to which we provide a link in the source note below. Column 3 shows the number of bottles sold annually by country, in millions, and column 7 shows the per capita, bottle consumption figure per country.

Happy New Year!

Geographic reference: World
Year: 2009 (based on publication date)
Market size: 300.62 million bottles annually
Source: de Nederlandse Champagne Pagina’s, a website presenting interesting statisitcs about the champagne business worldwide, available online here.