Boat Dealers

Boat dealers
Source: County Business Patterns
Geographic reference: United States
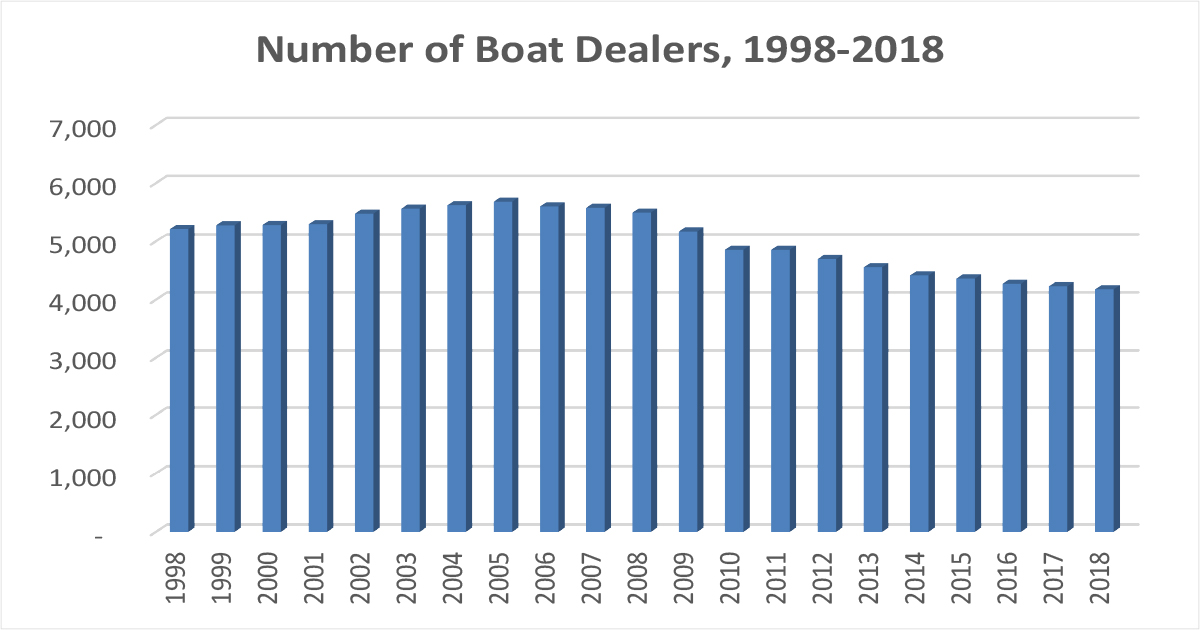
Year: 1998, 2008, 2018
Market size: 5,219, 5,500, and 4,178, respectively

Each year approximately 141 million people in the United States go boating. With summer winding down and Labor Day past, many may be getting ready to put their boats in storage for the winter, while others may be dreaming of next summer and being out on the water in a newly-purchased watercraft of their own. Today’s market size shows the number of boat dealers in the United States in 1998, 2008, and 2018.1 Dealers sell new and used boats, boat motors, and trailers. Some dealers also offer replacement parts and repair services. 

Sales of boats, marine products, and services totaled $42 billion in 2019. This same year, 11,878,542 recreational vessels were registered in the United States, up slightly from 2018. These numbers are expected to be significantly higher in 2020 as sales of new boats increased by 75% from the previous year. With many people canceling their summer vacations and children’s summer camps staying closed due to COVID-19, some chose to spend the money they would’ve spent on these activities on a boat instead. According to Ellen Bradley of the National Marine Manufacturers Association, “people are realizing it is a safe environment for social distancing. [They] are in an environment where [they] can control what [they] encounter, who [they] go boating with.” In some cases, however, demand was outpacing production, as several boat manufacturers shut down either temporarily or permanently in March as a result of the effects of the stay-at-home orders imposed by many state governments. Ninety-five percent of boats sold in the United States are made in the U.S. According to Boating Industry, the top 10 dealers in the United States for 2019 were Quality Boats of Clearwater Inc., M & P Mercury Sales Ltd., Marine Connection, Regal & Nautique of Orlando, BMC Boats, Irwin Marine – NH, Marine Sales Group Inc., Futrell Marine, Hampton Watercraft & Marine, and Buckeye Sports Center.

1 According to a report by Dun & Bradstreet First Research, the number of boat dealers totaled about 4,300 in 2020.

Sources: County Business Patterns, U.S. Census Bureau, various years available online here; “U.S. Boat Sales Reached Second Highest Volume in 12 Years in 2019, Expected to Remain Strong in 2020,” Business Wire, January 7, 2020 available online here; “Exerpt from Boat Dealers Industry Profile,” Dun & Bradstreet First Research, June 22, 2020 available online here; “Recreational Boating: An American Pastime & Economic Engine,” National Marine Manufacturers Association available online here; “Boat Sales Have Increased by 75 Percent in 2020 as Consumers Seek Ways to Enjoy Summer,” WJLA, July 3, 2020 available online here; “Top 100 Dealers,” Boating Industry, December 2019 available online here; 2019 Recreational Boating Statistics, U.S. Department of Homeland Security, U.S. Coast Guard, Office of Auxiliary and Boating Safety, June 4, 2020 available online here; Ed Killer, “Coronavirus: One of Florida’s Largest Boat Builders Shutters as Sales Plunge Amid COVID-19; 500 Out of Work,” TCPalm, April 2, 2020 available online here.
Image source: Created in house from County Business Pattern data.

Recreational Vehicles

Low gas prices, favorable interest rates, and a renewed interest in the outdoors are fueling record sales of recreational vehicles (RVs). In addition, more people in their 20s and 30s are interested in buying RVs. Trailers, which make up 87% of the RVs sold, appeal more to Millenials who prefer something less expensive for weekend trips. Baby Boomers, in contrast, prefer buying motorhomes in order to spend most of their retirement years traveling. In 2016, a record number of RVs were shipped, more than 430,000. Manufacturers expect a 3.6% increase in shipments in 2017.

Today’s market size is the estimated total retail value of all RVs that will be sold in the United States in 2017.

Geographic reference: United States
Year: 2017
Market size: $18.5 billion (estimated)
Source: Diana Kruzman, “Millennials Fuel Growth in RV Sales,” USA Today for the Lansing State Journal, May 26, 2017, page B4.
Original source: Recreational Vehicle Industry Association

Classic Car Bubble?

ClassicCar

The classic and collector car market in the United States has been strong for many years, slowing during the recession of 2007–2009 but recovering quickly thereafter. In fact, in the summer of 2013 an all-time record was broken, surpassing the prior record by $13 million when a Mercedes W196 sold at auction for $29.6 million. But any market for collectibles fluctuates, such markets are, by definition, speculative. What concerns some in the trade is the overall supply and demand balance.

The concern has to do with the fact that approximately 58% of the classic cars in the United States are owned by baby boomers. It is anticipated, based on historical ownership patterns, that baby boomers will begin to sell off their collections over the next twenty years. Thus, the question arises, is there a strong enough market for these cars, one that can withstand a flood of mid 20th century American cars without causing prices to fall sharply?

Today’s market size is the number of classic and collector cars in the United States in 2013.

Geographic reference: United States
Year: 2013
Market size: 5 million cars
Source: Rob Sass, “For Sale by Boomer,” Car and Driver, March 2014, pages 76-79.
Original source: Hagerty Group
Posted on February 14, 2014

Used Cars in China

The auto market in China, like most markets, is growing rapidly. Demand for cars has been growing annually as the purchasing power of millions of Chinese people increases as that country becomes an economic powerhouse. But because the mass market for automobiles in China is relatively new—having taken off in earnest starting four or five years ago, according to the first source listed below—a used car market is an even newer thing in China. It takes, on average, four years for a new car to be traded in for an “upgrade” and thus become available for resale as a used car.

Today’s market size is the estimated number of used cars sold in China in 2012 as well as a forecast for the number of used cars that will be sold in 2016 and 2020. For comparison purposes, let us point out that in the United States in 2012, used car sales were nearly three times greater than new car sales whereas in China, used car sales were only one-third the number of new car sales. The used car market in China is very young, with lots of room to grow.

Geographic reference: China
Year: 2012 and forecasts for 2016 and 2020
Market size: 4.8, 10.0 and 20.0 million respectively
Sources: (1) Kelvin Chan, “Auto Sales Boom Spawns a Growing Used Car Market in China,” Detroit Free Press, November 27, 2013, available online here. (2) Cliff Atiyeh, Used-car Sales Climb as Americans Hold Onto Older Vehicles,” MSN.com, February 4, 2013, available online here.
Original source: Changan Ford, the U.S. company’s China joint venture
Posted on December 11, 2013

Automotive Semiconductors

Semiconductors—the essential foundation upon which modern electronics rest—are found in all electronic devices as well as many products that one would not initially think of as electronic, such as greeting cards with embedded audio chips in them to produce music upon opening. The use of semiconductors in the automotive industry has made the modern car/truck one of the most advanced electronic devices most people own, often without even knowing it.

Semiconductors are, in the simplest terms, elements like germanium and silicon that conduct electricity at only moderate rates, thus they are “semi” conductors. These elements are used to make the semiconductor chips that are embedded in electronic devices to allow the use of electrical currents as a signal. All cybernetics rely on this type of signaling.

Today’s market size is the estimated value of the automotive semiconductor market, worldwide, in 2012 (when it represented 8.1% of the total world semiconductor market) and a projection of the market’s value in 2020.

Geographic reference: World
Year: 2012 and a projection for 2020
Market size: $23.4 billion and $33.5 billion respectively
Sources: (1) Gary S. Vasilash, “The Supercomputer in Your Garage,” Car and Driver, December 2013, page 34. (2) Monique D. Magee, editor, “Semiconductors,” Market Share Reporter: Trends Over Time, GALE Cengage Learning, 2012, page 553.
Original source: Strategy Analytics
Posted on November 15, 2013

Bikes in Europe

EuroBikes

Bicycles outnumber automobiles in the world and always have. While bike commuting dominates in most of the developing world, it lags far behind in the industrialized centers of the world. But, this is changing, slowly. The industrial world is experiencing a rise in bicycle ridership—in Europe motivated in part by the severity of the recession and financial crisis that started in 2008—and spending on infrastructure supportive of bike commuting is on the rise.

The graph shows the number of bicycles and number of passenger cars sold annually in the 27 countries of the European Community between 2001 and 2012. While the sale of cars has fallen, the sale of bikes has been reasonably steady—despite a very serious recession—and ended the period higher than it began, with sales of 19.7 million units in 2012 versus 18.9 million in 2001.

Geographic reference: European Community
Year: 2012
Market size: 19.72 million bicycles (850,000 of these bikes were electric-assist bicycles, the segment of the market growing most quickly)
Sources: (1) European Bicycle Market, 2013 edition, Industry & Market Profile, October 2013, Association of the European Two-Wheeler Parts’ & Accessories’ Industry, page 18, available online here. (2) Martin Campestrini and Peter Mock, European Vehicle Market Statistics, Pocketbooks, 2011 Edition, ICCT, pages 39-48.
Original source: COLIBI, the Association of the European Bicycle Industry, COLIPED, the Association of the European Two-Wheeler Parts’ & Accessories’ Industry and the International Council on Clean Transportation (ICCT)
Posted on November 6, 2013

Cars in Europe

Car1

The auto market in Europe is far from recovering from the sharp decline in sales that occurred after 2007 and the financial crisis that hit in 2008. Industry forecasts suggest that it has yet to bottom out and many projections have the industry selling fewer cars in 2020 than it did in 2007. Meanwhile, in the United States this year, the auto market is expected to reach 99.4% of the record sales reached in 2007, based on unit sales, assuming the dysfunction in the nation’s capital does not derail the economy.

Today’s market size is the number of cars sold in the European Union—plus Iceland, Norway and Switzerland—in 2007 (peak year for sales), 2013 (based on mid-year projections), and 2020 (forecast).

Geographic reference: European Union, Iceland, Norway and Switzerland
Year: 2007, 2013, 2020
Market size: 16.0 million, 12.1 million, and 14.8 million respectively
Source: “Automakers, Analysts Disagree On When Europe’s Sales Will Finally Rebound,” Automotive News Europe, August 8, 2013, available online here. Vanessa Fuhrmans, “Europe’s Car Makers Spin Their Wheels,” The Wall Street Journal, October 1, 2013, page A1.
Original source: IHS Automotive
Posted on October 10, 2013

Trucking Industry

Freight Transport by Mode Pie Chart

In the United States, trucks move more freight than do all the other forms of transportation combined and this is true when measured in terms of tons moved (68.2% in 2010) as well as in terms of the value of that freight (65.5%). The pie chart shows the percentage of total freight moved by each type of transportation vehicle, both in terms of weight and value. What is clear and quite logical is that the value of items moved by air is quite high but those items don’t weigh much. To move heavier freight, such as construction materials, heavy machinery, agricultural commodities, coal and the like, the nation’s highways, waterways and railways are the economical answer, and for the heaviest items, the latter two networks are the more economical.

Today’s market size is the weight of domestic freight moved by trucks in the United States last year and the revenue those movements produced for the trucking industry.

Geographic reference: United States
Year: 2012
Market size: 9.4 billion tons moved, generating $643 billion in revenue for the trucking industry
Source: Benjamin Preston, “Wheelies: The Stingray’s Stinger Edition,” Wheels.blogs.nytimes, May 30, 2013, available here. The data used to produce the graphic are from Freight Facts and Figures 2011, “Tables 2-1, 2-1M and 2-2.
Original Source: American Trucking Association and the U.S. Department of Transportation, Federal Highway Administration.
Posted on June 5, 2013

Used Hybrid Cars

The used car market is doing quite well having benefited from the sudden decline of automobile leases during the aftermath of the financial crisis of 2008–2009. Expiring auto leases are a primary source of cars feeding the used car market. Hybrid gas-electric cars are a small subset of the overall used car market, primarily because they are a small part of the overall market. Another reason has to do with the fact that hybrid gas-electric cars need to have new battery systems installed after either five years of use or 100,000 miles, on average. The price of these battery systems, depending on the vehicle, run anywhere from $2,000 to $6,000.

Today’s market size is the estimated number of used hybrid gas-electric vehicles on the U.S. used car market in early 2013.

Geographic reference: United States
Year: 2013
Market size: 415,000 vehicles
Source: Ann Carrns, “Tips for Buying and Servicing a Used Hybrid Car,” The New York Times, May 30, 2013, available online here.
Original Source: Edmonds.com
Posted on June 4, 2013

Indian Automobile Makers

Image of a street in India

Two- and three-wheel vehicles far outnumber four-wheel vehicles in India. Nonetheless, the automobile manufacturing industry in that country is growing rapidly, it is expected that by 2015 the number of four-wheel vehicles produced in India will be twice the figure produced in 2012.

Today’s market size is the number of automobiles made in India in 2012 for the domestic market as well as the number of two- and three-wheel vehicles.

Geographic reference: India
Year: 2012
Market size: 3.1 million automobiles and 16.5 million two- and three- wheel vehicles.
Source: Jonny Williams, Digital Manufacturing, March 12, 2013, available online here. The photo above comes from the Enjoy India website, here, with our thanks.
Posted on March 13, 2013

Container Ships

The sharp rise in global trade over the last decades has been a boon to the shipping industry. The number of large container ships, which move so much of the increased quantity of partially and/or fully finished products being traded internationally, has grown and that growth is anticipated to continue through 2016 according to the World Shipping Council. The size of those ships is also on the rise.

The capacity of container ships—referred to in the trade as cellular vessels as they are designed to efficiently load and store freight containers one on top of the other with vertical braces at the four corners—is measured in terms of twenty-foot equivalent units (TEUs), or the number of twenty-foot containers that the vessel can carry (these containers measure 20′ x 8′ x 8’6″). In the year 2000, the world fleet of container ships was primarily made up of ships with a capacity of 1,000 or fewer TEUs. Vessels this size made up approximately three-quarters of the world fleet. In 2012, they represented less than 30% of the fleet with much larger vessels dominating the trade. While the number of ships rose by only 2.8% between 2000 and 2012, the fleet’s carrying capacity almost tripled, rising 182%. So, the average per container ship capacity went from 1,200 TEUs in 2000 to 3,295 in 2012.

Today’s market size is the number and carrying capacity of cellular shipping vessels worldwide in 2000, in 2012, and a projection for where this fleet will stand in 2016.

Geographic reference: World
Year: 2000, 2012, 2016
Market size: Number of ships respectively: 4,828; 4,961 and 5,433
Market size: Carrying Capacity in million TEUs: 5.8; 16.34 and 19.83
Source: “Container Ship Types,” GlobalSecurity.org, July 7, 2011, available online here. “Cellular Fleet Forecast,” Alphaliner, February 2013, available online here.
Original source: Alphaliner
Posted on February 21, 2013

Plug-In, Electric Cars

Tesla booth at Detroit Auto Show

Today’s market size is the number of electric plug-in cars purchased in the United States in 2012. Plug-in electric cars come in two varieties, an all-electric version like the Tesla Model S and a hybrid electric and gas engine version such as the Chevy Volt. The electric and gas engine variety is similar to more conventional hybrid cars but has a much larger battery and can, as the name implies, be plugged into an electric outlet for charging. By contrast, most cars referred to simply as hybrids (non-plug-ins) use a battery system to assists the primary gas engine and they charge that battery internally by capturing energy from the operation of the engine itself.

The world of cars is changing, perhaps slowly but it is changing. In 2012, plug-in electrics represented 0.51% of all sales of automobiles in the United States and 11.6% of all hybrid car sales.

Geographic reference: United States
Year: 2012
Market size: 50,804 plug-in electric cars
Source: JC Reindl, “LG CHEM: Battery Industry’s Future Questioned After Report,” Detroit Free Press, February 17, 2013, page 1.
Posted on February 20, 2013

Aircraft

Commercial Airline Fleet numbers

Upon the news of the merger of American Airlines and U.S. Airways, creating in the process the largest passenger air carrier in the world, our attention is again drawn to the commercial airline industry. It has been a very rocky century so far for this industry.

In late 2011, the parent company of American Airlines, AMR, filed for bankruptcy protection, making American Airlines the last of the big six U.S. airlines to file for bankruptcy protection since the turn of the century (they are listed below). The use of commercial, passenger aircraft as missiles in the September 11, 2001 attacks in the United States can be seen as the first of many disruptions to the system, disruptions that included a worldwide financial crisis and a region-wide shutdown of air traffic due to the threat posed by volcanic ash. Underlying all of this has been the steady increase in the price of jet fuel which now makes up just over one-third of operating expenses for the industry as a whole.

Today’s market size is the number of aircraft being operated by U.S. air carriers. This number does include aircraft used for freight (12.3%) but does not include private jets or the fleets operated by small companies offering nonscheduled, special order flights. The graph shows how the industry fleet size has changed over the past 17 years. A line is also provided on the graph that shows the average, industry-wide, passenger load factor each year (PLF). The PLF is a calculation of Revenue Passenger Miles (RPM) divided by Available Seat Miles (ASM).

Geographic reference: United States
Year: 2001 and 2011
Market size: 8,497 and 7,185 aircraft respectively
Source: “TABLE 2-6. Number of U.S. Aircraft, Vehicles, and Other Conveyances: 2004-2009,” Transportation Statistics Annual Report-2010, Research and Innovative Technology Administration (RITA) – U.S. Department of Transportation (US DOT), available online here. Data for 2010 and 2011 are from an article by Aaron Karp, “FAA: US Commercial Aircraft Fleet Shrank in 2011,” March 13, 2012, Airports Today, available online here. The data on passenger load factors in the graph are from another report by the Bureau of Transportation Statistics, available online here.
Original source: U.S. Bureau of Transportation Statistics, Federal Aviation Agency

Largest Bankruptcy Filings in the U.S. Airline Industry since 2000

TWA (2001)
U.S. Airways (2002)
United Airlines (2002)
Delta Air Lines (2006)
Northwest Airlines (2006)
AMR (American Airlines) (2011)

Posted on February 14, 2013

Used Car Dealers

U.S. Used Car Dealer Sales, 1992-2011

The U.S. auto industry was hit particularly hard by the last recession and financial crisis. For those selling used cars, the recession was less severe than for car manufacturers and new car dealers. As an industry, used car dealers saw a downturn in sales for two years (2008 and 2009) but by 2011 had completely recovered and exceeded their pre-recession sales while new car dealers were still 10% off of their 2007 peak sales.

The graph shows annual sales for U.S. used car dealers from 1992 through 2011. As can be seen in the graph, while the used car industry can usually weather a recession well, as demand for used cars is less impacted by an overall downturn than are sales of new cars, the recession from late 2007 through 2009 was not a “normal” recession. Financial system crises, as the one that started in 2008, lead to more severe and long-term troubles for the economy and they even impact industries that are immune to cyclical recessions.

Geographic reference: United States
Year: 2011
Market size: $82.07 billion
Source: “Estimates of Monthly Retail and Food Services Sales by Kind of Business: 2011,” Monthly Retail Trade Report, November 14, 2012, data for the NAICS industry 44112. The graph was sourced from the same report as well as the Annual Retail Trade Survey 2010, March 30, 2012. Both reports are available online at the Census Bureau website.
Original source: U.S. Department of Commerce, Bureau of the Census
Posted on November 19, 2012

Motorized Bicycles

Ford Motor Company's eBike

Motorized bicycles can be pedaled as standard bicycles or they can be ridden with the use of a gasoline- or electric-powered engine. In 2011, Ford Motor Company introduced the E-Bike at the Frankfurt Motor Show. This bicycle has a lithium-ion battery similar to ones in newer hybrid and electric automobiles. Market share for motorized bicycles is increasing worldwide and expected to grow steadily through the 2010s.

Geographic reference: World
Year: 2010 and forecasted 2018
Market size: 30 million and 47 million units respectively with an estimated total revenue of $11.9 billion by 2018.
Source: Carrie Jones, “A Ford Bicycle,” My Ford, Spring 2012, page 9, and a report by Pike Research, “Annual Sales of Electric Bicycles Will Surpass 47 Million by 2018,” March 27, 2012, available online here. The picture comes from Ford’s media site, here.
Posted on August 7, 2012

U.S. Airlines

miles and operating revenue

The graphic to the right presents both passenger miles of travel provided by U.S. airlines between 1990 and 2008 and operating revenues in those years. The picture this graph presents is a pleasant one with both measures rising pretty steadily over the period shown, with the notable exception of 2001 and 2002, the years for which the terrorist attacks of 2001 had the greatest impact on air travel. However, the airline business is a complicated business. As it turns out, over this same 19 year period, the industry as a whole suffered cumulative losses of $45.3 billion.

Today’s market size is the operating revenue earned by Airlines in 2008, a year in which the industry had losses of $23 billion. Running an airline is a complicated business to be sure.

Geographic reference: United States
Year: 2008
Market size: $186.12 billion
Source: “Table 1073. U.S. Scheduled Ariline Industry — Summary: 1995 to 2009,” Statistical Abstract of the United States 2012, page 677 and earlier editions. A PDF of page 677 of the work is available here. “Table 1-37: U.S. Passenger-Miles (Millions),” from the national transportation statistics available here.
Original source: U.S. Department of Transportation and U.S. Census Bureau
Posted on September 30, 2011

Air Travel Globally

Despite the dramatic declines in air travel for several years following the terrorist attacks in 2001, over the last decade, humans have been flying more and more. Worldwide, approximately 513 million passengers traveled by air in 1991 and by 2007 that figure had quadrupled, reaching 2,076 million.

Today’s market size is the value of the global airline business in 2007 and a forecast of the value in the year 2012. What is not evident from these revenue based figures is the fact that airlines, despite their growth, have not added up to a profitable business sector. In fact, since deregulation in the United States in 1978, airlines as a whole have lost money.

Geographic reference: World
Year: Forecast for 2007 and forecast for 2012
Market size: $430 billion and $711 billion respectively
Source: “The Global Airline Industry Will Reach a Value of $711 Billion in 2012, Forecasts New Report,” a press release dated March 14, 2009, announcing the publication of a market report being offered through a web service called “Report Buyer.” The press release is available here. The original report is titled Airlines: Global Industry Guide.
Original source: Datamonitor
Posted on September 16, 2011

Bike Parking Racks

The current Transportation Commissioner in New York City, Janette Sadik-Khan, is working on increasing the ease with which people are able to use bicycles in that city, even encouraging people to use bikes as their commuter vehicles. While New York has a long way to go to reach the level of biker welcomeness found in other large, world cities it has made progress, doubling the number of bike paths to an estimated 500 miles since 2007. As biking becomes easier in the “Big Apple” the demand for more safe places to park bikes is expected to continue to rise.

Today’s market size is the estimated number of bike parking racks in place in New York City as of the summer of 2011.

Geographic reference: New York
Year: 2011
Market size: 12,800
Source: Frank Bruni, “Bicycle Visionary,” The New York Times, September 11, 2011, page SR1.
Original source: NYC Department of Transporation and John Pucher, co-author of an upcoming book titled City Cycling.
Posted on September 12, 2011

Marinas

Those offering services to boaters by operating docking and/or storage facilities for pleasure craft owners are Marinas. Some marinas offer additional services such as repair and maintenance services as well as retailing of fuel and marine supplies. The states within the United States with the largest marina industries, in order, are Florida, New York, California, Michigan and Massachusetts.

Today’s market size is the estimated revenues from all marinas in the United States in 2009.

Geographic reference: United States
Year: 2009
Market size: $3.3 billion
Source: “Table 9.1. Arts, Entertainment, and Recreation Services (NAICS 71) — Estimated Revenue for Employer Firms: 2001 Through 2009,” Service Annual Survey: 2010. The report on NAICS Sector 71 is available online here.
Original source: U.S. Census Bureau
Posted on September 9, 2011

Auto Sales in August

The business pages of major papers all over the United States today are reporting on U.S. auto and light truck sales in August 2011. What is interesting is the fact that based on a commonly used reporting technique—namely to compare sales in one month with the sales in that month one year earlier—sales in August 2011 look very good. They were 7.5% more than sales of autos and light trucks in August 2010 and 1.2% greater than sales in July 2011. The trend is definitely positive.

However, in times of sudden economic slowdown, or times of recovery after a precipitous decline these sorts of comparisons can be misleading. Daniel Gross put this situation very colorfully in a 2010 Slate article on the auto industry, saying “comparing August 2010 to August 2009 is a little like comparing today’s home run totals to those racked up in seasons when the sluggers were on steroids and the ball was juiced.” Worth noting is the fact that U.S. auto sales averaged 16 million units annually between 2000 and 2007. Based on sales through August of 2011, annual sales are estimated to reach 12.5 million for the year. The industry has been changed greatly by the last recession.

Geographic reference: United States
Year: August 2011
Market size: 1.07 million automobiles and light trucks
Source: Nick Bunkley, “Car Buyers Unfazed by Storms, Financial and Tropical, in August,” The New York Times, September 2, 2011, page B1, and Daniel Gross, “A Successful Turn,” Slate, September 2, 2010, available online here.
Original source: MotorIntelligence.com
Posted on August 9, 2011