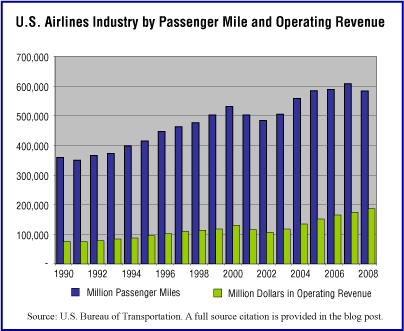
The graphic to the right presents both passenger miles of travel provided by U.S. airlines between 1990 and 2008 and operating revenues in those years. The picture this graph presents is a pleasant one with both measures rising pretty steadily over the period shown, with the notable exception of 2001 and 2002, the years for which the terrorist attacks of 2001 had the greatest impact on air travel. However, the airline business is a complicated business. As it turns out, over this same 19 year period, the industry as a whole suffered cumulative losses of $45.3 billion.
Today’s market size is the operating revenue earned by Airlines in 2008, a year in which the industry had losses of $23 billion. Running an airline is a complicated business to be sure.
Geographic reference: United States
Year: 2008
Market size: $186.12 billion
Source: “Table 1073. U.S. Scheduled Ariline Industry — Summary: 1995 to 2009,” Statistical Abstract of the United States 2012, page 677 and earlier editions. A PDF of page 677 of the work is available here. “Table 1-37: U.S. Passenger-Miles (Millions),” from the national transportation statistics available here.
Original source: U.S. Department of Transportation and U.S. Census Bureau
Posted on September 30, 2011

