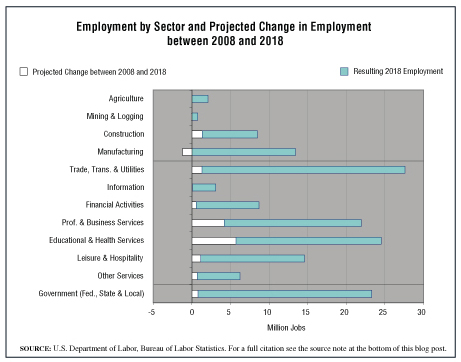
Today—in honor of International Labor Day, celebrated on May 1st around the world—we provide a market size for the U.S. labor force in both 2008 and 2018. The projected size of the labor force is just one of many interesting projections published in a work titled Occupational Outlook Handbook, published periodically by the U.S. Bureau of Labor Statistics.
Areas that are projected to see the greatest number of new jobs are the Healthcare and Social Assistance Sector (slightly more than 4 million jobs), the Professional, Scientific and Technical Services Sector (2.66 million jobs), and the Educational Services Sector (1.69 million jobs). The white segments of the bars on the graph show the number of jobs expected to be added between 2008 and 2018 for each major industry. When it looks as if there is no white segment for a particular industry’s bar, well, that means the number of new jobs projected is tiny, invisible at this range.
Geographic reference: United States
Year: 2008 and 2018
Market size: 136,800,000 and 166,900,000 respectively, an increase of 22%
Source: “Overview of the 2008-18 Projections,” Occupational Outlook Handbook, 2010-2011 Edition, December 3, 2010, available on the BLS website here.
Original source: U.S. Department of Labor, Bureau of Labor Statistics

