The planet we live on is seismically active. According to the United States Geologic Survey, 500,000 earthquakes are detected annually worldwide. Of those, about 100,000 can be felt and a mere fraction of that, about 100, cause damage. While the number of earthquakes that cause damage is comparatively small, the amount of damage caused can be large, totaling into the tens or hundreds of billions of dollars. Losses from the magnitude 9.0 earthquake in Tohoku, Japan in 2011 totaled $220 billion; the 2008 Wenchuan, China earthquake, $90 billion; and the 1994 Northridge, California earthquake, $20 billion. As of 2017, the Northridge earthquake was the third costliest disaster in U.S. history.
Beyond the monetary costs is the toll they take on the residents affected. From 1990 to 2015,1 worldwide more than 916,000 people died as a result of earthquakes, many more thousands were injured and still more displaced.
While the number of earthquakes remains fairly steady from year to year, damages and losses have been rising. Several factors contribute to this. More people are living in earthquake-prone urban areas where the population is denser. Older buildings are not designed to withstand the movement caused by earthquakes. And globalization, the supply and demand interdependency of businesses around the world, causes disruptions far and wide when businesses cannot operate due to damages caused by an earthquake in one region of the world.
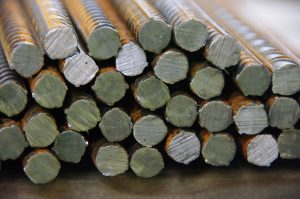
To prevent future damages, both monetary and humanitarian, some governments in earthquake-prone areas have implemented stricter building codes for new construction and regulations for retrofitting older structures. Today’s market size shows the total revenues from seismic reinforcement materials in 2018 and projected for 2026. Seismic reinforcement materials include steel, concrete, wood, and composites such as carbon-fiber-reinforced polymers and glass-fiber-reinforced polymers. Revenues from steel were the highest of the four materials. Steel is expected to account for nearly half of all revenues by 2026 due to its extensive use in rebars, columns, beams, and the like. The Asia Pacific region, with its earthquake-prone countries of China, India, Indonesia, Thailand, and the Philippines and its increasingly urbanized population, is expected to claim 60% of the market by 2025. Leading companies in this industry include Hyundai Steel Company, Simpson Strong-Tie Company Inc., Toray Industries Inc., ArcelorMittal, and LafargeHolcim Ltd., among others.
1 2015 is the last year for which data are available.Geographic reference: World
Year: 2018 and 2026
Market size: $33.6 billion and $42.01 billion, respectively
Sources: “Seismic Reinforcement Materials Market Forecasts | 40 Billion-Dollar Mark by 2025, 570 Pages Report,” Reuters Plus Press Release, July 29, 2019 available online here; “Seismic Reinforcement Materials Market Size Worth Around USD 42.01 Bn by 2026,” GlobeNewswire Press Release, June 12, 2019 available online here; Hazus® Estimated Annualized Earthquake Losses for the United States, FEMA-366, April 2017 available online here; “Is Earthquake Activity Increasing?” British Geological Survey available online here; “Earthquake Statistics,” United States Geological Survey available online here.
Original sources: Global Market Insights and Acumen Research and Consulting.
Image source: horndesign, “iron-rebar-housebuilding-iron-rods-2326791,” Pixabay, May 21, 2017 available online here.
