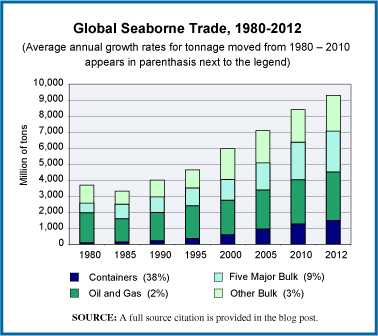
The most energy efficient means of moving freight is by moving it over water. The increase in global trade over the last few decades and particularly the increase in moving raw materials long distances as part of the overall manufacturing process has meant a significant rise in seaborne freight. The chart we offer here shows that increase by charting the tonnage moved annually by sea, broken into three categories: (1) tonnage moved in shipping containers, (2) movements of oil and gas, and (3) movements of cargo in bulk which includes all those things which may be moved in a dry cargo container ship. This final category is further broken down into the five major bulk products and all other bulk. The five major bulk products are iron ore, grain, coal, phosphates and bauxite.
The overall trajectory of growth is clear. What may not be quite as clear is the growth in how much of that freight is moved in container ships, the category shown in blue at the bottom of each bar. The growth of containerized freight movements has been the most striking. Over the period 1990 to 2012 the movement of containerized freight, when measured in tons moved, increased by 16% per year For those interested in more on container shipping, here’s a link to an earlier post we did covering the container ship market.
Today’s market size is the number of tons of freight moved by sea in 2000 and 2012. Of these totals, the percentage of freight moved in container ships, and thus, for the most part, finished goods as opposed to raw materials, was 10% in 2000 and 16% in 2012.
Geographic reference: World
Year: 2000 and 2012
Market size: 5,984 and 9,297 million tons respectively
Source: “Figure 1.2 International Seaborne Trade, by Cargo Type, Selected Years, 1980-2012,” Review of Maritime Transportation 2012, United National Conference on Trade and Development, 2013, page 9, available online here.
Original source: United Nations
Posted on August 19, 2013

