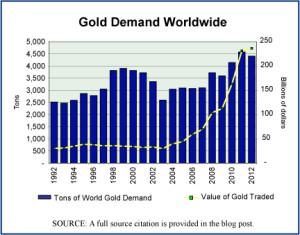
The sharp rise in the price of gold since 2007 is a sign of how uncertain the financial world feels to many people since it went through a serious crisis in 2008. Although the United States abandoned the gold standard in 1933—thus severing the direct convertibility of the U.S. dollar for a set weight and quality of gold—gold is still seen as one of the precious metals that will hold its value during deflationary times or times when other investments are risky. The trade in gold tends to rise during uncertain times as does the price of gold. The annual average price of gold rose during the first decade of the century by 340%, from $279.1 per troy ounce to $1,224.5.
Today’s market size is the volume and value of gold traded in 2000 and in 2012. The graph shows what the global demand for gold has done annually over the period 1992–2012. The increased demand in the last few years has been large but not nearly as large as the rise in the price of gold.
Geographic reference: World
Year: 2000 and 2012
Market size: 3,818 tons valued at $34.26 billion and 4,405 tons valued at $236.40 billion respectively
Source: “Gold Demand Trends, Full Year 2012,” February 2013, World Gold Council, available online here. The graph was produced with data from this same report, as well as the earlier editions of the same, from 1996 and 2005, both of which are available on the same WGC website cited above.
Original source: LBMA, Thomson Reuters GFMS, and World Gold Council
Posted on February 28, 2013

