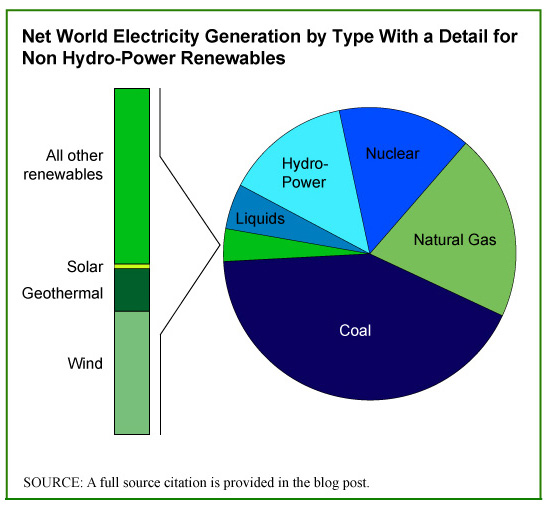
Hydroelectric power plants are the largest producers of electricity from renewable sources. As we saw in yesterday’s Market Size post, they represented 15.97% of world electricity production in 2008. That same year, electricity produced by all other renewable sources accounted for 2.4% of electricity generated. While responsible for only a small percentage of all electricity generation now, renewable sources are forecast to grow steadily through 2035 at which point the nonhydropower portion will account for 7.26% of global production.
The pie chart shows how electricity is generated worldwide and provides a detail of the small pie slice that represents nonhydropower renewables. The renewable energy source that is forecast to grow most quickly in the next decade is solar.
Please note that the Energy Information Administration (EIA) projections exclude electricity generated by so-called off-grid sources, thus renewable energy consumed at the site of production. Energy produced by solar panels installed, for example, on a private home for the sole and exclusive use of the residents of that home is not counted in the EIA projections. If, however, those solar panels are tied into the public electric grid, then the electricity they generate is accounted for in the EIA projections. Time will tell how significant these off-grid electricity generation resources become.
Geographic reference: World
Year: 2007 and 2035
Market size: 463 and 2,554 billion kilowatt hours respectively (please note this is the size of electicity generation from nonhydropower renewable sources)
Source: “Table 12. OECD and Non-OECD Net Renewable Electricity Generation by Energy Source, 2007-2035,” International Energy Outlook 2010, report available online here.
Original source: U.S. Energy Information Administration (EIA)


You’ll have to teach me how to make a pie chart like that. Terriffic!!