Women-Owned Businesses

Women-owned businesses
On March 8 we celebrate International Women’s Day. A day to bring awareness to gender inequality and injustice across the globe and to inspire people to take action to bring about change. This year, 2020, marks the 25th anniversary of the adoption by 189 United Nations Member States of the Beijing Declaration and Platform for Action. This document presents a way forward toward gender equality not only in the late 20th-century but in the 21st century as well. As Ban Ki-Moon, former Secretary-General of the United Nations, wrote in the Forward of the 20th Anniversary Edition of this document: “When we empower women and girls, we realize a better future for all.”

The Beijing Declaration states: “We are determined to … promote women’s economic independence, including employment, and eradicate the increasing burden of poverty on women…” Two ways to do this are to encourage entrepreneurship and support women-owned businesses.1 Globally in 2018, 252 million women were entrepreneurs, with another 153 million women operating established businesses.

Worldwide for every 10 male entrepreneurs, there are 7 female entrepreneurs. Only 6 countries in the world have equal rates of entrepreneurship among men and women: Indonesia, Thailand, Panama, Qatar, Madagascar, and Angola. The countries with the highest percentage of female entrepreneurs include Angola (40.7% of the adult female population are entrepreneurs), Guatemala (24.5%), Chile (21.2%), Madagascar (21.1%), Peru (20.9%), Thailand (19.3%), Colombia (17.8%), Lebanon (17.4%), Brazil (17.3%), and Sudan (17.1%). Where does the United States rank? 14th, with 13.6% of the adult female population being entrepreneurs.

Why did women establish their businesses? Did they seize opportunities given to them or did they start their businesses out of necessity? In almost all of these countries, a majority of women saw an opportunity to start a business and took it. Only in Angola did more women start businesses out of necessity rather than after an opportunity presented itself, 49.5% versus 47.2%, respectively.

Today’s market size shows the number of women-owned businesses in the United States in 2007, 2012, 2017 and 2019. Data for 2017 and 2019 are projections based on the 2012 Survey of Business Owners from the U.S. Census Bureau and adjusted using the gross domestic product figures for January of that year. Over this time period, the number of women-owned businesses grew by 66.1%. In 2007, 28.8% of businesses in the United States were owned by women; in 2019, 42% were. Revenues increased 54.6%, from $1.2 trillion to $1.85 trillion. While most women-owned businesses have no employees—in 2012, this amounted to about 90%—the number of people employed by those that do increased 24% from 7.5 million in 2007 to 9.4 million in 2019.

Half of all women-owned businesses fall into three industries: other services; healthcare and social assistance; and professional, scientific, and technical services. “Other services” includes hair and nail salons and petcare businesses. Women who start these types of businesses tend to do so out of necessity or a need for a job with flexible hours. “Healthcare and social assistance” includes child daycare and home healthcare. “Professional, scientific, and technical services” includes lawyers, bookkeepers, architects, public relations firms and consultants.

The top 10 fastest-growing women-owned companies in the United States are Not Ordinary Media (revenue of $21.4 million in 2018), nutpods ($19.1 million), Kindred Bravely ($9.6 million), SD3IT ($11.9 million), Skinny Dipped ($10.2 million), TalEx ($48.5 million), TrueChoicePack ($7.8 million), 4th & Heart ($14.3 million), Core Software Technologies ($4.6 million) and WT Stevens Construction ($7.2 million). Not Ordinary Media ranked number 10 on the 2019 Inc. 5000 list with a growth rate of 11,996% from 2015 to 2018. The Inc. 5000 is a list of the fastest-growing privately held companies in the United States.

1 Women-owned businesses are businesses that are at least 51% owned, operated and controlled by one or more women.

Geographic reference: United States
Year: 2007, 2012, 2017 and 2019
Market size: 7.8 million, 9.9 million, 11.6 million and 12.9 million respectively.
Sources: “Statistics for All U.S. Firms by Number of Owners by Industry, Gender, Ethnicity, Race, and Veteran Status for the U.S.: 2007,” 2007 Survey of Business Owners, U.S. Census Bureau, December 15, 2015 available online here; “Statistics for All U.S. Firms by Number of Owners by Industry, Gender, Ethnicity, Race, and Veteran Status for the U.S.: 2012,” 2012 Survey of Business Owners, U.S. Census Bureau, February 23, 2016 available online here; Beijing Declaration and Platform for Action, United Nations, 1995, reprinted by UN Women in 2014 available online here; Global Entrepreneurship Monitor 2018/2019 Global Report, Global Entrepreneurship Research Association, January 21, 2019 available online here; “More Than 250M Women Worldwide Are Entrepreneurs, According to the Global Entrepreneurship Monitor Women’s Report from Babson College and Smith College,” CISION PR Newswire, November 18, 2019 available online here; Brit Morse, “These Are the 20 Fastest-Growing Female-Founded Companies in 2019,” Inc., September 19, 2019 available online here; The 2017 State of Women-Owned Business Report, American Express, 2017 available online here; The 2019 State of Women-Owned Business Report, American Express, 2019 available online here; “Women-Owned Businesses,” U.S. Census Bureau available online here.
Image source: Christin Hume, “Workspace Wonder Woman,” Unsplash, July 12, 2017 available online here

Will Women Outnumber Men?

C02T201_25823_image001

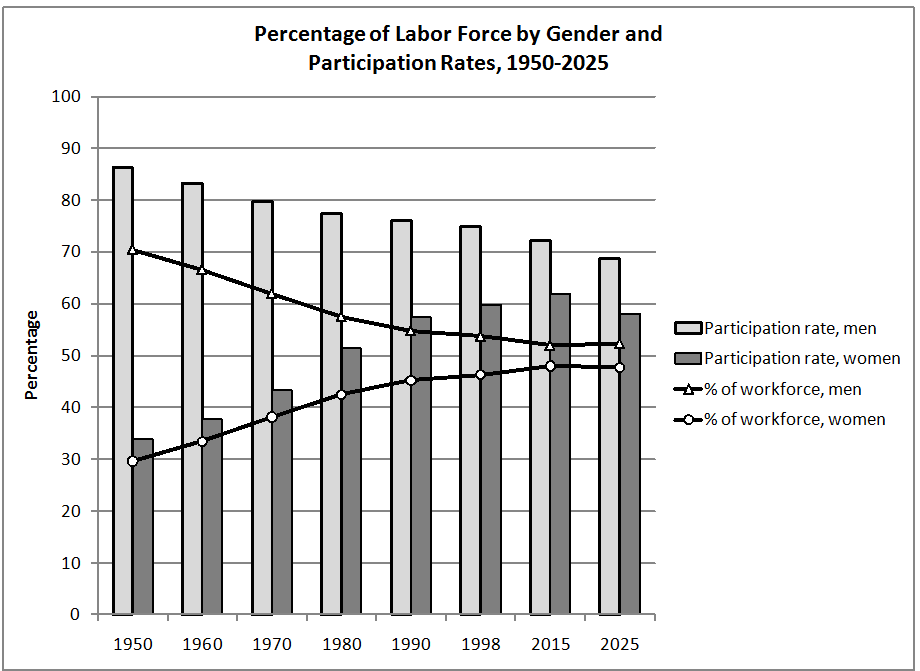
The chart above shows the percent distribution of the workforce by gender. Also shown is the labor force participation rates by gender for 1950 to 2025. Until 2015, the participation rates and, consequently, the share of the workforce has increased for women.  In the same time period, the participation rates and share of the workforce for men have dipped. After 2015, the men’s participation rate is expected to continue to decrease. The women’s participation rate is also expected to decrease, but at a slightly faster rate than the men’s.  As a result, the men’s share of the workforce is projected to increase and the women’s share is projected to decrease, thereby reversing the trend of the past 65 years. 

The decrease in men’s participation rates can be partially attributed to the aging of the population. The availability of Social Security benefits made it possible for more men to retire after age 65.  During the 1970s, Social Security payments were relatively high due to over-adjusting for inflation. As a result, even more men over age 65 retired during this period than in the 1960s. When those aged 62 and older became eligible for Social Security, more men retired from the workforce. By 1994, only half the men 62 years and older were in the workforce; in 1970 the ratio was 75 percent.

The change in the Social Security Act of 1960 made those under age 50 eligible for disability payments.  This has been attributed to the decrease by 4.3% in the labor force participation rate of men aged 25 to 34 during the years 1960 to 1998.  A greater availability of pensions also contributed to the reduction of men’s participation in the workforce.

The increase in women’s participation rates coincided with the modern Women’s Rights Movement. More women entered the workforce at younger ages and stayed in the workforce after their children were born. From 1980 to 2000, the participation rate for those women with children under 18 increased by 16.3%.  Those with children under age 6 increased their participation rate by 18.5%.

More women are now heads of household and sole support of their families. In 1995, nearly 28% of all households were headed by women, 16.3% of which were headed by single women — a striking difference from 1950. In that year, the total percentage of households headed by singles was 9.3%, with only a fraction of that headed by women. 

After 2015, the participation rate for women is expected to decline.  This has to do with the increasing diversity of the workforce and the different participation rates of each race and ethnic group.  Hispanics are expected to have the highest growth rate in the working-age population, but the participation rates for Hispanic women are the lowest among the top ethnic groups.  Meanwhile, the white, non-Hispanic working-age population is expected to have the biggest decrease, but this group has the highest female participation rate.  Therefore, the aggregate labor force participation rate for women is projected to decrease.

During this time period, the men’s aggregate participation rate is also expected to decrease, but at a slower rate than the women’s: Hispanic men have a high rate. This helps to offset the decrease in the participation rates of white, non-Hispanic men. As a result, the men’s share of the workforce starts trending upward, while the women’s share starts trending downward.

The next panel discusses gender differences in employment during the past 25 years.

Sources: Fullerton, Jr., Howard N., “Labor force participation: 75 years of change, 1950-98 and 1998-2025”, Monthly Labor Review, December 1999. Bureau of Labor Statistics. U.S. Department of Labor. “Table 6. Labor force participation rates of women by presence and age of children, March 1980-2000”, Report on the American Workforce 2001. Washington D.C.: U.S. Government Printing Office, 2001. U.S. Census Bureau.  “Table 1. Projections of Households by Type: 1995 to 2010, Series 1, 2, and 3” Retrieved December 5, 2001 from http://www.census.gov/population/projections/nation/hh-fam/table1n.txt. U.S. Census Bureau. “Historical Census of Housing Tables – Living Alone.” Retrieved December 5, 2001 from: http://www.census.gov/hhes/www/housing/census/historic/liv-alone.html.

Are Women Better Able to Weather Economic Storms?

V1Ch2P7B

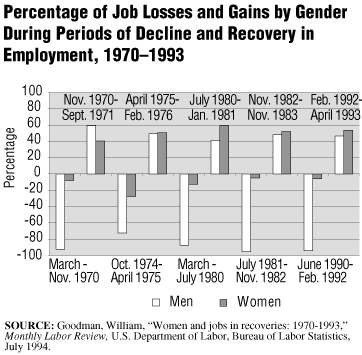
The chart above shows the percentage of job losses and gains by gender and by periods of employment decline and recovery from 1970 to 1993.  The data used to create the chart include only non-farm employment. They do not include self-employment.

In every economic recovery since September 1971, women have gained a larger percentage of the newly created jobs than men have, even though men have consistently lost most of the jobs during times of economic downturn.

Most of the jobs lost during the economic downturns have been in industries that are easily affected by the ups and downs of the economy, such as construction and manufacturing.  Men, traditionally, have held most of these jobs.  On the other hand, many of the jobs that are traditionally held by women continued to grow during the last economic downturn and gained even more during the economic recovery. These jobs include health care occupations, social services, and public school occupations.  The following table shows the percentage of men and women in the various industries.

 Approximate Percentage of Employment by Gender, 1993

Industry

Men (%)

Women (%)

Construction

90

10

Manufacturing

67

33

Health care

18

82

Social services

22

78

Local public schools

30

70

 In an economic downturn, the goods-producing sector and those industries that deal with that sector, such as retail trade, are the ones that lose the most jobs.  Even when there was a recovery, the manufacturing industry still continued to lose jobs.  This was due to automation, foreign competition, and cutbacks in government and commercial contracts. 

While people are less likely to buy goods during an economic slowdown, there is always a need for health care, social services, and schools. The aging of the population, the increased priority people put on health care, and the added jobs when new treatments are developed all contribute to the increase in health care and social service jobs. During the last recovery, the number of jobs in state and local government also expanded, with much of that growth in the school system.

In conclusion, overall, women are more likely to keep and gain jobs during economic cycles than men due to the types of industries that employ the majority of women.  More men are employed in goods-producing industries, which are affected more by economic slowdowns, automation, and foreign competition. More women are employed in service industries and state and local government. These industries do not lose as many jobs during economic downturns and, in recent years, tend to expand the number of jobs both in downturns and recoveries. 


SOURCE NOTE–This essay is one from the first volume of a four volume reference work titled Social Trends & Indicators USA, written by the staff of Editorial Code and Data, Inc. and published, in 2003, by Thomson Gale. It is being used here, by Editorial Code and Data, Inc., to do some testing of electronic data presentation.