Spending on Water and Sewer

Water-Sewer

One of the basic infrastructural needs of any modern society, particularly one in which the density of population is great, such as in urban areas, is that which supplies clean water and carries waste away. It is one of those things that in modern industrial society we take very much for granted and almost don’t notice it, until something isn’t working.

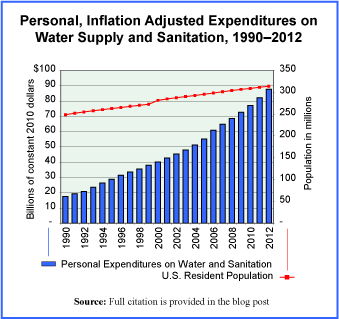
Today’s market size is the amount spent by residents, in the United States, for water supply and sanitation in 1990 and again in 2012. This does not include the expenditures of companies or other entities for water and sewer services but is, rather, the total spent by individuals for personal use. The graph provides a year-by-year picture of these expenditures in constant 2010 dollars, in other words, in inflation-adjusted terms. A red line on the graph is there to show how the population has risen over this period and it is clearly at a rate much slower than the rate of growth in expenditures on water.

Geographic reference: United States
Year: 1990 and 2012
Market size: $27.1 and $85.9 billion respectively (in current dollars)
Source: “Table 2.5.5 Personal Consumption Expenditures by Function (A),” National Income and Product Accounts Tables, (NIPA), Bureau of Economic Analysis, August 7, 2013, available from the BEA web site here.
Original source: U.S. Department of Commerce, Bureau of Economic Analysis
Posted on January 20, 2014

Desalination Plants

In a process known as desalination (or desalinization), salt and other minerals are removed from seawater to produce fresh water suitable for human consumption. As world population rises the demand for fresh water rises even more rapidly since fresh water is used for more than direct human consumption. It is used in agriculture for both crop and livestock production as well as in industrial and mining operations. In particular, a growing quantity of water is being used around the world to extract oil, in both conventional oil well operations and, more notably yet, in hydraulic fracking operations used to extract oil and natural gas from sand tars and shale deposits.

The demand for desalinated water is rising at an estimated rate of 9% per year and is expected to continue to grow at this high rate for some time to come. Desalination plants around the world today produce approximately 65.2 million cubic meters of fresh water per day (24 billion m3 per year), which is equivalent to 0.6% of global water supply.

Today’s market size is an estimate of the money that will be invested to build new desalination plants worldwide between 2010 and 2016. Parts of the Middle East and North Africa are particularly invested in desalination technology, being regions particularly vulnerable to water shortages. In Saudi Arabia, for example, 70% of the total volume of drinking water consumed is supplied through the use of desalination technologies. The Middle East and North Africa are expected to see the largest share of the investments in desalination plants during the period shown here.

Geographic reference: World
Year: 2010–2016
Market size: $88 billion
Source: Water Desalination Using Renewable Energy, Technology Brief 115, March 2012, pages 3-4, available online here. “Saudi Per Capita Water Consumption 91% Higher Than International Average,” Saudi Gazette, September 1, 2012, available here.
Original source: The International Renewable Energy Agency (IRENA) and the International Energy Agency (IEA)
Posted on February 5, 2013

Crop Insurance

The drought being experienced this year in most of the United States will have an impact on the cost of food in the not distant future. Farmers will have a difficult year, but how difficult? As it turns out, less than one might expect. Over the last decades there has been a significant increase in the use of crop insurance in the United States and an escalation of the subsidies received from the federal government to cover crop insurance premiums. In 2011, the federal government picked up 60% of crop insurance premiums. In fact, crop and revenue insurance now represents the primary federal support for farm income, paying $5.2 billion in direct payments to farmers and $7.4 billion in insurance premium subsidies.

Today’s market size post lists the number of acres of farmland covered by crop insurance in 1981 and 2011 as well as the total insured liability each year. The level of government subsidies for crop insurance has risen quite substantially over this period. Total premiums paid for crop insurance in 2011 were approximately $12.3 billion, of which the federal government picked up 60%, or $7.4 billion.

Our hope is that all those impacted by this drought are spared serious damage and that starvation in distant places of this ever more connected world does not rise as a result of crop shortfalls in the United States.

Geographic reference: United States
Year: 1981 and 2011
Market size: Acres: 45 million and 262 million respectively
Market size: Insured liability: $6 billion and $113 billion respectively
Source: Keith Collins and Harum Bulut, “Crop Insurance and the Future Farm Safety Net,” February 10, 2012, available online here and Andrew G. Simpson, “Cap on Subsidy of Crop Insurance Premium Would Save $1 Billion: GAO,” April 13, 2012, available online here.
Original source: FarmDocDaily, Insurance Journal, U.S. Department of Agriculture, and the U.S. Government Accounting Office.
Posted on August 1, 2012

Peat

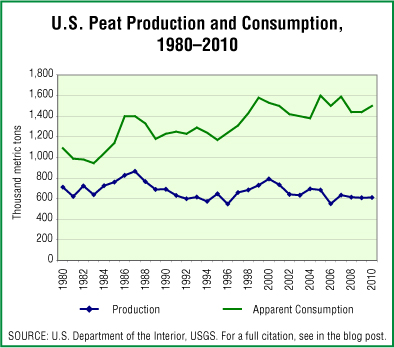
Peat poruction and consumption

Peat is a natural and renewable organic material that is grown in shallow wetlands, primarily in the Northern Hemisphere. It is used widely as a plant-growth medium because of its unusual ability to both retain water and promote drainage. Peat also has industrial uses as a filtration medium to remove toxins in water processing and as an effective absorbent used in the clean-up of fuel and oil spills.

Today’s market size is the estimated f.o.b. plant value of marketable peat from plants in the United States. The graphic provides a look at peat production and consumption over a thirty year period, from 1980 to 2010.

Geographic reference: United States
Year: 2010
Market size: $16 million
Source: “Peat, Statistics and Information,” Mineral Industry Survey, a series of reports produced by the U.S.Geological Survey, made available online and last updated on May 19, 2011. Here is a link to the USGS site.
Original source: U.S. Department of the Interior, USGS

National Flood Insurance Program

With flood waters inundating so many in the Mississippi River Valley and with spillways being opened to try and mitigate the damage further downstream, we turn today to the size of the United State’s National Flood Insurance Program (NFIP), run by the Federal Emergency Management Agency (FEMA). The program was designed to provide a shared pool of resources that could help to reduce the high cost of disaster assistance resulting from flooding along the national waterways.

NFIP is not only an insurance program but a floodplain management and mapping program. Participation in NFIP is voluntary at the community level, with a couple of exceptions. One is for properties located in officially designated flood plains on which a mortgage is held. Banks require the purchase of flood insurance for such properties on which they hold the mortgage. Another exception to the voluntary nature of this program is the fact that those who receive financial assistance from the federal government following a Presidential declaration of disaster may then be required to purchase flood insurance through NFIP.

Today’s market size is the total amount paid in premiums to the NFIP in 1990 and 2010 as well as the number of policies in force in those years.

Geographic reference: United States
Year: 1990 and 2010
Market size: $672.8 million from 2.48 million policies and $3,353.8 million on 5.65 million policies respectively
Source: “Statistics by Calendar Year,” data made available online here by FEMA.
Original source: U.S. Department of Homeland Secutiry, Federal Emergency Management Agency

Hydroelectric Power

The production of electricity with hydroelectric power plants represents 80% of all renewable electric power generation worldwide. Hydro plants work by using the flow of water to turn a turbine, which then turns a metal shaft in an electric generator, which is the motor that produces electricity. Hydroelectric power plants accounted for 15.97% of all electric power produced worldwide in 2008.

In the United States, 6% of electricity is generated in hydro plants, a relatively small percentage compared with other nations. The ability to use hydroelectric power plants to generate electricity is, of course, to a large extent a matter of having the resources needed to harness water’s power. Paraguay, for example, produces 100% of its electricity—as well as electricity enough to export—from hydroelectric power plants while Saudi Arabia has no hydroelectric power generation. A chart which shows the top twenty countries in the world based on their production of hydropower and based on the same source material is presented on the blog, LaMarotte, here.

Geographic reference: World
Year: 2008
Market size: 2,998 Billion Kilowatt hours
Source: “Table 1387. Net Electricity Generation by Type and Country: 2008,” Statistical Abstract of the United States: 2011, page 867, available online here.
Original source: U.S. Energy Information Administration (EIA)

Residential Septic Systems

For a brief change of pace, septic systems!

One fifth of all residential housing units in the United States are served by individual, onsite septic systems, including 22% of all housing units less than four years old. In 2007, 50% of all housing units served by such septic systems were in rural areas, 47% in suburban areas and 3% were in central cities according to the U.S. EPA.

Geographic reference: United States
Year: 1985 and 2007
Market size: Number of housing units respectively: 24.6 million and 26.1 million
Source: Septic Systems Fact Sheet, October 2008, available online here
Original source: United States Environmental Protection Agency, Office of Wastewater Management

Water Desalination Market

The energy it takes to remove the salt from water makes it a process that is hard to do economically except in areas where two things coexist, water shortages and abundant energy resources. Consequently, 65% of desalination plants around the world are in Africa and the Middle East. Plants located in the United States account for 11% of the world desalination market.

Geographic reference: World
Year: 2008
Market size: $8 billion
Source: “World Water Desalination,” July 2009
Original source: Freedonia Group

Packaged Ice Market

The annual wholesale market demand for packaged ice in the United States and Canada, including packaged ice resold through retail channels and packaged ice utilized in non-retail applications is shown below. In 2008, Home City and Arctic Glacier were investigated for price fixing, pleaded guilty and settled.

Geographic reference: North America
Year: 2007
Market size: $2.3 billion
Source: “In the United States District Court for the Eastern District of Michigan,” September 15, 2009 available online here.
Original source: Wild Law Group PLLC

World Water Treatment Products Market

The Earth has, and has always had, approximately 9.25 million trillion gallons of water, of which 97 percent is salt water. As world populations grow, the need to reuse water, and thus to treat it, will continue to grow.

Geographic reference: World
Year: 2008
Market size: $44.6 billion
Source: “World Treatment Products,” November 2009 available online here.