Pharmaceutical Packaging

bottles, pharmaceutical packaging
Plastic bottles had the highest revenue share in the primary packaging segment of the market.
Geographic reference: World
Year: 2019 and 2027
Market size: $98.58 billion and $188.79 billion, respectively

Today’s market size shows the total global revenues for pharmaceutical packaging in 2019 and projected for 2027 according to a report by Grand View Research. Demand for pharmaceutical packaging is expected to rise based on many factors: a growing pharmaceutical industry in China, India, and Brazil; rising demand for over-the-counter drugs; new drug discoveries; increased access to medicines as healthcare infrastructure improves in developing countries; an aging population; and a rise in the number of people with chronic diseases. 

Growth is also expected as demand rises for more convenient packaging types, such as pre-filled syringes and autoinjectors, and for sustainable packaging made of biodegradable and recycled materials. The growing use of biologics to treat illnesses will increase demand for specialized packaging. Biologics are manufactured using animal, human, or plant cells which tend to be heat sensitive and prone to contamination.

Increasing regulations and anti-counterfeit measures such as the Drug Supply Chain Security Act in the United States and the European Union’s Falsified Medicine Derivative have increased packaging costs as new infrastructure has to be developed to meet the requirements outlined in the laws.1 As costs go up, more pharmaceutical companies are outsourcing their packaging needs. Pharmaceutical contract packaging revenues totaled $28.2 billion in 2019 or 28.6% of the overall global pharmaceutical packaging market. This is expected to increase to $47.7 billion in 2027. Many small pharmaceutical companies without packaging capabilities have maintained relationships with contract packaging organizations and contract development and manufacturing organizations all along.

Primary packaging, the packaging that comes in direct contact with the product itself, held the highest revenue share in 2019, 75.16%, with plastic bottles having the highest share within this category. Oral drug delivery packaging and injectable packaging together accounted for more than three-quarters of all pharmaceutical packaging revenue. By end-use, most revenues came from pharmaceutical manufacturers, then retail pharmacies, contract packaging, institutional pharmacies, and others.

North America had the highest revenue share in 2019, 37.8%. The United States is the largest pharmaceutical market worldwide. It has a large healthcare system, the population has high per capita income, and it invests heavily in new drug development. Also, many large pharmaceutical companies such as Pfizer Inc., Johnson & Johnson, Merck & Co. Inc., Bristol-Myers Squibb Company, and AbbVie Inc. are located there. The Asia-Pacific region is expected to see the highest compound annual growth rate through 2027 with China, India, Japan, and South Korea being the largest markets. Economic growth along with population growth and increasing drug safety regulations are expected to increase product demand. While the global market is fragmented with several regional and local pharmaceutical packaging companies, some major companies in this industry include Amcor PLC; Gerresheimer AG; AptarGroup Inc.; Becton, Dickinson and Company; Schott AG; West Pharmaceutical Services Inc., Berry Global Inc.; WestRock Company; International Paper Company; Comar LLC; CCL Industries Inc.; and Vetter Pharma International.

1 Some product tracing and product identification regulations under the Drug Supply Chain Security Act were waived for certain COVID-19 medications. Source: “FDA Lifts Drug Supply Chain Security Requirements for COVID-19 Products,” Regulatory Focus, Regulatory Affairs Professionals Society, April 30, 2020 available online here.

Sources: “Pharmaceutical Packaging Market Size, Share & Trends Analysis Report by Material (Plastics & Polymers, Paper & Paperboard, Glass), by Product, by End Use, and Segment Forecasts, 2020 – 2027,” Grand View Research Report Summary, February 2020 available online here; “Pharmaceutical Packaging Market Size Worth $188.79 Billion by 2027: Grand View Research, Inc.,” CISION PR Newswire, February 11, 2020 available online here; “Pharmaceutical Contract Packaging Market Size, Share & Trends Analysis Report by Type (Primary, Secondary, Tertiary), by Material (Plastic & Polymer, Glass), by Region, and Segment Forecasts, 2020 – 2027,” Grand View Research Report Summary, August 2020 available online here; “Pharmaceutical Contract Packaging Market Size Worth $47.7 Billion by 2027: Grand View Research, Inc.,” CISION PR Newswire, August 26, 2020 available online here; “Pharmaceutical Packaging Market to Hit USD 142.59 Bn by 2027; Rising Demand for Efficient Packaging of Drugs by Healthcare Facilities to Boost Market Growth: Fortune Business Insights,” CISION PR Newswire, June 2020 available online here; “Pharmaceutical Packaging Market Size, Share & Industry Analysis, by Material (Plastics, Glass, Metal, Paper & Paperboard), by Product (Plastic Bottles, Caps & Closures, Pre-Fillable Inhalers, Vials & Ampoules), by Packaging Type (Primary, Secondary, and Tertiary), by Drug Delivery Mode (Oral Drug Delivery Packaging, Injectable Packaging, Topical Drug Delivery Packaging, Pulmonary Drug Delivery Packaging), and Regional Forecast, 2020-2027,” Fortune Business Insights Report Summary, June 2020 available online here; “Drug Supply Chain Security Act (DSCSA),” U.S. Food and Drug Administration, May 8, 2020 available online here; “Falsified Medicines,” Medicinal Products, European Commission, June 30, 2017 available online here; Michael Mezher, “FDA Lifts Drug Supply Chain Security Requirements for COVID-19 Products,” Regulatory Focus, Regulatory Affairs Professionals Society, April 30, 2020 available online here.
Image source: Bob Williams, “medicine-bottle-medical-health-2520463,” Pixabay, July 19, 2017 available online here.

Polypropylene

Polypropylene recycling symbolPolypropylene is a thermoplastic polymer made from propylene monomers and catalysts. It was first polymerized in 1951 by Philips petroleum scientists Paul Hogan and Robert Banks. In 1954 Italian chemist Giulio Natta perfected and synthesized the first polypropylene resin. By 1957 it was in widespread commercial production across Europe. Currently, it is one of the most commonly produced plastics in the world.

Because polypropylene can be combined with other polymers, the types of end uses can vary widely making it a versatile material with which to work. In 2016 global demand was 45 million metric tons, 30% of which was used in the packaging industry. Some other uses include automotive parts, furniture, dishwasher-safe plates, toys, carpets, upholstery, laboratory equipment and medical devices.

Today’s market size shows the estimated global sales of polypropylene in 2017 and projected for 2022. Polypropylene homopolymers are expected to be the fastest-growing type during this time period due to increasing demand in the automotive and medical industries, especially in the Asia Pacific region. The market for polypropylene is expected to grow the fastest in China, followed by India and South Korea from 2017 to 2022.

Geographic reference: World
Year: 2017 estimated and 2022 projected
Market size: $75.40 billion and $99.17 billion respectively
Sources: “The Polypropylene Market Size is Estimated at USD 75.40 Billion and Projected to Reach USD 99.17 Billion by 2022, at a CAGR of 5.6% Between 2017 and 2022,” CISION PR Newswire Press Release, February 1, 2018 available online here; “Everything You Need to Know About Polypropylene (PP) Plastic,” Creative Mechanisms, 2016 available online here; and “Polypropylene,” Wikipedia, April 23, 2018 available online here.
Image source: OpenIcons,”recycle-5-pp-recycling-plastic-98858,” Pixabay, April 1, 2013 available online here.

Canned Clams

U.S. canned clam production in 2010 is the market size today. The value per pound for canned clams in 2010 was just shy of one dollar ($0.89). As compared with the highest volume canned fish product, namely tuna, canned clams were 27.7% of tuna by weight and 13.5% by value.

Geographic reference: United States
Year: 2010
Market size: 109.3 million pounds at a value of $97.2 million
Source: “Fisheries of the United States–2010,” August 2011, page 42, available online from the National Marine Fisheries Service website, here.
Original source: National Oceanic and Atmospheric Administration (NOAA), Office of Science and Technology, National Marine Fisheries Service, USDA
Posted on October 25, 2012

Paper Clips

Paper Clip

Many attempts have been made over the years to improve upon the design of the paper clip. So far it has proven very difficult to design something that works better and can be made more economically than the ubiquitous twist of wire we know as the standard paper clip.

It may come as a surprise to many to find out that most paper clips sold in the United States are still also made in the United States. Import tariffs, which have been in place on paper clips since 1994, have helped to keep a robust domestic manufacturing business alive and well bucking the trend towards off-shoring so prominent since the late 1990s.

The number of paper clips sold in the United States annually is high and makes one wonder, what do we do with all those paper clips, particularly in the “paperless society”? According to the source and a quick survey of our offices, here’s a list of uses, other than holding papers together, to which we put paper clips: hanging Christmas ornaments; restarting electronic devices that have tiny little restart buttons; cleaning our fingernails/ears (with apologies); linking them into a chain while chatting on the phone, and temporarily holding up a ripped hem.

Today’s market size is an industry estimate of the number of paper clips sold annually in the United States.

Geographic reference: United States
Year: 2010
Market size: 11 billion clips
Source: James R. Hagerty, “Mousetraps, Maybe, but Can You Build a Better Paper Clip?” The Wall Street Journal, online edition of August 29, 2011, available here.
Posted on September 7, 2011

Packaging Machinery

Packaging Machinery Industry Shipments

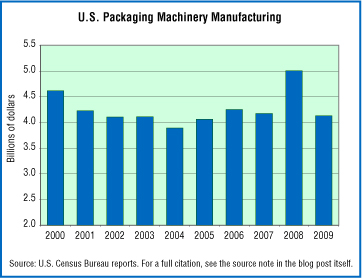
Most products sold are packaged for shipping and additionally, for items sold through retail outlets, for presentation within a retail setting. All that packaging uses a lot of material and sophisticated machinery is used to actually do the packaging. The machines used to do the packaging—be that bottling, canning, labeling or wrapping—are what we look at in today’s market size post.

Today’s market size is the value of all shipments by U.S. manufacturers of packaging machinery in 2009. The graphic presents data on this industry’s shipments over the past decade and shows a pattern that bucks the trend seen in most U.S. manufacturing industries.

Geographic reference: United States
Year: 2009
Market size: $4.13 billion
Source: “Sector 31: Annual Survey of Manufactures: General Statistics: Statistics for Industry Groups and Industries: 2009 and 2008,” 2009 Annual Survey of Manufactures, NAICS Industry 333993, data released on December 3, 2010, available online here. Data used to produce the graph come from a series of Census Bureau reports that have been combined with other industry data and presented with a long historical perspective in a work edited by Joyce P. Simkin titled Manufacturing & Distribution USA, Sixth Edition, published by Gale—Cengage Learning in 2011, Volume 2, page 1115.
Original source: U.S. Bureau of the Census

Wood Containers & Pallets

The economy may be on the mend, slowly, but the severity of the recession that officially began in December 2007 and the specific areas that it hit hardest can now be studied in detail. Economic census data for 2009 are available from the U.S. Census Bureau, an agency whose work is too often undervalued and its value underestimated. Without a clear picture of what is truly going on in the economy, good decisions are hard to make.

We tip our hats to the U.S. Census Bureau and to all the federal agencies dedicated to the collection and compilation of statistical data.

Today’s market size item is based on the value of product shipments made by manufacturers of wood containers and wood pallets.

Geographic reference: United States
Year: 2008 and 2009
Market size: $6.89 and 5.51 billion respectively
Source: “Sector 31: Annual Survey of Manufactures: Value of Products Shipments: Value of Shipments for Product Classes: 2009 and 2008,” 2009 Annual Survey of Manufactures, December 3, 2010, available online here.
Original source: U.S. Census Bureau, Department of Commerce

Market for Cork Wine Bottle Closures

There are 600 natural cork makers worldwide, the largest of these is Amorim Group. The two largest cork producing countries are Portugal and Spain which together account for approximately 55% of cork production. While alternative materials are increasingly used in wine bottle closures, cork still represents 80% of the market.

Geographic reference: World
Year: 2009
Market size: 13 billion corks
Source: Wall Street Journal, May 1, 2010, page A10
Original source: Nomacorc estimates