Catastrophe Bonds

hurricane catastrophe

Catastrophe bonds, first issued in 1997, are a way for insurance companies to raise money to pay customer claims in the event of a catastrophic natural disaster. The insurance company issues bonds through an investment bank. The investment bank serves as a liaison between the insurance company and the investors, which are typically hedge funds, mutual funds, and pension funds. The investment bank invests the proceeds from the sale of the bonds and pays interest to the investors. It also dispenses the proceeds from the bond sales back to the issuer when a predefined disaster risk happens. The disaster risk could be the issuer’s actual losses, the issuer’s losses based on disaster parameters input into modeling software or the industry’s losses beyond a defined threshold. It can also be a specific condition linked to a natural disaster, such as an earthquake of magnitude 7.0 on the Richter scale.

Although investors risk losing their principal investment, some investors feel that the risk is worth it for the high yields and diversified portfolio of assets. Catastrophe bonds are not correlated with other financial markets. Since the financial crisis of 2008, and the collapse of Lehman Brothers, investment banks have been investing catastrophe bond collateral in Treasury money market funds, seen as safer than the investments in financial instruments made prior to the collapse.

Insurance and reinsurance companies make up 85% of the issuers of catastrophe bonds. The other 15% of issuers are states. California and Florida have the two largest catastrophe funds. These catastrophe funds were put in place to ensure that the insurance structure in the states continues to function after a major disaster. After 1992’s Hurricane Andrew and 1994’s Northridge earthquake, insurance companies, required by law to cover losses from natural disasters, paid out considerably more than they took in premiums. As a result, they either reduced coverage or left the state entirely. The California Earthquake Authority began issuing earthquake insurance on its own rather than requiring insurance companies to do so. The Florida Hurricane Catastrophe Fund reimburses private insurers for losses due to coverage of hurricane damage. Both issue catastrophe bonds to reduce the risk to state funds.

Today’s market size shows the total value of catastrophe bonds in the United States as of the first half of 2018. From 2010 to 2017 the amount in outstanding catastrophe bonds doubled and despite the historically high losses due to Hurricanes Irma, Harvey, and Maria in the first half of 2018, the catastrophe market continued to grow. In the future, catastrophe bonds may cover more than losses from natural disasters. Insurance companies are currently developing better catastrophe bond modeling to cover losses due to cyber attacks and terrorism.

Geographic reference: United States
Year: First half of 2018
Market size: $30 billion
Sources: Oliver Ralph, “Global Catastrophe Bond Market Size Climbs to a Record $30bn,” Financial Times, September 6, 2018 available online here; Andy Polacek, “Catastrophe Bonds: A Primer and Retrospective,” Chicago Fed Letter, No. 405, 2018 available online here; “Catastrophe Bond,” Wikipedia, December 10, 2018 available online here.
Image source: 12019, “hurricane-earth-satellite-tracking-92968,” Pixabay, March 13, 2013 available online here.

Extended Warranties

broken smartphoneDid you buy a new TV to watch March Madness? Purchase the latest mobile phone or tablet? Have you bought a new home? If you have, you were probably offered an extended warranty on your purchases.
Today’s market size shows the total amount of premiums consumers paid for extended warranties in 2017. These premiums fall into 8 categories: vehicle service contracts, mobile phone insurance, consumer electronics service contracts, computer OEM service contracts, jewelry protection plans, home warranties, appliance protection plans, and furniture protection plans. How purchases are categorized depends on who sold the extended warranty and not on the item itself. For example, if an iPhone protection plan was sold by Apple, the plan will be considered a computer OEM service contract. If the plan was sold by a retailer, it falls into the consumer electronics protection plan category. If the plan was sold by a wireless phone carrier, then it’s considered mobile phone insurance.

Overall, the amount of premiums paid from 2016 to 2017 declined by $250 million. Vehicle service contract premiums, which brought in $16.7 billion in 2017, declined the most during this time period, down $300 million, followed by plans covering brown and white goods and mobile phone insurance plans. Home warranty premiums grew by $340 million from 2016 to 2017, a 16% increase. Total jewelry service plan premiums and furniture protection plan premiums also grew during this time period, by 2% and 3% respectively.

Geographic reference: United States
Year: 2017
Market size: $44.7 billion
Source: “Service Contract Market Size,” Warranty Week, February 1, 2018 available online here.
Image source: Glavo, “smartphone-mobile-phone-phone-2971080,” Pixabay, November 7, 2017 available online here.

Catastrophe Bonds

Catastrophe bonds, or cat bonds, are bonds sold by an entity wishing to reduce its liability in the face of catastrophic losses such as the ones being caused by the seemingly increasingly violent natural storms occurring around the world. The market for cat bonds has been strong and growing as both the need for risk mitigation has risen as have the number of large investors searching for lucrative investment opportunities in an era of low interest rates.

An example of a cat bond is one issued by New York City’s transit authority in the aftermath of Superstorm Sandy. When insurance carriers, reeling from the costs associated with that storm, hesitated to underwrite the risk of future water surges, the transit authority issued a catastrophe bond in the amount of $200 million. The money will be used to repair damage to the subway system in the event of another flooding storm that reaches the same levels as Sandy within the next three years. If there is no serious storm within that period of time, the money will be returned to investors with an interest payment that—in 2012 for cat bonds—was running at 11% over the rate for Treasury Bills.

Today’s market size is the total value of catastrophe bonds outstanding as of October 1, 2013, worldwide.

Geographic reference: World
Year: 2013
Market size: $19 billion (up from $4 billion a decade ago)
Source: “Perilous Paper,” The Economist, October 5, 2013, pages 76-77.
Original source: Swiss Re Capital Markets
Posted on November 20, 2013

Pharmacy Benefit Managers

The cost of prescription drugs in the United States is a subject about which there is much controversy. As the Affordable Care Act—or, Obamacare—gets off to a rocky start across the nation, we decided to look at just one small part of the prescription drug distribution network, about which most people are not particularly conscious. That is the segment made up of Pharmacy Benefit Managers (PBMs), middlemen who stand in a central position in the prescription drug supply chain and who, it turns out, have carved out for themselves a rather lucrative business. The three largest PBMs—Express Scripts, CVS Caremark, and OptumRx—together control about 70% of all prescriptions filled in the United States.

PBMs are firms that provide an administrative service to insurance companies, large self-insured employers, and government benefit providers. They develop and maintain drug formularies—lists of specific drugs to be covered and the prices for each—for their insurance providing customers. They also negotiate with pharmaceutical companies for preferred pricing on the drugs covered in those formularies and they negotiate with retailers to accept those terms and participate in the PBM’s network of preferred pharmacies.

According to an article in Fortune magazine, “PBMs started as paper pushers: They began hand-processing medical claims in the 1970s and evolved into middlemen who touted their ability to use corporate customers’ combined purchasing power to negotiate huge discounts from pharmaceutical companies. Today the top PBMs are as big as or bigger than their clients.” The United States has a unique health care delivery system, one which is significantly fuller of lucrative middleman-businesses than the systems present in other industrialized nations.

Today’s market size is the total estimated revenue earned by Pharmacy Benefit Managers in the United States in 2012.

Geographic reference: United States
Year: 2012
Market size: $250 billion
Source: Katherine Eban, “Painful Prescription,” Fortune, October 28, 2013, pages 202-207.
Original source: J.P. Morgan analysts
Posted on November 4, 2013

Insurance Industry

Insurance carriers and those involved with selling and managing insurance policies have seen a slow recovery since the recession. Over the period 2007 to 2012, industry revenue did not keep up with the rate of inflation, growing 4.2% over the period. In the earlier part of the decade, from 2002 to 2007, it grew 21%, exceeding inflation by 6%.

The industry presented here [NAICS 524] is defined by the U.S. Census Bureau as “all establishments that are primarily engaged in one of the following: (1) underwriting (assuming the risk, assigning premiums, and so forth) annuities and insurance policies or (2) facilitating such underwriting by selling insurance policies, and by providing other insurance and employee-benefit related services.” Companies falling into the second part of the above definition account for slightly less than 10% of industry revenues.

Today’s market size is the size of the insurance industry in the United States based on its revenues in the years 2002, 2007 and 2012.

Geographic reference: United States
Year: 2002, 2007 and 2012
Market size: $1.38, $1.67 and $1.74 trillion dollars respectively
Source: “Table 9 – Finance and Insurance (NAICS 52) Estimated Quarterly Revenue for Employer Firms Third Quarter 2009 Through Fourth Quarter 2012,” from a series of reports made available by the U.S. Census Bureau at their website, Annual & Quarterly Services, available here. The data for 2002 and 2007 are from “Finance and Insurance: Geographic Area Series: Comparative Statistics for the United States (2002 NAICS Basis): 2007 and 2002,” 2007 Economic Census, available here.
Original source: U.S. Bureau of the Census
Posted on September 5, 2013

High-Deductible Health Insurance Plans

High-deductible health insurance plans are insurance policies in which consumers pay lower monthly premiums but incur higher out-of-pocket costs when visiting doctors and hospitals. In the past decade, high-deductible health plans have become more common. Some believe that these insurance policies will reduce overall health spending, especially on discretionary services, and thereby keep premiums affordable. But some studies show that while trips to the emergency room are reduced, especially for minor ailments, many consumers are also forgoing getting treatment for more serious conditions such as kidney stones or heart trouble. And, when treatment is sought, the cost of treatment is higher due to the increased severity of the illness.

Today’s market size is the number of consumers in the United States with high-deductible health insurance plans as of early 2013, a three-fold increase since 2006.

Geographic reference: United States
Year: 2013
Market size: 13.5 million
Source: Ashley Griffin, “Men Put Off Health Care When It Costs More,” Lansing State Journal, July 21, 2013, pages 1C, 4C
Posted on August 2, 2013

Crop Insurance

The drought being experienced this year in most of the United States will have an impact on the cost of food in the not distant future. Farmers will have a difficult year, but how difficult? As it turns out, less than one might expect. Over the last decades there has been a significant increase in the use of crop insurance in the United States and an escalation of the subsidies received from the federal government to cover crop insurance premiums. In 2011, the federal government picked up 60% of crop insurance premiums. In fact, crop and revenue insurance now represents the primary federal support for farm income, paying $5.2 billion in direct payments to farmers and $7.4 billion in insurance premium subsidies.

Today’s market size post lists the number of acres of farmland covered by crop insurance in 1981 and 2011 as well as the total insured liability each year. The level of government subsidies for crop insurance has risen quite substantially over this period. Total premiums paid for crop insurance in 2011 were approximately $12.3 billion, of which the federal government picked up 60%, or $7.4 billion.

Our hope is that all those impacted by this drought are spared serious damage and that starvation in distant places of this ever more connected world does not rise as a result of crop shortfalls in the United States.

Geographic reference: United States
Year: 1981 and 2011
Market size: Acres: 45 million and 262 million respectively
Market size: Insured liability: $6 billion and $113 billion respectively
Source: Keith Collins and Harum Bulut, “Crop Insurance and the Future Farm Safety Net,” February 10, 2012, available online here and Andrew G. Simpson, “Cap on Subsidy of Crop Insurance Premium Would Save $1 Billion: GAO,” April 13, 2012, available online here.
Original source: FarmDocDaily, Insurance Journal, U.S. Department of Agriculture, and the U.S. Government Accounting Office.
Posted on August 1, 2012

Medicare Enrollment

Medicare Enrollment Stats

Today is the 70th anniversary of the attack on Pearl Harbor. Today is also the final day of the Medicare annual enrollment period. Only one of these topics lends itself to a market size post. Worth noting—and by way of tying these two things together a little—is the fact that anyone (now an American citizen) who was around on the day that Pearl Harbor was attacked, is now eligible for Medicare.

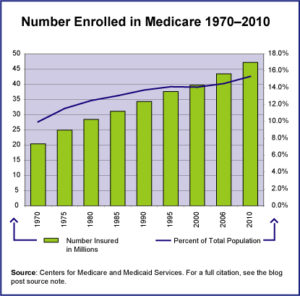
Today’s market size is the number of people enrolled in the Medicare health insurance system in the United States in 2010. The graphic provides data on enrollment from 1970 to 2010 and shows how this population relates to the total U.S. population over this period.

Geographic reference: United States
Year: 2010
Market size: 47.2 million
Source: “Table I.1 Medicare Enrollment Trends,” part of the statistical offerings on the Federal Government’s CMS website here.
Original source: Center for Medicare and Medicaid Services, U.S. Department of Human Health and Services
Posted on November 7, 2011

Derivatives

Congressional attempts to regulate the market for derivatives is bringing this market into the news again. Until the financial crash of 2008 the derivatives market was well below the radar of most people. As the financial crisis unfolded we learned how the market for derivatives had been taken over by financial speculators and financial institutions using them in… innovative ways, turning them into something quite different from what they had been for more than a century.

In a perfect world, derivatives—an agreement between two parties about an exchange in which the price of the item being exchanged is derived from the value of an underlying asset—are used, for example, by a manufacturer to lock in the otherwise widely fluctuating price of a commodity that it buys regularly. When used this way, derivatives are a sort of insurance against volatility, a so-called hedge against risk. Things get more complicated when this sort of insurance is purchased by somebody that doesn’t actually own the insured asset and that is where we enter the world of speculation which has become a large part of the derivatives market during the last two decades.

Geographic reference: World
Year: 2010
Market size: $600 trillion
Source: Aaron M. Kessler, “Carmakers Fear Restrictions of Wall Street Reform,” September 22, 2011, Detroit Free Press, page B1.
Posted on September 22, 2011

High-Deductible Health Insurance Plans

High-deductible health insurance plans have lower premiums than traditional coverage but the insured pays quite a bit more out-of-pocket before any coverage starts. If the deductibles in such plans are at least $1,200 for individuals and $2,400 for families, the plans can be paired with Health Savings Accounts (HSAs). HSAs allow employees to deposit pre-tax income to pay for medical expenses. In many cases, employers also contribute to their employees’ HSAs.

Today’s market size shows enrollment for high-deductible health insurance plans with health savings accounts as of January of that year. In 2011, this represented 7% of all health insurance enrollment for people younger than 65.

Geographic reference: United States
Year: 2008 and 2011
Market size: 6.1 million and 11.4 million respectively
Source: Tom Murphy, “More Are Enrolling in High-Deductible Plans,” Lansing State Journal, June 19, 2011, page 3E
Original source: America’s Health Insurance Plans

Extended Warranties

An extended warranty is something offered to consumers by retailers either as a service the retailer offers or on behalf of the manufacturer. These extended warranties vary greatly in terms of what they cover and duration. Today’s market size is an estimate of the number of such warranties sold annually in the United States.

Geographic reference: United States
Year: 2010
Market size: 250 million warranties annually
Source: Newman, Andrew Adams,”Old-Time Torture Tests Resurface on YouTube, and Tablets Take a Licking,” The New York Times, page B6, June 10, 2011, available online here.

National Flood Insurance Program

With flood waters inundating so many in the Mississippi River Valley and with spillways being opened to try and mitigate the damage further downstream, we turn today to the size of the United State’s National Flood Insurance Program (NFIP), run by the Federal Emergency Management Agency (FEMA). The program was designed to provide a shared pool of resources that could help to reduce the high cost of disaster assistance resulting from flooding along the national waterways.

NFIP is not only an insurance program but a floodplain management and mapping program. Participation in NFIP is voluntary at the community level, with a couple of exceptions. One is for properties located in officially designated flood plains on which a mortgage is held. Banks require the purchase of flood insurance for such properties on which they hold the mortgage. Another exception to the voluntary nature of this program is the fact that those who receive financial assistance from the federal government following a Presidential declaration of disaster may then be required to purchase flood insurance through NFIP.

Today’s market size is the total amount paid in premiums to the NFIP in 1990 and 2010 as well as the number of policies in force in those years.

Geographic reference: United States
Year: 1990 and 2010
Market size: $672.8 million from 2.48 million policies and $3,353.8 million on 5.65 million policies respectively
Source: “Statistics by Calendar Year,” data made available online here by FEMA.
Original source: U.S. Department of Homeland Secutiry, Federal Emergency Management Agency

Pet Health Care Insurance

The leading supplier of pet health care in the United States is Veterinary Pet Insurance (VPI). This company has been offering pet health insurance for more than twenty years and was joined about six years ago by a small number of new entrants into this market.

Geographic reference: United States
Year: 2007
Market size: $210 million
Source: “Tupanion Executive Summary,” 2009
Original source: Packaged Facts and Tupanion company report