Training Doctors

The education and training of a doctor is a long and costly endeavor. First comes the classroom education, the cost of which is picked up, for the most part for those not fortunate enough to get a scholarship, by the future doctor him or herself. Then comes a final on-the-job training period in which doctors with new diplomas spend four or more years working in a residency program.

During this residency, doctors in training see and treat patients under the supervision of more seasoned physicians. Most of these residency programs are carried out in teaching hospitals, which account for approximately 20% of the nation’s hospitals. Residency programs are arduous. Residents are expected to routinely work 80 hours a week and they are paid half or far less of what they will receive for much the same work after the residency. This training is expensive for the system as a whole and has been, for all practical purposes, nationalized.

The U.S. federal government pays for most of this training with money from the Medicare and Medicaid systems. Our market size today is the money spent by the federal government annually to support this graduate medical education.

Geographic reference: United States
Year: 2012
Market size: $11.5 billion of U.S. government funds are used to support residency slots in training hospitals, approximately 115,000 in 2012
Source: Catherine Dower, “Graduate Medical Education,” a health policy brief published in Health Affairs, on August 31, 2012 and available online here.
Original source: U.S. Department of Health and Human Services, Center for Medicare and Medicaid Services
Posted on January 22, 2014

Hospitals in the United States

Hospitals2

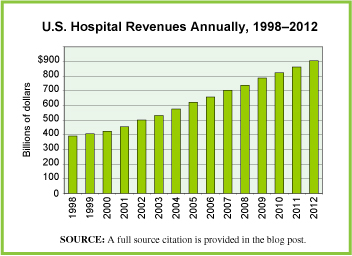
Today we update an earlier post on a part of the huge health services industry, namely, hospitals. The graph shows the total annual revenues of all U.S. hospitals as they are defined by the Census Bureau, below, over a fifteen year period. Annual revenues for this industry appear to rise, regardless of economic conditions, recessions, financial crisis, or business cycles.

This industry is identified within the industry coding system, NAICS, with the code 622 and is defined by the Census Bureau as including hospitals whose primary business is to “provide medical, diagnostic, and treatment services that include physician, nursing, and other health services to inpatients and the specialized accommodation services required by inpatients. Hospitals may also provide outpatient services as a secondary activity. Establishments in the Hospitals subsector provide inpatient health services, many of which can only be provided using the specialized facilities and equipment that form a significant and integral part of the production process.”

Geographic reference: United States
Year: 2005 and 2012
Market size: $620.85 billion and $904.47 billion respectively
Source: “Table 1 – Selected Services, Estimated Quarterly Revenue for Employer Firms,” Annual Benchmark Report for Services through 2012, a series of reports put out by the Census Bureau in conjunction with their Service Annual Survey, published every non-Economic Census year. The Service Annual Survey reports are accessible on the Census web site here.
Original source: U.S. Department of Commerce, Economics and Statistics Administration, U.S. Census Bureau
Posted on July 10, 2013

Hospitals

Most of us are well aware of the rising costs of health care. It will not come as a surprise to see that revenues for hospitals in the United States have seen steady increases year-over-year, despite recessions, slowdowns, housing bubbles, financial melt-downs, or any other events that disrupt the economy. This is not to suggest that individual hospitals may not have struggled during our most recent recession, however, as a whole, the hospital industry has seen nothing but rising revenues for well over a decade.

Today’s market size is the revenue earned by hospitals in the United States in 2005 and 2010. Revenues increased over this period by 30.4%, more than twice the rate of inflation during over the same period which was 12.8%. To your health!

Geographic reference: United States
Year: 2005 and 2010
Market size: $620.85 billion and $809.47 billion respectively
Source:  “Table 1 – Selected Services, Estimated Quarterly Revenue for Employer Firms,” Annual Benchmark Report for Services through 2010, page 9, a series of reports put out by the Census Bureau in conjunction with their Service Annual Survey, published every non-Economic Census year. The table from which today’s market size is taken is available online here.
Original source: U.S. Department of Commerce, Economics and Statistics Administration, U.S. Census Bureau
Posted on September 20, 2011