Back-to-College Spending

According to the National Center for Education Statistics fall college enrollment in 2010 was 21.0 million. Enrollment declined to 20.2 million in 2014 but is projected to increase to 20.9 million in 2017. Today’s market size shows the total amount spent on back-to-college items by students and their families in 2010, 2014 and 2017. The figure for 2017 is projected. In 2017, back-to-college shoppers plan on spending the most on electronics ($12.8 billion), followed by clothing ($8.0 billion) and snacks and other food items ($7.5 billion). Spending on dorm and apartment furnishings came in fourth at $5.9 billion. Spending on school supplies ranked seventh at $3.9 billion.

Geographic reference: United States
Year: 2010, 2014 and 2017 projected
Market size: $45.88 billion, $48.48 billion and $54.18 billion respectively
Sources: Smith, Ana Serafin, “Back-to-School and Back-to-College Spending to Reach $83.6 Billion,” National Retail Federation Press Release, July 13, 2017 available online here; U.S. Department of Education, National Center for Education Statistics, “Table 303.10. Total Fall Enrollment in Degree-Granting Postsecondary Institutions, by Attendance Status, Sex of Student, and Control of Institution: Selected Years, 1947 through 2025,” Digest of Education Statistics: 2015, December 2016 available online here.
Original source: Prosper Insights & Analytics

Luxury Massage Chairs

InadaMessageChair

The term “stress” is heard frequently these days and is often associated with a long list of both mental and physical ailments. There are also many industries that offer to sell stress relieving aids, from consumables like specially formulated juices and deep penetrating lotions to gym memberships and spa resort getaways. Massage has long been a way to relax, to reduce stress. So the idea of a chair that will massage your entire body whenever you want has a natural appeal for those looking for ways to relieve or reduce stress.

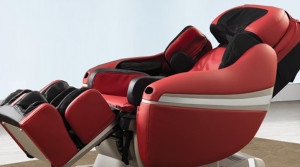
Today’s market size is the approximate value of the luxury massage chair market in the United States in 2012, based on estimates from one of the industry’s leaders. This market size refers to fully automated massage chairs and not chairs used by masseurs/masseuses, also called massage chairs. Luxury massage chairs are a high-end product often costing several thousand dollars. Nonetheless, the luxury massage chair industry is a tiny part of the overall group of industries whose products and services are aimed at stress reduction.

Geographic reference: United States
Year: 2012
Market size: $250 million
Source: Bruce Horovitz, “All Stressed Out? Business Will Sell You Some Peace,” USA Today, August 5, 2013, available here. The photo is from the Inada web site here.
Original source: Inada
Posted on September 6, 2013

The Sleep Business

In 2012, approximately three-fourths of internet users searched online for health information. Half of them searched specifically for sleep remedies. According to the National Sleep Foundation, only 56% of Americans report getting a “good night’s sleep” on a typical night. Some sleep studies have found a link between insufficient sleep and hypertension, depression, diabetes, and other illnesses. Spending related to sleep has increased 8.8% yearly since 2008. Spending on over-the-counter sleep aids increased 31% from 2006 to 2011, with the biggest increase being spending on natural and homeopathic products.

Today’s market size is the estimated amount spent in the United States, in 2012, on things designed to aid sleep, from pills and medical devices to sleep consultants who work with hospitals and deluxe mattresses made with tension-relieving foams.

Wishing all our readers a sound night’s sleep!

Geographic reference: United States
Year: 2012
Market size: $32 billion
Source: Kit Yarrow, “The Sleep Industry: Why We’re Paying Big Bucks for Something That’s Free,” Time, January 28, 2013, available online here.
Posted on March 1, 2013

Furniture Stores

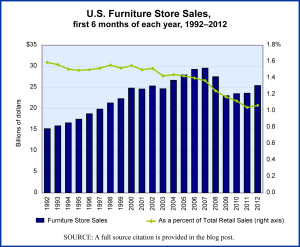
Furniture Stores sales, annually, graphed

The sale of furniture—through furniture stores—in the United States has begun to recover from the significant hit it took as a result of the housing bubble collapse and the recession of 2007–2009. The graph we present here shows sales receipts for all furniture stores in the United States during the first six months of each year from 1992 through this year. The NAICS code (North American Industrial Classification System code) for furniture stores as measured here is 4421.

Geographic reference: United States
Year: 2007 and 2012 (first 6 months)
Market size: $29.6 billion and $25.4 billion respectively
Source: Annual Retail Trade Survey 2010, and updates from the Monthly Retail Trade Reports from the same reporting series, U.S. Census Bureau, available online here.
Original source: U.S. Department of Commerce, Bureau of the Census
Posted on August 17, 2012

Folding Furniture

Today’s market size is the value of retail sales of folding furnture—tables and chairs— in the United States in 2009. Leading manufacturers of this sort of furniture include Cosco and Lifetime.

Geographic reference: United States
Year: 2009
Market size: $395 million
Source: Dorel Investor Day, June 2, 1010, page 49, available online here.
Original source: Dorel Asia

Online Sale of Furniture

Today we will present the first in a series of market sizes based on the online sale of a particular line of merchandise. The online sale of furniture is our market for today.

Geographic reference: United States
Year: 2003 and 2008
Market size: Sales: $3.1 and $9.8 billion respectively, representing a 217% increase over five years.
Source: “Table 1055. Electronic Shopping and Mail-Order Houses—Total and E-Commerce Sales by Merchandise Line,” Statistical Abstract of the United States: 2011, U.S. Census Bureau, page 663, available online here in a spreadsheet format, and here as a PDF file.
One word of clarification to help prevent any confusion about just what is being presented here. The data in the source table are provided in two columns per year, the first one called “Total,” and the second is “E-Commerce”. The column headed “Total” refers to the total sales for the industry “Electronic Shopping and Mail-Order Houses,” [NAICS 4541], and the second column is the e-commerce portion of that industry’s total. Do not confuse the “Total” column for a measure of total sales of the product line listed in that row. It is, rather, the total sales of that product line made electronically and through mail-order houses.
Original source: U.S. Department of Commerce, Bureau of the Census.

Furniture Stores

The furniture industry is one that has been experiencing a significant shift in how it gets product to market. Wholesaling is declining as a segment of the overall distribution of furniture in the United States. Retailers have also declined slightly in numbers but their sales have risen as has the number of people employed by furniture stores. This shows that there has been some consolidation of furniture stores. Worth noting is the fact that furniture sales benefitted from the housing boom, which ended in December 2007 when the recession began. Effects of the recession are not visible in these data. The market size data presented here is for all furniture retailers which are covered as a group in the U.S. Census Bureau designated industry, NAICS 442 [Furniture and Home Furnishing Stores].

Geographic reference: United States
Year: 1997 and 2007
Market size: Number of Establishments: 64,725 and 64,590 respectively.
Market size: Sales: $71.7 and $107.8 billion respectively.
Source: “Preliminary Comparative Statistics for the U.S. (2002 NAICS): 2007 and 2002,” 2007 Economic Census, available online here. The data from 1997 are from the 1997 Economic Census.
Original source: U.S. Department of Commerce, Bureau of the Census.

Furniture Wholesalers

The furniture industry is one that has been experiencing a significant shift in how it gets product to market. The role of the wholesaler in the distribution of furniture in the United States is declining as large retailers go directly to manufacturers and manufacturers set up their own direct sales outlets. The market size data presented here are for all furniture wholesalers and include the two industries designated by the U.S. Census Bureau with NAICS codes 42-3210 [Furniture Merchant Wholesalers] and 42-3220 [Home Furnishing Merchant Wholesalers].

Tomorrow we will look at furniture retailers.

Geographic reference: United States
Year: 1997 and 2007
Market size: Number of Establishments: 15,246 and 14,433 respectively.
Market size: Sales: $75.01 and $91.25 billion respectively (error in original post corrected on Feb. 7, 2011).
Source: “Sector 42: EC0742I2: Wholesale Trade: Industry Series: Preliminary Comparative Statistics for the United States (2002 NAICS Basis): 2007 and 2002,” 2007 Economic Census, available online here. The data from 1997 are from the 1997 Economic Census.
Original source: U.S. Department of Commerce, Bureau of the Census.

Metal Household Furniture Market

This market covers both furniture for the interior and exterior of the home as well as furniture sold assembled and that sold ready-to-assemble.

Geographic reference: United States
Year: 2008
Market size: $2.26 billion
Source: Annual Survey of Manufactures, 2008, March 30, 2010 available online here.
Original source: U.S. Bureau of the Census

Outdoor Furniture and Grill Market

This market, as defined by the source, can be broken down into the following four categories: outdoor furniture (with 57% of the market), grills (20%), accessories (19%) and patio heating products (4%). The market is forecast by the source to reach $7.2 billion in 2013.

Geographic reference: United States
Year: 2008
Market size: $6.12 billion
Source: Outdoor Furniture and Grills, December 2009
Original source: Freedonia Group