Firearms in the United States

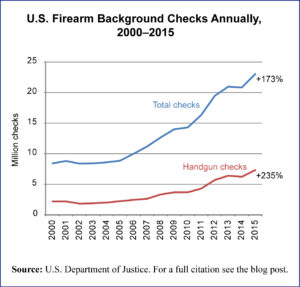
Firearms2Today’s market size is the rising number of firearm background checks being seen annually in the United States. As can be seen in the graph to the right, the number of background checks have been on the climb annually since the turn of the century and have been climbing at a faster pace since 2005. In terms of checks by type of gun to be purchased, checks associated with handguns have risen at a slightly faster rate than checks for other types of firearms.

The number of background checks is not the same as the number of firearm purchases since not every background check is followed by a purchase and some background checks are followed by the purchase of multiple guns. Furthermore, an average of one percent of background checks results in a denial of eligibility to purchase a firearm. Nonetheless, the NICS firearm background check system statistics are one of the most accurate means of tracking gun sales at the national level in the United States.

Geographic reference: United States
Year: 2015
Market size: 23.03 million checks
Source: “Firearm Commerce in the United States, Annual Statistical Update, 2015,” U.S. Bureau of Alcohol, Tobacco, Firearms and Explosives, available online here. For an explanation of the NICS program, see the FBI website here.
Original source: U.S. Department of Justice.

Guns

U.S. Manufacturer Shipments, 1982-2011

A tragic mass shooting at the end of 2012 has brought on another round of debates in the United States about whether there should be—and if so what sort of—limits on the private ownership of guns. The United States has the most well-armed population in the world, by far. There are an estimated 0.88 firearms per person in the United States. The country with the next greatest number of firearms per capita is Yemen, with 0.55. Guns are big business in the United States.

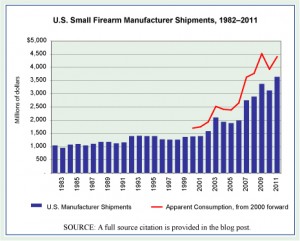
Today’s market size is the 2011 value of shipments by U.S. small firearms manufacturers, those engaged primarily in making small arms that are carried and fired by individuals [NAICS 33-2994]. Thus, these are not the manufacturers of large, military weaponry but rather the makers of guns sold to individuals.

The U.S. gun manufacturing business has been growing rapidly over the last decade, rising 163% between 2001 and 2011. The graph we present here shows manufacturer shipment data for each year from 1982 through 2011. The red line on the graph shows the apparent consumption of small firearms starting in 2000. Apparent consumption is the wholesale value of manufacturing, less the value of exports, plus the value of imports.

Geographic reference: United States
Year: 2011
Market size: $3.634 billion [the value of product shipments was $3.246 billion, thus excluding any revenue from other services or leases provided by small firearm manufacturers]
Source: Arsen J. Darnay, Editor, Manufacturing and Distribution USA, “NAICS 332994 – Small Arms Manufacturing,” Gale Group, 2000, page 1984. Joyce P. Simkin, Editor, Manufacturing and Distribution USA, Seventh Edition, “NAICS 332994 – Small Arms Manufacturing,” Gale Cengage Learning, 2013, page 930. Data for 2010 and 2011 are from the most recent Annual Survey of Manufacturers, report published by the U.S. Census Bureau and available online here. Finally, the per capita data cited above come from: Simon Rogers, “Gun Homicides and Gun Ownership Listed by Country,” posted on July 22, 2012, on The Guardian website here.
Original source: U.S. Department of Commerce, Bureau of the Census, U.S. Department of Commerce, International Trade Administration (ITA) and the United Nations Office on Drugs and Crime (UNODC)
Posted on January 29, 2013