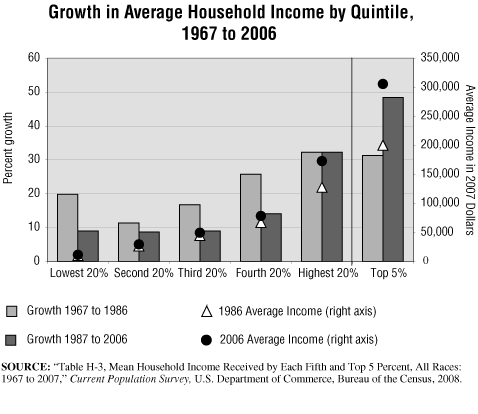
In this graphic, we display growth in household income divided into two periods of equal length: 1967 to 1986 and 1987 to 2006. Results for five population segments of the U.S. are shown as well as the top 5 percent of households, which are included in the highest quintile category.
In the early part of this 40-year period, the income of the lowest fifth of households grew at a rate of almost 20 percent, greater than that of the second and third quintiles but lower than the growth experienced for the richest quintiles of the population. In the second half of the period, the lowest fifth saw income growth shy of 10 percent and the top fifth income growth of 32.2 percent with the richest 5 percent seeing their incomes grow by nearly fifty percent (48.4%).
In the early period, policies of income distribution clearly favored the lowest reaches of society far more than did the policies followed in the second period charted. The poorest quintile of households saw their incomes grow 19.9 percent during the period 1967 to 1986 but the growth rate dropped by more than half (to 9%) for the period 1987 to 2006. In both of these periods, the “working poor” which may be represented by the second fifth of households, saw the slowest growth rates. The middle class—third and fourth quintiles—didn’t fare well either, in terms of maintaining their income growth rates. In the first time period charted, the middle class saw income growth rates of 17 to 26 percent over the period. These rates fell to 9 and 14 percent respectively in the second period. Meanwhile, the wealthiest among us maintained a robust income growth rate in both periods.
In the second half of this period, those with more grew wealthier. The richest quintile saw their incomes grow at least twice the rate of the lower 80 percent of households and in the case of the poorest quintile, the highest quintile outpaced its growth by 3.6 times. Income growth of the richest 5% of households went from 31.3% in the 1967-1986 period to 48.4% in the 1987-2006 period. Average income moved up for all groups in constant, inflation-adjusted dollars, but it leaped for those who were making the most.
Four recessions marked the 1967-1986 period. This period included the darkest days of the Vietnam war, the resignation of a president, an Arab oil embargo, and the Iranian hostage crisis. The 1980s began with the election of Ronald Reagan, brought to power by a resurgence of conservative inclinations. The Berlin Wall fell. The 1980s are now remembered as the years of the “Me Generation” and by phrases like “Greed is good.” Children were playing Pac Man as the new computer age dawned; “Apple” no longer simply meant a fruit. This period then rapidly morphed into the age of the Internet.
The 1987-2006 period saw two brief recessions (1990-1991 and 2001-2002). Our timeframe does not include the more serious recession that began in late 2007. The current recession is likely to have an important impact on all income groups. However, as the lower income households have seen far less growth in income over the last two decades (8 to 9% versus 32 to 48%), they are in a far more vulnerable position in terms of being able to weather such economic turmoil. In fact, during the period 2001 to 2006 the bottom three quintiles of households saw their inflation-adjusted incomes drop from 0.7 to 1.7 percent.
As the nation enters what appears now to be a prolonged downturn, starting in late 2007, incomes are likely to contract across the board. How the distribution of this income decline plays across the quintiles of population is yet to be seen but if recent history is any guide, the poor will be hit far harder than the wealthy as the recession works its way through the system.
Source: U.S. Bureau of the Census, Current Population Survey, “Share of Aggregate Income Received by Each Fifth and Top 5 Percent of Households (All Races): 1967 to 2007,” 2008.
