Goat Milk Products

Geographic reference: World
Year: 2020 and 2028
Market size: $10.37 billion and $14.47 billion, respectively

When one thinks of cow milk alternatives, what comes to mind might be soy milk, almond milk, or the recently popular oat milk. But, this post is about a different type of alternative: goat milk. Today’s market size shows total global goat milk product revenues for 2020 and projected for 2028. 

In terms of nutrition, cow milk and goat milk are nearly identical. Goat milk has more calories, protein, and fat but has fewer milligrams of cholesterol. It also has more calcium, potassium, and vitamin A. However, cow milk has more vitamin B12, selenium, and folic acid. Goat milk may be easier to digest for some people. The fat molecules are smaller, making them easier for the body to process. Also, goat milk has less lactose than cow milk. The growing popularity of this product is driven by its lower cholesterol and lactose.

In 2019, the last year for which data are available, global production of whole fresh goat milk totaled 19.9 million tons, down 2.2% from 2018, but up slightly from 2016. By region, Asia produced the most by far, 11.7 million tons, followed by Africa (4.4 million) and Europe (3.1 million). Oceania produced the least, 39 tons, followed by North America at 25,706 tons. However, North America garnered a 26.2% share of global revenues for goat milk products in 2020, the U.S. accounting for most of that. The Asia-Pacific region had a 29.8% share. There are several well-established and small goat milk producers worldwide, but the market is dominated by various international companies including Emmi Group, Kavli, Ausnutria Dairy Corp. Ltd., Granarolo Group, Dairy Goat Co-operation, Gay Lea Foods Co-operative Ltd., Hay Dairies Pte Ltd., Cherry Glen Goat Cheese Co., Goat Partners International Inc., and Summerhill Goat Dairy.

By product, milk had a 41.3% revenue share in 2020 followed by cheese and milk powder. The cheese segment is expected to grow at the highest compound annual growth rate (CAGR) through 2028. Most goat milk products are bought at supermarkets and hypermarkets. Consumers tend to feel more comfortable choosing fresh groceries, especially fresh dairy products, in person. However, online sales ranked second ahead of convenience stores. This segment benefited from the overall surge in online grocery sales during the COVID-19 pandemic and is projected to have the highest CAGR through 2028. 

Sources: “Goat Milk Market Size, Share & Trends Analysis Report by Product (Milk, Milk Powder, Cheese), by Distribution Channel (Supermarkets/Hypermarkets, Convenience Stores, Online), by Region, and Segment Forecasts, 2021 – 2028,” Million In$ights Report Summary, April 2021 available online here; “Goat Milk Market Size Worth $14.47 Billion By 2028 | CAGR: 4.3%: Million Insights,” CISION PR Newswire, April 28, 2021 available online here; Katherine Gillen, “Goat Milk vs. Cow Milk: Is One Actually Healthier Than the Other?” PureWow Blog, August 19, 2019 available online here; “Livestock Primary,” FAOSTAT, Food and Agriculture Organization of the United Nations available online here.
Image source: Rita E, “goat-pet-farm-horns-livestock-3613728,” Pixabay, August 18, 2018 available online here. The picture is used for illustration purposes only. The goat in the picture is not necessarily a dairy goat.

Vegan Cheese

vegan cheese pizza
Mozzarella is the top-selling type of vegan cheese.
Geographic reference: World
Year: 2019 and 2027
Market size: $1.01 billion and $2.66 billion, respectively

Today’s market size shows the global revenues for vegan cheese in 2019 and projected for 2027. The global vegan cheese market is a very small fraction of the $69.7 billion dairy cheese market, however, due to the increasing popularity of vegan cheese revenues are expected to more than double by 2027, growing at a compound annual growth rate (CAGR) of 12.8% from 2020 to 2027. Demand is increasing for all plant-based foods including vegan cheese. Veganism is more common among consumers, either as a health choice or in response to concern for animal welfare and the environment. But vegan cheese is not just in demand among vegans. Flexitarians seek out plant-based alternatives in order to reduce the amount of meat and dairy in their diets. And, according to the U.S. National Institutes of Health, 65% of the global population has trouble digesting lactose, the sugar found in dairy products. Substituting vegan cheese for dairy cheese in many recipes allows this population the ability to enjoy foods they might not be able to eat otherwise.

Vegan cheese made with cashews held the largest share of the market at 35%. Products made with soy are expected to gain market share through at least 2027. Soy is a low-cost dairy alternative and is low in cholesterol with other health benefits. By type, mozzarella held the highest share at 30%, followed by Cheddar, cream cheese, and parmesan. Vegan mozzarella is in high demand in western countries where Italian food, including pizza, are popular. Ricotta-style vegan cheese is expected to see the fastest growth as more popular recipes incorporate this ingredient in appetizers, pizza toppings, and desserts.

With the increasing consumer demand for plant-based cheese, these products are no longer relegated to health food stores and specialty grocers. Increasingly supermarkets and convenience stores are stocking these products. More than 50% of vegan cheese is consumed in the household. Growth in this segment is due to higher availability and a willingness by consumers to pay for premium products. The foodservice segment of the market is expected to see the fastest growth as more restaurants, fast-food chains, and casual-dining establishments add plant-based offerings to their menus. The growing popularity of vegan meal kit services will also contribute to the growth in vegan cheese sales. Plant-based meal kits by Allplants Ltd. have been so popular in the United Kingdom, the company plans to expand to other parts of Europe and North America. Europe accounted for a 40% share of global vegan cheese revenues, the highest in the world, with the United Kingdom and Germany being the major markets in the region. The Asia-Pacific region is expected to experience the fastest CAGR, 14.3%, from 2020 to 2027.

In the United States, brands such as Daiya, Follow Your Heart, Kite Hill, Violife, and Go Veggie, whose companies exclusively create vegan and vegetarian food items, have seen top 10 sales in 2020. Of the top 5 processed/imitation shredded cheese brands, 4 were vegan/vegetarian brands. Kraft Velveeta claimed the top spot with sales of $9.9 million, followed by Daiya ($8.8 million), Follow Your Heart ($2.5 million), Violife ($1.3 million), and Go Veggie ($1.1 million). In the processed/imitation sliced cheese category Daiya and Follow Your Heart ranked 8 and 10 respectively. In the soft cream cheese category, Kite Hill was the third-ranked brand (excl. Private label) with sales of $2.5 million, above Crystal Farms and Kraft. Tofutti and Daiya ranked sixth and seventh, respectively.1

To capitalize on the growing popularity of plant-based foods, some established dairy firms are including plant-based dairy items in their portfolios, either by acquiring companies with plant-based brands or developing products in house. In 2018, Miyoko’s joined Nestlé-backed accelerator Terra and has been working with the company to craft plant-based cheese and butter by combining proprietary technology and age-old creamery methods. In September 2019 Kraft Heinz provided seed funding for San Francisco-based animal-free cheese company New Culture. Before that, in September 2017, J Sainsbury PLC created vegan cheese products under its private label brand to sell in its Sainsbury’s supermarkets in the United Kingdom. As Dominic Borrelli, President of Plant-Based Food and Beverages and Premium Dairy at Danone North America states: “Overall, consumers are recognizing dairy-free doesn’t only need to be for those with allergens or those practicing a dairy-free lifestyle but can simply be enjoyed because it’s delicious!”

1 Ranking and sales data for processed/imitation cheese are for the 12 weeks ended March 22, 2020. Ranking and sales data for soft cream cheese are for the 12 weeks ended April 19, 2020. All data are originally from IRI, a market research firm, and can be found in Frozen & Refrigerated Buyer. See source note for more information.

Sources: “Vegan Cheese Market Size, Share & Trends Analysis Report by Product (Mozzarella, Cheddar, Parmesan, Ricotta, Cream), by Source (Cashew, Soy), by End-use (Household, Foodservice), by Region, and Segment Forecasts, 2020 – 2027,” Grand View Research Report Summary, September 2020 available online here; “Vegan Cheese Market Size Worth $2.66 Billion by 2027 | CAGR: 12.8%: Grand View Research, Inc.,” CISION PR Newswire, September 15, 2020 available online here; “Market Value of Cheese Worldwide from 2019 to 2025,” Statista.com available online here; Frozen & Refrigerated Buyer, May 2020, pp. 10-12 available online here; Frozen & Refrigerated Buyer, June 2020, p. 12 available online here; Brian Kateman, “Plant-Based Meal Kits and Delivery Services are on the Rise,” Forbes, December 11, 2019 available online here; Andy Coyne, “Plant-based Priorities — Dairy Companies with a Stake in Dairy-free,” just-food, August 4, 2020 available online here; Andy Coyne, “Nestlé-backed U.S. Accelerator Terra Reveals Latest Cohort,” just-food, October 4, 2018 available online here; “Danone: ‘The Emphasis on Plant-Based Nutrition Will Accelerate Over Time & We Are Here to Help Meet Those Needs,'” Vegconomist, May 6, 2020 available online here.
Image source: Amber Engle, “Rainbow Veggie Pizza Slice,” Unsplash, July 25, 2020 available online here.

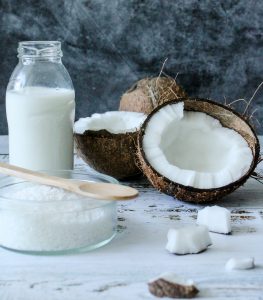
Coconut Milk Powder

coconut milk
Geographic reference: World
Year: 2019 and 2027
Market size: $52.5 million and $113.0 million, respectively
Sources: “Coconut Milk Powder Market Size, Share & Trends Analysis Report by Product (Organic, Conventional), by Application (B2B, B2C), by Distribution Channel (Offline, Online), by Region, and Segment Forecasts, 2020 – 2027,” Grand View Research Report Summary, June 2020 available online here; “Coconut Milk Powder Market Size Worth $113.0 Million by 2027 | CAGR 10%: Grand View Research, Inc.,” CISION PR Newswire, June 16, 2020 available online here; Boriana Slabakova, “The Age of Veganism,” Health Careers Blog, January 7, 2020 available online here.
Image source: Adapted from: Tijana Drndarski, “Raw Coconut Products, Coconut Flakes and Coconut Milk,” Pixabay, May 2, 2020 available online here.

Sixty-five percent of the global population is lactose intolerant, including 90% of the people in the Asia-Pacific region. In addition, the rise in health consciousness coupled with the rise in veganism has consumers worldwide seeking dairy alternatives. As of January 2020, the global market for dairy alternatives totaled $18.12 billion, a 144.9% increase from $7.4 billion in 2010. Plant-based milk constitutes 13% of the entire milk market and more than 50% of the vegan food market. Coconut milk powder is one type of dairy alternative that is expected to see significant growth in the near future.

Today’s market size shows coconut milk powder revenues for 2019 and projected for 2027. For consumers who like to buy in bulk and for those that cannot buy liquified coconut milk on a regular basis, coconut milk powder, with its long shelf life, is a convenient alternative. For many cultures such as Brazilian, Burmese, Indian, Thai, Indonesian, Hawaiian, Singaporean, Sri Lankan, and Vietnamese among others, it is considered a staple of their cuisine. Because of this, the Asia-Pacific region held a third of the market in 2019.

Commercially, coconut milk powder is used to prepare smoothies, shakes, ice creams, cakes, donuts, sauces and gravies. The growing demand for vegan ice cream and desserts at dine-in hotels and quick-service restaurants is expected to contribute to growth in the business-to-business (B2B) sector. In 2019, more than 66% of sales were in the B2B segment. The business to consumer segment is expected to have the fastest growth rate, a compound annual growth rate of 10.7% from 2020 to 2027.

Conventional coconut milk powder was the first type to be introduced to the market. In 2019, it claimed more than 70% of revenues. While it is more economical than the organic variety, organic coconut milk powder revenues are expected to grow the fastest through 2027 due to increased demand for organic products in general, products without chemical fungicides, herbicides, or insecticides and grown in an eco-friendly way.

Most manufacturers are small, catering to local markets. Some larger manufacturers include Nestlé Inc., Anthony’s Goods, BareOrganics, Bramble Berry Inc., Dr. Ben Kim Natural Health Solutions, Enerhealth, Grace Foods Canada Inc., Healthworks, King Arthur Flour Company Inc., and KOS.

Enzymes

enzymes in laundry detergent
Laundry detergent. Enzymes in laundry detergent allow clothes to be washed in cold water.
Geographic reference: World
Year: 2019 and 2027
Market size: $9.9 billion and $17.2 billion, respectively
Sources: “Enzymes Market Size, Share & Trends Analysis Report by Application (Industrial Enzymes, Specialty Enzymes), by Product (Carbohydrase, Proteases, Lipases), by Source, by Region, and Segment Forecasts, 2020 – 2027,” Grand View Research Report Summary, March 2020 available online here; “Enzymes Market Size Worth $17.2 Billion by 2027 | CAGR 7.1%: Grand View Research, Inc.,” CISION PR Newswire, March 16, 2020 available online here; Sindhu Raveendran, et. al., “Applications of Microbial Enzymes in Food Industry,” Food Technology & Biotechnology, March 2018 available online at the U.S. National Library of Medicine, National Institutes of Health here; JanMaarten van Dijl and Michael Hecker, “Bacillus Subtilis: From Soil Bacterium to Super-secreting Cell Factory,” Microbial Cell Factories, January 14, 2013 available online here; “A Global Fermentation Approach,” Leaf by Lesaffre available online here; “Specialty Enzymes Market Worth $6.6 Billion by 2025,” MarketsandMarkets Press Release, April 20, 2020 available online here.
Image source: habelfrank, “washing-powder-detergent-1500058,” PIxabay, July 7, 2016 available online here.

Enzymes are proteins that act as catalysts. Enzymes in the body run cellular processes and convert food to energy and to building blocks for proteins, lipids, nucleic acids, and some carbohydrates. Industrial enzymes such as proteases, amylases, lipases, and others are used in various applications: in the food and beverage industry, in detergents, animal feed, biofuels, textiles, pulp and paper, nutraceuticals, personal care products and cosmetics, wastewater treatment, and medications. In 2018, 60% of industrial enzymes on the market were proteases. In Europe, 900 tons of protease enzymes are used for detergents alone every year.

Today’s market size shows the global enzyme revenues for 2019 and projected for 2027. Microorganism-based enzymes comprised the vast majority of the industrial enzyme market in 2019, about 85%, followed by animal-based and plant-based enzymes. Microorganisms are preferred as a source due to their more predictable and controllable enzyme content. This type of enzyme can also be produced in a cost-effective manner with less space and time necessary than animal-based or plant-based enzymes. There are three types of microorganism-based enzymes: bacterial, fungal, and yeast. Bacterial enzymes are mostly sourced from Bacillus. They’re used in food and detergent and in pharmaceutical applications to diagnose diseases, promote wound healing, and kill disease-causing microorganisms. Fungal enzymes are used in the preparation and production of soy sauce, beer, baked goods, processed fruits, and dairy products. Yeast is used in beer, baked goods, and industrial ethanol production.

Increased investment in biotechnology research for the development of specialty enzymes for medicinal and diagnostic purposes is one of the main factors driving product demand globally. Increasing demand from the food and beverage, biofuel, animal feed, and home cleaning sectors along with the growing consumption of functional foods will contribute to the growth in the market through 2027. By region, growing biofuel production in North America and Europe, as well as increasing meat production in Europe and the Russian Federation, are expected to contribute to growth in these regions. Enzymes are used extensively in meat processing to improve the tenderness of the meat. Europe was third behind China and North America in meat production in 2018. The top three companies in this industry—Novozymes, DuPont Danisco, and DSM— claimed more than 75% of the market in 2019.1 Other major companies in this industry include BASF SE, Associated British Foods PLC, Chr. Hansen Holding A/S, and Advanced Enzyme Technologies.

1 Source: Grand View Research. The press release from CISION PR Newswire mentioning the same Grand View Research report states that the top 3 companies are Novozymes, DuPont Danisco, and BASF SE.

Cold Cereal for Breakfast

In recent years makers of cold cereal have seen their revenues drop as more people choose a variety of other options for their first meal of the day. In the second quarter of 2013, Kelloggs reported a 3% drop in sales of cold cereal and General Mills reported a 7% drop. Yogurt, shakes, and on-the-go breakfast bars are popular alternatives to cold cereal. While cold cereal is still the number one choice for breakfast in the United States, yogurt is the second most popular choice with revenues of nearly $7 billion. And within the yogurt market, it is Greek yogurt that has pushed sales skyward for several years now. A novelty just five years ago, Greek yogurt has grown to represent 40% of the yogurt market since then.

Today’s market size is the value of sales of cold cereal in the United States for the year, August 2012 to August 2013.

Geographic reference: United States
Year: August 2012-2013
Market size: $9 billion
Source: Jane Wells, “Cereal Killers: Americans’ New Breakfast Habits,” CNBC, August 23, 2013, available online here.
Posted on August 27, 2013

Yogurt Production

The dairy industry is broken into several product categories. Of these, yogurt is the one that has seen the greatest growth over the last decades. Between 1990 and 2009, the production of yogurt in the United States rose 291.4%. By way of comparison, the U.S. population grew by 24% in this same time period. While production of all dairy products grew, yogurt was by far the leading category. Butter production grew by 20.8% and the production of all cheeses grew 66.78% while the quantity of yogurt almost trebled during this two-decade period.

Geographic reference: United States
Year: 1990 and 2009
Market size: 978.9 million and 3.832 billion pounds respectively.
Source: “Dairy Products, 2009 Summary,” USDA publication, April 2010, page 9, available online here. Data for 1990 are from the 1991 edition of the USDA report.
Original source: U.S. Department of Agriculture, National Agricultural Statistics Service

Buttermilk

The United States produces and consumes a great deal of dairy food, buttermilk being one of the small product categories within this huge market. The market size presented below is the quantity of buttermilk produced in the United States in 2009. It represents 3% of all milk products and a mere 0.6% of all dairy products.

Geographic reference: United States
Year: 2009
Market size: 125.3 million pounds.
Source: “Dairy Products, 2009 Summary,” USDA publication, April 2010, page 9, available online here.
Original source: U.S. Department of Agriculture, National Agricultural Statistics Service