Summer Enrichment Programs

summer enrichment programs, summer campWhat did you do on your summer vacation? The ubiquitous question that’s asked of children and young adults as they return to classes in the fall. The responses may differ greatly depending upon what country the student lives in or how wealthy their parents are. Many students may say they attended summer camp. When parents and grandparents in the United States think of their experiences at summer camp they may remember rustic cabins, swimming, canoeing, arts and crafts, and sitting around a campfire in the evenings. However, increasingly in the U.S. and around the world summer camps, or summer enrichment programs as they are sometimes called, cater to niche interests or focus on in-demand workforce skills. According to the American Camp Association, the percentage of camps offering science, technology, engineering, and math programs grew from less than 25% in 2014 to more than 33% in 2017. Demand for such camps is increasing as more affluent parents want to give their children not only an enjoyable experience but also a competitive advantage in school and in the workforce, even if many of these students are still in elementary school. As summer enrichment programs become more specialized, exclusive, and expensive, fewer students from lower- and middle-income families will be able to take advantage of these opportunities.

In China, many wealthy parents send their children abroad in the summer to take advantage of study tours in the hopes of broadening their children’s view of the world and preparing them to attend college in other countries. Today’s market size shows the estimated amount Chinese parents will spend on study tours abroad in 2018. An estimated 1 million Chinese students will take these tours this year. According to Chu Zhaohui, a researcher at the National Institute of Education Sciences,1 the United States, the United Kingdom, and Australia are the top three destinations for study abroad tours.

1 The National Institute of Education Sciences is a research division of the Ministry of Education in the People’s Republic of China.

Geographic reference: China
Year: 2018
Market size: $4.5 billion
Sources: “Mutually Assured Distraction,” The Economist, August 11, 2018, page 47; Ma Xuejing, “Study Tours Abroad More Hype Than Substance,” China Daily, June 22, 2018 available online here.
Original source: Ctrip, a Chinese travel agency
Image source: davidraynisley, “paddle-summer-camp-camp-summer-3414020,” Pixabay, May 2018 available online here.

Youth Sports Tourism

An estimated 35 million children in the United States between the ages of 5 and 18 play organized sports every year. Of those, 21 million play non-school youth sports, which include baseball, soccer, lacrosse, rowing, hockey, volleyball, and gymnastics. These non-school groups are organized through local programs, such as Little League, or through sports clubs.

Unlike school-sponsored sports, in which teams usually travel by bus from one local school to another for games and tournaments, non-school sports games and tournaments may be held either across town or across the country. Parents are expected to spend the time and money to take their children to these events. Because of the money families spend while at these far away locations, more cities are planning to build sports complexes to attract youth sports tournaments.

Today’s market size is an estimate of the total spent in 2013 by families in the United States on travel for youth sports, including hotels, restaurants, and shopping. This category of tourism—Youth Sports Tourism—didn’t even exist a few years ago but is now one that is keenly tracked by industry observers and chambers of commerce.

Geographic reference: United States
Year: 2013
Market size: $7 billion
Source: Mark Koba, “Spending Big on Kids’ Sports? You’re Not Alone,” CNBC.com, January 13, 2014, available online here.
Original source: Minnesota Amateur Sports Commission
Posted on January 16, 2014

Intercountry Adoptions

Foreign Adoptions and Fertility Rates

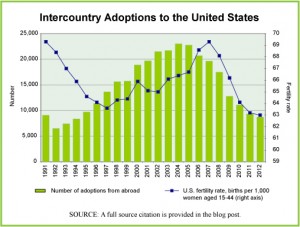
The decade between 1995 and 2005 was a high point in adoptions by U.S. citizens of children from other countries, as can be seen in the graph. Since then, the numbers of adoptions has plummeted despite growing waiting lists of U.S. citizens interested in adopting. The reasons for the decline are varied but explained this way in a report by Time magazine, “… a combination of forces in the developing world, from reform efforts to economic growth to resurgent nationalism, is turning the attitude against the practice, even in countries where kids may need the most help.”

Today’s market size, we use the term market loosely here, is the number of children adopted by U.S. citizens from abroad in 2004 (the peak year for intercountry adoptions) and 2012. The graph shows the number of children adopted in this way each year from 1991 through 2012 as well as the fertility rate in the United States for each of these years. The fertility rate is the number of children born for every 1,000 women of childbearing age, namely 15 to 44 years.

Geographic reference: United States
Year: 2004 and 2012
Market size: 22,991 and 8,668 respectively
Source: Kayla Webley, “The Baby Deficit,” Time, January 21, 2013, page 34. “Statistics – Adoptions by Year,” a report put out by the U.S. State Departments’ Bureau of Consular Affairs and available online here. “International Adoption Facts,” a report published by The Evan B. Donaldson Adoption Institute in 2002 and available online here. “National Vital Statistics Reports — Births: Final Data for 2010, August 28, 2012, U.S. Department of Health and Human Services, Centers for Disease Control and Prevention (CDC), available online here, with updates from another CDC report available here.
Posted on February 1, 2013

Child Care Services

Child Care Revenues Annually

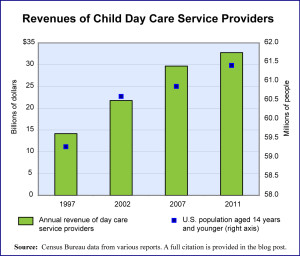
The demand for child care services fell during the 2007–2009 recession as rising unemployment destroyed some of the demand for these services by those no longer employed. The graph shows annual revenue for child day care service providers as well as the U.S. population aged 14 years or younger for each of the years shown. The growth in population in this age group was 36% over this period (1997–2011) while the inflation-adjusted rate of growth in revenues of child day care service providers was 52%.

The revenue data shown here are from reports on the industry as defined by the U.S. Census Bureau with the NAICS code 6244: Child Day Care Services.

Geographic reference: United States
Year: 2002 and 2011
Market size: $21.7 and $32.8 billion respectively
Source: Annual and Quarterly Services, part of quarterly reporting on the service industry as a whole done by the Census Bureau and made available online here. For the years prior to 2011, data are from the Economic Census reports for the years 1997, 2002, and 2007.
Original source: U.S. Department of Commerce, Bureau of the Census
Posted on September 19, 2012

Growing Market for Epinephrine

Anyone with a child in school these days is likely to be very aware of the growing concerns related to food allergies. In many elementary schools in the United States, special tables in the lunch room are set aside for children whose lunches contain any nuts, like the traditional peanut butter and jelly sandwich. In some schools, foods containing nuts of any kind are banned entirely. This is because of a rising number of children who suffer from food allergies, particularly nut allergies, and the rising severity of their allergic reactions.

Nut allergies have been the fastest growing food allergies in recent years. In 1997, approximately 278,000 children under the age of 18 in the United States (0.04% of the age group) suffered from an allergy to peanuts. In 2008, that number had risen to over a million (1.5% of children in the age group).

Today’s market size is the estimated number of children (under the age of 18 years) in the United States who suffer severe food allergies. It is a calculation based on a study that showed that one in thirteen children suffer food allergies and that nearly 40 percent of those children suffer severe allergic reactions, severe enough to require the use of a drug like epinephrine to combat the reaction and save their lives.

Geographic reference: United States
Year: 2010
Market size: 2.28 million
Source: Katie Thomas, “Tiny Lifesavers for a Growing Worry,” The New York Times, September 8, 2012, page B1. Population data used to calculate today’s market size are from “Table 1. Population by Sex and Selected Age Groups: 2000 and 2010,” Age and Sex Composition: 2010, May 2011, one of the Census Bureau’s reports on the 2010 Census of the United States, available here.
Original source: A study published in the journal Pediatrics and referenced in the source article listed above.
Posted on September 12, 2012

Summer Camp

Today’s market size is the estimated annual number of people attending an organized camping experience of the sort run by the nation’s roughly 12,000 camp organizations. Of these organizations, about two-thirds are non-profits and the rest are privately owned. Most of the people attending camps are children enrolled in summer camps, camps which are tending increasingly towards specializations such as a focus on a particular sport, an artistic pursuit (e.g. music) or an academic area of study (e.g. science).

Geographic reference: United States
Year: 2011
Market size: 11 million
Source: Natasha Singer, “When S’Mores Aren’t Enough,” The New York Times, July 10, 2011, page B1.
Original source: American Camp Association

Disposable Diapers

Any parent with a small child knows that diapers are big business. The use of disposable diapers is highest in industrialized countries and together these countries account for most of this market, the U.S. alone accounting for nearly 20% of the global market according to the source. Today’s market size is an estimate of the size of the global diaper market in 2005 and 2010. The estimated size for 2010 is based on a forecast for that year made in advance. More recent estimates suggest that the global market surpassed $30 billion in 2010

Geographic reference: World
Year: 2005 and 2010
Market size: $22.2 and $26.6 billion respectively
Source: “Stratagist,” a report published in May 2009 by Feed-back.com, Market Analysis With Context and Perspective, available online here.
Original source: Euromonitor International and Global Industry Analysts