Commercial Seaweed

seaweed

“Some algae are a delicacy fit for the most honoured guests, even for the King himself.”

— Sze Teu (China, 600 BC)

Since prehistoric times, seaweed has been a staple food in China, Japan, and Korea. Commercial seaweed was first consumed in Japan in the 4th century and in China in the 6th century. Currently, China, Japan, and South Korea are the top consumers. As residents of these countries migrated to other parts of the world, demand for seaweed spread. Seaweed provides vitamins and nutrients such as calcium, sodium, potassium, iodine, iron, and zinc. Nori, the seaweed used to wrap sushi rolls, is also high in protein.

Today’s market size shows global commercial seafood revenues for 2019 and projected for 2027. Over the past 50 years, harvesting seaweed from natural sources has not been able to meet increasing demand. Nowadays, more than 90% of commercial seaweed is cultivated. In addition to human consumption, commercial seaweed is used as an animal feed additive, thickening and gelling agents for the cosmetics and food industries, fertilizer, and soil conditioner. It’s also used in beauty products such as scrubs, masks, and body wraps.

There are three types of commercial seaweed: red, brown, and green. In 2019, red seaweed comprised more than 50% of the market. Its varied uses along with its easy availability will drive its growth in the market. This type of seaweed is expected to have the highest compound annual growth rate through 2027. Nori is an example of red seaweed. Brown seaweed had a market share of more than 45% in 2019. This type of seafood is used as food and as raw materials for the extraction of hydrocolloid and alginate. Hydrocolloids and alginate gel are used for wound care. Alginate is also used as a cell carrier in tissue engineering. Kelp is a form of brown seaweed. Green seaweed is also used for food. Umibudo, also known as sea grapes, is a form of green seaweed that’s a staple food in Okinawan cuisine. 

In 2019, the Asia-Pacific region accounted for more than 60% of consumption. This region is expected to experience the fastest growth rate through 2027. Increased production and demand for commercial seafood for use in food, nutraceuticals, personal care products, pharmaceuticals, adhesives, and gels from China, Indonesia, South Korea, and Japan will contribute to this growth. The market in Europe is expected to expand significantly due to increased cultivation in Ireland, France, and the United Kingdom. Growth in this region is also expected to come from high demand in the healthcare and food industries.

About 75% of commercial seaweed was used for human consumption in 2019. Animal feed claimed the second-largest share of the market. Processed commercial seaweed is used to improve the health of livestock. Agricultural uses had the third-largest market share. Producers, vendors, end-users, government organizations, and others encompass the market. Some leading global companies in this industry include Cargill Inc., Roullier Group, E.I. DuPont Nemours and Co., Biostadt India Ltd., and Compo GmbH Co.

Geographic reference: World
Year: 2019 and 2027
Market size: $5.9 billion and $11.9 billion, respectively
Sources: “Commercial Seaweeds Market Size, Share & Trends Analysis Report by Product (Brown Seaweeds, Red Seaweeds, Green Seaweeds), by Form (Liquid, Powdered, Flakes), by Application, by Region, and Segment Forecasts, 2020 – 2027,” Grand View Research Report Summary, April 2020 available online here; “Commercial Seaweeds Market Size Worth $11.9 Billion by 2027: Grand View Research, Inc.,” CISION PR Newswire, April 21, 2020 available online here; “Hydrocolloid,” ScienceDirect available online here; “Alginate,” ScienceDirect available online here; “Seaweed as Human Food,” The Seaweed Site: Information on Marine Algae available online here; Ole Mouritsen, “The Science of Seaweeds,” American Scientist, November-December 2013 available online here; Rachel Tan, “6 Most Common Varieties of Edible Seaweed,” Michelin Guide, June 12, 2019 available online here.
Image source: ivabalk, “sushi-food-roll-domestic-production-2314534,” Pixabay, May 15, 2017 available online here.

Global Feed Industry

The feed industry is a part of the agriculture sector. The term feed here is used as a noun and refers to the food provided to agricultural animals and fish, to livestock. Many different things are used as feed. These are usually broken into two categories, concentrates and roughage. The concentrates are the high energy value feeds that come from cereal grains, high-protein oil meals, and by-products from processing sugar beets, sugarcane, animals and fish. The category of feed referred to as roughage includes pasture grasses, hay, silage, corn stalks and the like.

An area of interest and research in this industry is raising insects for use as animal feed. It has the potential for being a very sustainable, comparatively low energy way to significantly increase feedstocks over the next decades. This is important since United Nations’ estimates predict a 70% increase in demand for agricultural feed over current rates by the year 2050.

Today’s market size is the quantity and value of feed production globally in 2011.

Geographic reference: World
Year: 2011
Market size: 870 million tons valued at $350 billion
Source: “Insects as Animal Feed,” The Fish Site, June 3, 2013, available online here.
Original source: United National Food and Agriculture Organization (FAO)
Posted on September 20, 2013

Canned Fishery Products

Fishery products are canned for both human and animal consumption. In the United States, in 2010, 68.8% of all canned fishery products by weight were produced for human consumption and 31.3% for animal food and bait. In terms of value, the breakdown was 84.7% for human consumption and 15.3% for animal consumption.

Geographic reference: United States
Year: 2010
Market size: 954.14 million pounds valued at $1.411 billion
Source: “Fisheries of the United States–2010,” August 2011, page 46, available online from the National Marine Fisheries Service website, here.
Original source: National Oceanic and Atmospheric Administration (NOAA), Office of Science and Technology, National Marine Fisheries Service, USDA
Posted on March 6, 2013

Fish Oil

Fish oil is a commodity derived from the tissues of oily fish. This oil contains high levels of the Omega-3 fatty acids eicosapentaenoic acid (EPA) and docosahexaenoic acid (DHA) which is part of the reason that offerings of fish oil as a dietary supplement have seen growing popularity. Today’s market size is the volume and value, at a wholesale level, of fish oil production in the United States in 2010.

Geographic reference: United States
Year: 2010
Market size: 136.4 million pounds or 17.6 million gallons valued at $30.1 million
Source: “Fisheries of the United States–2010,” August 2011, page 42, available online from the National Marine Fisheries Service website, here.
Original source: National Oceanic and Atmospheric Administration (NOAA), Office of Science and Technology, National Marine Fisheries Service USDA
Posted on December 3, 2012

Breaded Shrimp

Today’s market size is the weight and value of breaded shrimp produced in the United States in 2010.

Geographic reference: United States
Year: 2010
Market size: 123.6 million pounds at an estimated wholesale value of $583.7 million dollars
Source: “Fisheries of the United States–2010,” August 2011, page 42, available online from the National Marine Fisheries Service website, here.
Original source: National Oceanic and Atmospheric Administration (NOAA), Office of Science and Technology, National Marine Fisheries Service, USDA
Posted on November 16, 2012

Tuna

Tuna fish, in the form of canned tuna, is a staple of the U.S. diet and is the largest of the canned fish markets by both weight and value. Today’s market size is the production in 2010 of canned tuna in the United States.

Geographic reference: United States
Year: 2010
Market size: 395.4 million pounds at an estimated wholesale value of $723.8 million dollars
Source: “Fisheries of the United States–2010,” August 2011, page 42, available online from the National Marine Fisheries Service website, here.
Original source: National Oceanic and Atmospheric Administration (NOAA), Office of Science and Technology, National Marine Fisheries Service, USDA
Posted on November 6, 2012

Canned Clams

U.S. canned clam production in 2010 is the market size today. The value per pound for canned clams in 2010 was just shy of one dollar ($0.89). As compared with the highest volume canned fish product, namely tuna, canned clams were 27.7% of tuna by weight and 13.5% by value.

Geographic reference: United States
Year: 2010
Market size: 109.3 million pounds at a value of $97.2 million
Source: “Fisheries of the United States–2010,” August 2011, page 42, available online from the National Marine Fisheries Service website, here.
Original source: National Oceanic and Atmospheric Administration (NOAA), Office of Science and Technology, National Marine Fisheries Service, USDA
Posted on October 25, 2012

Fish Sticks

Fish sticks—oblong pieces of fish that are breaded and usually frozen before final preparation—are a popular food in the United States and for many children they are the primary form in which seafood is eaten. Today’s market size is the volume and value of fish stick production in the United States in 2010.

Geographic reference: United States
Year: 2010
Market size: 82.9 million pounds at a value of $113.8 million dollars
Source: “Fisheries of the United States–2010,” August 2011, page 42, available online from the National Marine Fisheries Service website, here.
Original source: National Oceanic and Atmospheric Administration (NOAA), Office of Science and Technology, National Marine Fisheries Service
Posted on October 15, 2012

Caviar

Caviar is one of those luxury items that has not seen a great decline during the recession and financial crisis that started in 2007 and 2008. In fact, demand for caviar has been strong and since overfishing in the Caspian Sea has left the sturgeon species depleted in that region, farms are emerging around the world to produce caviar and meet the strong demand.

In the 1970s, an estimated 550 tons of caviar were produced annually around the world. This caviar came primarily from wild sturgeon. Forty years later, production comes primarily from farm-raised sturgeon and while production is down sharply from the highs of the 1970s, it is expected to continue rising into the foreseeable future.

Today’s market size is the estimated total world production of caviar in 2010.

Geographic reference: World
Year: 2010
Market size: 250 tons with a wholesale price in the range of $500 to $600 per pound.
Source: Raphael Minder, “Caviar Migrates Beyond The Caspian Region,” The New York Times, December 17, 2011, page B3.
Original source: Patrick Williot
Posted on December 17, 2011

Fish Catch

While many spend summer hours in the often leisurely act of fishing, we look today at fishery production for our market size. The market presented below is the size of the domestic catch in the United States for 2008. This does not include, of course, all those Rock Bass, Walleye, Trout, Bluegill, Pike and Perch being pulled from lakes and streams all over the country by sports fisherman. Rather it is the size of the commercial catch.

Geographic reference: United States
Year: 2008
Market size: 8,326 million pounds
Source: “Table 889. Fishery Products—Domestic Catch, Imports, and Disposition: 1990 to 2008,” Statistical Abstract of the United States 2011, January 2011, page 566, available online here.
Original source: U.S. Census Bureau

Fish and Fishery Product Exports

Exports of fish and fishery products have grown quickly in the last decade, as has all production of fish and fishery products, whether through capture (fishing) or aquaculture (cultivation). Leading fish and fishery product exporters in the world are, in order, China, Norway, Thailand, Denmark, Vietnam, and the United States. Together, the exports of these six countries in 2008 accounted for 36.5% of all exports.

Geographic reference: World
Year: 1998 and 2008
Market size: $51.45 and $101.98 billion respectively.
Source: “Table 11 — Top Ten Exporters and Importers of Fish and Fishery Products,” The State of Fisheries & Aquaculture 2010, page 52, available online here.
Original source: United Nations, Food & Agriculture Organization (FAO), Fisheries and Aquaculture Department.

Fish and Fishery Product Imports

Aquaculture is a fast growing part of the fish and fishery products market and as catches and harvests of this aquatic produce have increased over the last decade, so has the international trade of fish and fishery products. The top countries in terms of fish and fishery product imports are, in order, Japan, United States, Spain, France, Italy and China. Interestingly, China and the United States are also among the leading exporters of aquatic produce.

Geographic reference: World
Year: 1998 and 2008
Market size: $55.05 and $107.13 billion respectively.
Source: “Table 11 — Top Ten Exporters and Importers of Fish and Fishery Products,” The State of Fisheries & Aquaculture 2010, page 52, available online here.
Original source: United Nations, Food & Agriculture Organization (FAO), Fisheries and
Aquaculture Department.

Aquaculture

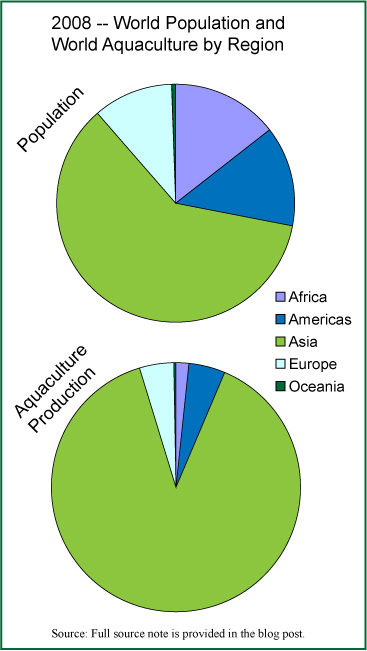
World Population and Aquaculture Production in 2008

Aquaculture is the cultivation of aquatic plants and animals for human use and is also referred to as aquafarming. To say that aquaculture has grown rapidly since 1970 would miss the point entirely. The quantity of aquatic produce harvested in 1970 was a mere fraction—1/20th—of that harvested in 2008. The growth of aquaculture has been strong across all regions of the world. Nonetheless, Asia has seen enough growth in aquacultural production to raise its already high percentage of world production in 1970 (69.6%) to a remarkable 88.8% in 2008. In the chart we provide here you will see the world’s population presented by region as well as the world’s aquacultural production by region.

The market sizes presented here do not include aquatic plants but do cover all caught and raised fish of any kind from marine and inland waterway sources.

Geographic reference: World
Year: 1980, 2000 and 2008
Market size: 4.7, 32.4 and 52.5 million tons respectively.
Source: “Table 4 — Aquaculture Production by Region: Quantity and Percentage of World Production,” The State of Fisheries & Aquaculture 2010, page 20, available online here. The population data used in the chart are from the Statistical Abstract of the United States 2011, available online here.
Original source: United Nations, Food & Agriculture Organization (FAO), Fisheries and
Aquaculture Department and U.S. Census Bureau.

Fishing and Aquaculture

As the world population grows, so do all efforts to feed that population. An important resource in this effort are our inland waterways, oceans and seas. Aquaculture—the cultivation of aquatic plants and animals also referred to as aquafarming—is the fastest growing sector within this industry. Fishing in the wild is, in many places, becoming more difficult because of regulations to prevent overfishing or because overfishing itself has already caused a serious decline in the fish population, as happened to dramatic effect off the eastern coast of Canada in the early 1990s.

Tomorrow we’ll look at the aquaculture portion of this market.

The market sizes presented here do not include aquatic plants but do cover all caught and raised fish of any kind from marine and inland waterway sources.

Geographic reference: World
Year: 1998 and 2008
Market size: 117.2 and 142.3 million tons respectively. Approximately 80% of both year’s totals were for human consumption—93.3 and 115.1 million tons respectively.
Source: “Table — 1 World Fisheries and Aquaculture Production and Utilization,” The State of Fisheries & Aquaculture 2010, page 3, available online here. The data for 1998 are from the 2000 edition of this same report, same table number, page 6, and available online here.
Original source: United Nations, Food & Agriculture Organization (FAO), Fisheries and Aquaculture Department.

Maine Lobster

Maine lobstermen have been increasing their fishing take for years now, reaching a new record in 2010. However, as with all commodities, there is a fine balance to be found between increasing volumes and price. The high prices per pound earned during the 2003 through 2007 period came down sharply in 2008 and 2009 when the price per pound hit a decade low of $2.93. In 2010 that price rose again, to $3.31, bringing it back to the level seen in 2000.

Geographic reference: State of Maine
Year: 2000 and 2010 (preliminary data)
Market size: 57.22 million pounds valued at $187.7 million and 93.36 million pounds valued at $308.7 million respectively.
Source: “Historical Maine Lobster Landings,” a report available online here.
Original source: Maine Department of Marine Resources.