Antimicrobial Textiles

surgical scrubs antimicrobial textiles
More than 45% of antimicrobial textiles are used in the healthcare industry.
Geographic reference: World
Year: 2019 and 2026
Market size: $10.48 billion and $20.50 billion, respectively

Antimicrobial textiles are fabrics coated with substances that destroy or inhibit the growth of microorganisms such as bacteria, viruses, protozoans, mold, and mildew. These substances can also be incorporated within the fibers of the fabric. Today’s market size shows the global revenues for antimicrobial textiles in 2019 and projected for 2026. These specialty textiles accounted for about 1% of total worldwide textile revenues in 2019.

The use of antimicrobial substances is nothing new. The ancient Egyptians used spices and herbs to preserve mummy wraps. The Chinese used bamboo, which contains the antimicrobial substance bamboo-kun, in housing structures and decor. And, during World War II the militaries on both sides of the conflict used antimicrobials to protect military gear from rotting. The antimicrobials used during World War II, however, were found to cause serious health problems and polluted the earth. In the 1960s, after Rachel Carson’s book Silent Spring was published, public and private organizations hired ecologists, scientists, and industrial chemists to develop more eco-friendly antimicrobials. Some antimicrobials such as silver nanoparticles and triclosan can wash off fabrics when laundered and pollute local water sources. Several newer antimicrobial coatings currently in use and in development do not do this thereby minimizing the harmful effects to the environment and prolonging the antimicrobial properties of the fabric.

Nearly half of the antimicrobial textiles used are made of polyester. The fiber is readily available and can be combined with other fibers such as cotton, vinyl, and others to create a wide range of fabrics for use in many different applications. Antimicrobial textiles are used in healthcare; hygiene; medical devices; sportswear; food packaging; storage; thermal and mechanical protection; automotive textiles; heating, ventilation and air conditioning; air filters; and water purification systems. 

More than 45% of consumption occurs in the healthcare sector. Surgeon’s gowns, bed sheets, curtains, and masks are some of the items made with these textiles. Increasing requirements to reduce hospital-acquired infections, growing demand for advanced safety products, and increasing need for personal protective equipment due to the COVID-19 pandemic are all expected to contribute to the growing demand for antimicrobial textiles in the coming years. In May 2020, the first antiviral chemical coating for textiles that kills the SARS-CoV-2 virus, PROTX2-AV, was proven effective in lab tests and is awaiting Environmental Protection Agency approval in the United States to market it. The company that developed it, Intelligent Fabric Technologies North America, is producing its own line of personal protective equipment and other clothing using fabrics coated with it. The company is also working with manufacturing partners to produce healthcare and athletic apparel, military uniforms, medical dressings, and car and aircraft seats treated with PROTX2-AV. Other producers of antimicrobial textiles include Kolon Industries, Milliken & Company, Toyobo Co. Ltd., Unitika Ltd., Trevira GmbH, and Thai Acrylic Fibre Co. Ltd.

Sources: Kiran Pulidindi and Hemant Pandey, “Antimicrobial Textiles Market Size by Fabric (Polyester, Polyamide, Cotton), by Application (Healthcare, Apparels, Home Textile), by Active Agents (Metal & Metallic Salts, Synthetic Organic Compounds, Biobased Agents), Industry Analysis Report, Regional Outlook, Growth Potential, Price Trends, Competitive Market Share & Forecast, 2020 – 2026,” Global Market Insights Summary, April 2020 available online here; “Antimicrobial Textiles Market is Likely to Surpass $20.5 Billion by 2026, Says Global Market Insights Inc.,” CISION PR Newswire Press Release, April 19, 2020 available online here; Leslie Haddad, “A Beginner’s Guide: What is Antimicrobial Fabric?” February 16, 2017 available online here; “Textile Market Size, Share & Trends Analysis Report by Raw Material (Wool, Chemical, Silk, Cotton), by Product (Natural Fibers, Polyester, Nylon), by Application, by Region, and Segment Forecasts, 2020 – 2027,” Grand View Research Report Summary, February 2020 available online here; Susan Karlin, “With This Antiviral Fabric Coating, Your Clothing Could Protect You From COVID-19,” Fast Company, May 26, 2020 available online here.
Image source: skeeze, “surgery-instruments-surgeons-688380,” Pixabay, March 25, 2015 available online here.

Baby Apparel

baby apparel

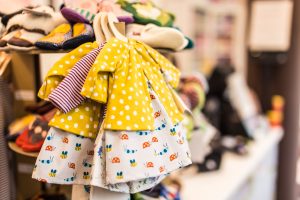
From low-priced onesies costing a couple of dollars to high-end ruffled dresses costing a couple of hundred dollars, baby apparel is the topic of this week’s post. Today’s market size shows global baby apparel revenues in 2018 and projected for 2025. Baby apparel refers to clothing for babies and toddlers 0 to 36 months old. 

In 2018, most of the clothing bought, more than 65%, was outerwear. When buying clothing parents look for convenience, comfort, and safety. Parents want clothing that can easily be put on a squirming child and clothing that will be easy to remove for diaper changes. They also want their child to be comfortable wearing the clothes, and they want their child to be safe in them. Most clothing made for babies worldwide is made of synthetic material with dyes that can cause skin irritation and rashes. This is especially a concern with underwear. As a result, parents are expected to increase spending on undergarments that are made from natural fiber and have antibacterial and antiviral protection. Flame retardancy is also a concern. While the United States has strict regulations, other countries may not, but more governments are expected to regulate their textile industries in the next few years and create policies to make baby apparel safer.

In addition to relying on regulations for safety, if there are any in the countries in which they live, parents are choosing clothing without drawstrings or adornments such as buttons and fancy laces that could be torn off or rip causing a child to trip or leading to a choking or strangling hazard. At the same time, new parents want stylish, durable clothing. Increasingly, fashion shows and exhibitions promoting baby apparel are being held around the world to showcase fashionable clothing lines. Some of these venues also launch new clothing lines for infants, toddlers, and children. Social media sites such as Facebook, Instagram, and Pinterest that allow parents to easily keep up with fashion trends are also influencing parents’ buying decisions.

Discounts offered on e-commerce sites such as Flipkart, Amazon, and Alibaba are increasing online shopping for baby clothes; however, in 2018, online revenues were a mere fraction of the revenues from offline channels. Sales at brick-and-mortar retail establishments comprised more than 75% of total global revenues. That being said, online sales are expected to increase faster than offline sales, at a compound annual growth rate of 6.1%, from 2019 to 2025. Carter’s, Inc.; Cotton On Group; Hennes & Mauritz AB; Gerber Childrenswear LLC; and Naartjie have been focusing on increasing their presence in brick-and-mortar stores to meet demand. In 2018, Carter’s Inc. had more than 1,000 stores in North America and more than 17,000 wholesalers. Other major manufacturers include Nike, Inc.; Gymboree Group, Inc.; and Industria de Diseño Textil, S.A. 

Geographic reference: World
Year: 2018 and 2025
Market size: $135.5 billion and $198.8 billion, respectively
Sources: “Baby Apparel Market Size, Share & Trends Analysis Report by Product (Outerwear, Underwear), by Distribution Channel (Offline, Online), by Region, and Segment Forecasts, 2019 – 2025, Grand View Research Report Summary, September 2019 available online here; “Baby Apparel Market Size Worth $198.8 Billion by 2025 | CAGR: 5.6%,” Grand View Research Press Release, September 2019 available online here; “Baby Clothing Market in the US 2015-2019,” Technavio Snapshot, April 2015 available online here; “Introduction to Japanese Underwear Designed While Putting the Safety of Babies First,” Pregnancy, Childbirth, Miki House, June 23, 2017 available online here.
Image source: Baby Natur, “Assorted-color Long-sleeved Dresses Photo,” Unsplash, June 14, 2019 available online here.

Personal Luxury Goods

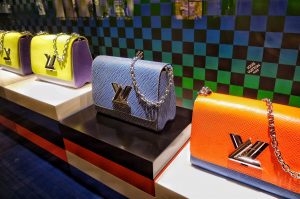
Personal luxury goods include high-end apparel, leather goods, accessories, watches, jewelry, perfume, beauty products and other high-end goods for personal use. Today’s market size shows the total global sales of personal luxury goods for 2018 and projected for 2025.1 Top companies in this sector, ranked by 2018 sales, include LVMH ($53.66 billion), EssilorLuxottica ($18.57 billion), Richemont ($16.05 billion), Kering ($15.71 billion), Swatch ($8.71 billion), Chow Tai Fook ($8.71 billion), Hermés ($6.88 billion), Ralph Lauren ($6.42 billion), Tapestry ($5.96 billion), and Capri Holdings ($5.38 billion).2

Traditionally consumers who wanted to purchase personal luxury goods shopped at specialty boutiques or high-end department stores such as Nordstroms, Bergdorf Goodman, or Saks Fifth Avenue. But, just as other brick-and-mortar retail establishments have been affected negatively by online retailers, so too have personal luxury goods retailers. Several online sites such as Net-a-Porter offer multiple brands of high-end merchandise for sale, free shipping and the convenience of shopping from home. Overall, in-store traffic decreased by 30% from 2012 to 2018. Still, according to EY Advisory, although more than 70% of purchases are influenced by online channels, nearly 90% of purchases are made in store.

Increasingly, many shoppers in their 20s through 40s who can afford high-end merchandise do not want to pay full price for their purchases. In addition, while many Millennials and Generation Z consumers want to be seen in new styles often, they are also concerned about sustainability. They see clothing resale and reuse as a way to conserve resources while also satisfying their want of a new wardrobe. Overall, 26% of luxury shoppers also buy secondhand. While wealthy consumers are unlikely to shop at places such as Goodwill or other thrift stores, they are shopping online at sites such as Fashionphile and TheRealReal which allow consumers to buy, sell and consign used luxury clothing and accessories and at sites such as Rent the Runway which allows consumers to rent high-end clothing for a monthly fee. Millennial and Generation Z consumers made a third of luxury purchases worldwide in 2018 according to Bain & Co. Purchases made by consumers in these two generations combined contributed to nearly all of the growth in the luxury goods sector in 2018.

Some luxury brands such as Gucci and Louis Vuitton have been opening boutique stores and expanding their website offerings in order to control their exclusivity while at the same time their merchandise is discounted at resale sites. Some luxury retailers are focusing on experiences and services to compete with online retail, resale, and rental sites by offering customers champagne and hors d’oeurves while they shop, having cafés and beverage bars in store, and hiring style advisors to help customers. Nordstrom partnered with Rent the Runway to offer customers the ability to drop off their Rent the Runway fashion items at their store. After learning that half their customers also buy or sell used merchandise, Neiman Marcus invested in a minority share of Fashionphile, however, they do not plan to sell secondhand merchandise in their stores or on their website.3 They may want to rethink that strategy, however. In ThredUp’s 2019 Resale Report, GlobalData, a retail analytics firm, found that 33% of consumers would buy more from luxury retailers if they offered secondhand clothing.

1 For the projected 2025 data, the source mentions the “luxury goods market.” The article in which this appears reports only on personal luxury goods, therefore, our editors assumed that this figure was for personal luxury goods only.
2 The source reports sales figures in euros. Our editors used the December 31, 2018 conversion rate of 1 Euro = 1.1466 U.S. dollars given on the Market Insider website here to convert the sales figures to U.S. dollars. Rankings do not include cosmetics companies. If they did the following companies would be in the top 10: L’Oréal ($30.84 billion), Estée Lauder ($13.99 billion) and Beiersdorf ($8.26 billion). Cosmetics sales include products at all price points.
3 Through the partnership with Fashionphile, Neiman Marcus has designated a few of their stores as drop-off points for customers who want to sell their merchandise on Fashionphile. Sellers receive an immediate quote from Fashionphile for their merchandise and immediate payment if they choose to sell. Neiman Marcus is hoping that customers will then want to use that payment to buy merchandise in their stores.

Note: Any mention of brands or companies in this post does not constitute an endorsement.

Geographic reference: World
Year: 2018 and 2025
Market size: $286.53 billion and $445 billion, respectively
Sources: Anne D’Innocenzio, “Luxury Stores Adapt to Changing Shoppers,” The Denver Post, December 29, 2019, pp. 1K, 6K; Florine Eppe Beauloye, “The 15 Most Popular Luxury Brands Online in 2019,” Luxe Digital, April 20, 2019 available online here; “Tailoring the Luxury Experience: The Luxury and Cosmetics Financial Factbook 2019 Edition,” EY Advisory S.p.A., 2019 available online here; ThredUp 2019 Resale Report, March 2019 available online here; Tom Ryan, “Are Secondhand Sales the Right Branding Move for Neiman Marcus?” RetailWire, April 23, 2019 available online here.
Original source: Bain & Co.
Image source: FranckinJapan, “bag-luxury-accessories-japan-ginza-2060110,” Pixabay, February 13, 2017 available online here. Use of image does not constitute an endorsement.

Diabetic Shoes

Diabetic shoesAccording to the World Health Organization, more than 400 million people in the world were living with diabetes in 2014, up from 108 million in 1980. The International Diabetes Federation predicts this number will reach 645 million by 2040. Type 1 diabetes, sometimes called juvenile or childhood-onset diabetes, occurs when a person’s immune system attacks the pancreatic cells that produce insulin. As a result, people living with Type 1 diabetes must take insulin on a daily basis. There is no known way to prevent Type 1 diabetes. Type 2 diabetes occurs when a person’s body cannot effectively use the insulin it produces. Most of the people with diabetes have this form of the disease, including 90-95% of people with diabetes in the United States. People with excess body weight and who are physically inactive are at a higher risk of contracting Type 2 diabetes as are those with a family history of Type 2 diabetes. Type 2 diabetes used to be called adult-onset diabetes, but in recent years this condition has been seen in children also. While some people with Type 2 diabetes can control their blood sugar with diet and exercise, others need medications to do so. Some classes of medications to treat Type 2 diabetes either help the body secrete more insulin or improve the body tissue’s sensitivity to insulin in order for the body to use it more effectively. In some cases, those with Type 2 diabetes have to take insulin also. Other types of diabetes include gestational diabetes, which occurs during pregnancy and goes away after the baby is born; monogenic diabetes, which is an inherited form of diabetes; and cystic fibrosis-related diabetes.

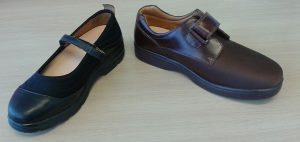
If a person’s blood sugar is not properly controlled, high blood glucose levels can contribute to an increased risk of heart disease, stroke, kidney disease, eye problems, dental disease, nerve damage, poor circulation and foot problems. Because of poor circulation, any injury to the foot may take longer to heal or lead to infection. If there is nerve damage, a person may not realize that they have a foot injury and the problem could be exacerbated. Nerve damage can also change the shape of the foot making regular shoes feel uncomfortable. Diabetic shoes are a type of orthopedic shoe for people with neuropathy, nerve damage, a foot deformity or an existing foot injury. They are designed to relieve excess pressure on the foot, reduce shock, reduce joint motion and provide extra room for custom orthotics. These shoes can be custom-made from a mold of a person’s foot to provide a better fit.

Today’s market size shows the total global sales of diabetic shoes in 2015 and projected for 2024. In 2015, more than half of sales—$2.54 billion—were in the United States. As the number of people with diabetes increases, the population ages, disposable incomes rise, and innovations in design create more comfortable and stylish shoes, the market for diabetic shoes is expected to grow at a compound annual growth rate of 8.1% from 2016 to 2024.

Geographic reference: World
Year: 2015 and 2024
Market size: $5.0 billion and $9.9 billion, respectively
Sources: “Diabetic Shoes Market,” Transparency Market Research Report Preview, February 2017 available online here; “Diabetes,” World Health Organization, November 15, 2017 available online here; “What is Diabetes?” National Institute of Diabetes and Digestive and Kidney Diseases, November 2016 available online here; Stephanie Watson and Kathryn Watson, “Do I Need Diabetic Shoes?” Healthine, July 15, 2016 available online here; “Type 2 Diabetes,” Mayo Clinic available online here.
Image source: Brainy J [CC0], from Wikimedia Commons, July 8, 2014 available online here.

Women’s Footwear in China

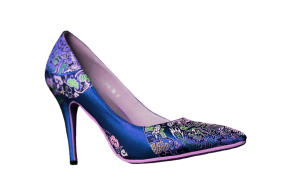
Women's footwearWhere were your shoes made? More than 60% of shoes sold globally are manufactured in and exported from China. In China, the market for women’s footwear has seen a compounded annual growth rate of 8.7% over the past 5 years. As disposable income rises, many consumers want to buy higher quality footwear. Several foreign luxury brands such as Bally, Christian Louboutin, Gucci, and Louis Vuitton, to name a few, are courting the Chinese consumer by using social media marketing and partnerships with Chinese influencers and celebrities, as well as employing Chinese actresses as spokespersons in order to increase their market share. Today’s market size shows the total sales of women’s footwear in China in 2016 and 2018. The figure for 2018 is projected.

Geographic reference: China
Year: 2016 and 2018
Market size: 224.7 billion RMB ($33.8 billion) and more than 260 billion RMB ($39.1 billion), respectively
Sources: Christine Lee, “Fashion Houses Fight for Market Share in the Booming Chinese Shoe Market,” Jing Daily, July 19, 2018 available online here.
Image source: Capri23auto, “high-heeled-shoes-pumps-2812638,” Pixabay, November 2017 available online here.

Leggings

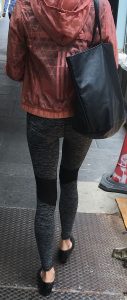
Woman wearing leggingsWhat’s old is new again. This can be said for leggings, the current and sometimes controversial fashion trend. Leggings, in some form, have been around for centuries. Originally leggings referred to leg coverings of various sorts, not necessarily pants. In the past, some Native Americans wore leggings that looked like high-top moccasins or boots. They were made out of deer, elk, and other game animals. This clothing protected the legs and ankles from plants and animals. It also served to cover women’s ankles for proper etiquette at the time.

In Europe and Colonial America, leggings referred to something resembling thick stockings. In the 18th century, in order to keep their legs warm men wore leggings that covered the leg from a few inches above the knee down to the top of the foot. These were made of wool, linen or leather. Military leggings of various forms were worn by soldiers from the late 19th century until the first part of World War II in order to prevent dirt, sand, and mud from getting into soldiers’ shoes. They also provided ankle support. In 1943 field boots replaced leggings in the U.S. Army. However, other branches of the military continued to use military leggings until the 1960s.

During World War II, due to the high demand for rubber, chemical companies were trying to invent a rubber alternative. In the process, DuPont chemist Joseph Shivers invented Lycra, also known as spandex, in 1959. In the 1960s more women were wearing pants and casual dress was trending. Fashion designers started using this new fabric in their pant designs. Leggings became “tight-fitting trousers made of a stretch fabric, worn especially by women and girls,” according to the 1970s version of the Oxford Dictionaries. Modern leggings are made of cotton, polyester, spandex, nylon, or leather.

After waning in popularity, leggings became popular in the 1980s again, this time as part of the gym-wear-as-fashion trend influenced by Jane Fonda and the aerobics craze. According to anthropologist Kaori O’Connor, leggings “became closely associated with workout culture and youth.”1 In the 2000s, leggings, or yoga pants, became popular with all ages of women and not just to wear to the yoga studio. Leggings are now worn at the gym, as casual wear around town, and in dressier situations, including at the office. In 2007 at the Marni Men’s show during Fall 2007 Fashion Week leggings designed for men were introduced, but this never caught on with the wider public.

Today’s market size shows the expected revenue earned from the worldwide sale of leggings in 2018 and projected for 2023. In 2017, the United States imported more women’s elastic knit pants than women’s blue jeans according to the U.S. Census Bureau. Since 2010 the sale of women’s blue jeans has been declining by 3.9% annually in the United States. Sales of elastic knit pants grew 25.7% per year on average during this same time period. In response to customer preferences, some blue jeans companies are adding stretch and moisture-wicking properties to their denim. Who manufactures leggings? Traditional athletic wear companies, such as Nike, Under Armour, and Adidas; high-fashion labels such as Tommy Hilfiger and Calvin Klein; and even traditional lingerie brands such as Victoria’s Secret, just to name a few.

1 Olivia B. Waxman and Melissa Chan, “How Leggings Became the Most Controversial Pants,” Time, March 27, 2017

Geographic reference: World
Year: 2018 and 2023
Market size: $23.17 billion and $30.87 billion
Sources: Stephan Marwa, “Global Leggings Market Size to Worth USD 30.87 Billion by 2023,” Healthcare Journal Press Release, April 9, 2018 available online here; Olivia B. Waxman and Melissa Chan, “How Leggings Became the Most Controversial Pants,” Time, March 27, 2017 available online here; “Leggings,” Wikipedia, April 17, 2018 available online here; David Yanofsky, “The US is Now Buying More Stretchy Pants Than Blue Jeans,” Quartz, March 1, 2018 available online here; and Audie Cornish, “Denim Companies Stretch to Compete With Leggings,” All Things Considered on NPR, April 9, 2018 available online here.
Image source: By Nicole.elocin [CC BY-SA 4.0], from Wikimedia Commons

Driving Apparel

motorsports driving apparelMotorsports describes a group of competitive sporting events in which motorized vehicles are used. Automobiles, motorcycles, boats and snowmobiles are some of the vehicles used in these types of competitions. Not all are racing competitions, however. Drifting and tractor pulling are two non-racing motorsports.
From 2015 to 2020, the global motorsports market is expected to grow at a compounded annual growth rate of nearly 10%, reflecting the popularity of the sport. Participating in this sport is dangerous and requires specialized driving apparel—helmets, jackets, gloves, boots, and other protective clothing—in order to keep the drivers of the vehicles safe. This apparel is usually thicker and heavier than regular clothing, heavily padded, and in some cases contains armor.

Today’s market size shows the amount spent globally on specialized driving apparel in 2016 and spending projections for 2025. The market is expected to grow between 2017 and 2025 primarily due to laws and regulations mandating the use of protective clothing and the drivers themselves concerned about their safety. The Asia-Pacific region spent nearly $4.5 billion on driving apparel in 2016, accounting for more than one-third of the total global spending on this type of apparel that year.

Geographic reference: World
Year: 2016 and 2025
Market size: $12.03 billion and $18.56 billion respectively
Sources: “Global Driving Apparel Market Size US$18.565.0 mn by 2025 | CAGR: 5.3% – Transparency Market Research,” Nasdaq GlobeNewswire Press Release, November 29, 2017 available online here; “Driving Apparel Market,” Transparency Market Research Press Release, November 6, 2017 available online here; “Motorsports Market Analysis: By Channels (Broadcasting Revenue In Motorsports Market, Ticketing Revenue in Motorsports Market and Others) and by Geography (Americas, APAC and Europe) – With Forecast (2015-2020),” Cision PR Newswire Press Release, April 21, 2016 available online here; “Motorsport,” Wikipedia, January 12, 2018 available online here; “Drifting (Motorsport),” Wikipedia, January 11, 2018 available online here.
Image source: sms467, “superbike-motorsport-fast-speed-930715,” Pixabay, September 11, 2015 available online here. Use of the image does not constitute endorsement of the brands shown.

Back-to-College Spending

According to the National Center for Education Statistics fall college enrollment in 2010 was 21.0 million. Enrollment declined to 20.2 million in 2014 but is projected to increase to 20.9 million in 2017. Today’s market size shows the total amount spent on back-to-college items by students and their families in 2010, 2014 and 2017. The figure for 2017 is projected. In 2017, back-to-college shoppers plan on spending the most on electronics ($12.8 billion), followed by clothing ($8.0 billion) and snacks and other food items ($7.5 billion). Spending on dorm and apartment furnishings came in fourth at $5.9 billion. Spending on school supplies ranked seventh at $3.9 billion.

Geographic reference: United States
Year: 2010, 2014 and 2017 projected
Market size: $45.88 billion, $48.48 billion and $54.18 billion respectively
Sources: Smith, Ana Serafin, “Back-to-School and Back-to-College Spending to Reach $83.6 Billion,” National Retail Federation Press Release, July 13, 2017 available online here; U.S. Department of Education, National Center for Education Statistics, “Table 303.10. Total Fall Enrollment in Degree-Granting Postsecondary Institutions, by Attendance Status, Sex of Student, and Control of Institution: Selected Years, 1947 through 2025,” Digest of Education Statistics: 2015, December 2016 available online here.
Original source: Prosper Insights & Analytics

Back-to-School Spending

School days, school days
Dear old Golden Rule days
Reading and ‘riting and ‘rithmetic
Taught to the tune of a hick’ry stick
You were my queen in calico
I was your bashful, barefoot beau
And you wrote on my slate, “I Love You, Joe”
When we were a couple o’ kids
— Chorus of the popular American song School Days written by Will Cobb and Gus Edwards in 1907

While reading, writing, and arithmetic are still part of the curriculum, back-to-school supplies have changed quite a bit over the past century or more. Slates have been replaced by notebooks, laptops, and tablets, supplies that are on many a child’s back-to-school shopping list this year along with clothing, shoes, calculators, folders, pencils, backpacks, and lunchboxes.

Today’s market size shows the amount spent on back-to-school items for children in kindergarten through 12th grade in 2007, 2016 and 2017. Figures for 2017 are projected. While parents and guardians do most of the back-to-school spending, the National Retail Federation found that preteens and teenagers plan on spending more of their own money on school supplies in 2017 than they have in the past.

Geographic reference: United States
Year: 2007, 2016 and 2017 projected
Market size: $18.48 billion, 27.38 billion and 29.58 billion respectively
Sources: Smith, Ana Serafin, “Back-to-School and Back-to-College Spending to Reach $83.6 Billion,” National Retail Federation Press Release, July 13, 2017 available online here; “School Days (1907 song),” Wikipedia, December 2016 available online here.

Plus-Size Clothing

Plus-size clothing are generally found in specialty clothing stores or out-of-the-way places in mainstream clothing stores. In 2017, some retailers are experimenting with combining the non-plus-size clothing and the plus-size clothing on the same racks in the same section of their stores. According to Paco Underhill, author of Why We Buy: The Science of Shopping, “[p]art of what they’re trying to do is recognize we live more in a size 12 or 14 or 16 world than we do a size 4 (one)…In a hypermarket store…where you’re selling both clothing and groceries and furniture and electronics and liquor, they want to be very careful not to turn someone off… If you are making that woman feel awkward about shopping for clothing, maybe she won’t buy her dishwasher soap or wine there, also.”

Geographic reference: United States
Year: 2013 and 2016
Market size: $17.4 billion and $20.4 billion respectively
Source: Zlati Meyer, “Meijer to Mix Misses, Plus Sizes,” Lansing State Journal, November 6, 2016, page 26A.
Original source: NPD Group

Sneaker Resale Market

When one hears the word collectibles one may think of antiques, figurines, baseball cards or comic books. But something many of us wear on a daily basis has also become a collectible: sneakers. Rare sneakers are now being sold through social media and at trade shows. In some cases, shoes bought at retail for $200 four years ago are now listed at close to nine times that. In some cases, sneakerheads—as buyers and sellers of rare sneakers are called—are paying more than $5,000 a pair for the most coveted styles.

In the United States, about 9 million pairs of sneakers are resold each year. Today’s market size shows the estimated value of the sneaker resale market in the United States in 2016.

Geographic reference: United States
Year: 2016
Market size: $1.2 billion
Source: Diamond, Michael L., “Teen Finds Fortune, Heartbreak in Sneakers,” Lansing State Journal, August 28, 2016, page 6B.

Apparel Exports from Bangladesh

The enormous loss of life resulting from the collapse of a garment factory in Bangladesh a few weeks ago has brought the media spotlight onto that country, as well as the global network of low-end apparel manufacturing. Bangladesh, with a population of approximately 164 million, is the world’s second-largest exporter of apparel. The first largest is China with 1.35 billion people.

Today’s market size is the value of all apparel exports from Bangladesh last year. Of that total, a quarter came as general imports to the United States ($4.47 billion).

Geographic reference: Bangladesh
Year: 2012
Market size: $18 billion
Source: Adam Davidson, “Clotheslined,” The New York Times Magazine, May 19, 2013, pages 16-17.
Original source: A&M University, Texas, Prof. Munir Quddus
Posted on May 20, 2013

The Clothes We Buy

The decline of apparel manufacturing in the United States is an interesting development and outcome of globalization over the last decade or two. It is estimated currently that only 2% of apparel purchased in the United States is made in the United States.

Today’s market size is the value of imported apparel and accessories into the United States in 2002 and 2012.

Geographic reference: United States
Year: 2002 and 2012
Market size: $62.31 and $81.19 billion respectively
Source: “U.S. International Trade Statistics,” (315 Apparel and Accessories), a searchable database presented by the Census Bureau and available online here.
Original source: U.S. Department of Commerce, Bureau of the Census
Posted on May 6, 2013

Formal Wear & Costume Rental Services

Formal Wear Rentals and GDP

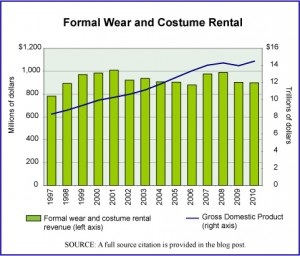
The service sector of the U.S. economy is divided into many subsectors, one of which is the Rental and Leasing Services sector, designated in the North American Classification System with the number 532. This subsector covers activities as diverse as car rental firms, the leasing of office equipment, and the rental of formal wear and costumes. Today’s market size post looks at the last of these items, the business of renting formal wear and costumes, which has held its own over time but has not kept up with the growth of the economy generally.

The graph shows revenue for businesses engaged in renting formal wear and costumes from 1997 through 2010 and by way of comparison, the gross domestic product is presented on the graph as a line.

Geographic reference: United States
Year: 2010
Market size: $899 million
Source: “Table 5.1. Real Estate and Rental Leasing Services (NAICS 53)—Estimated Revenue for Employer Firms: 2002 Through 2010,” February 2, 2012, one of the tables in the 2012 Service Annual Survey, available from the Census Bureau website here. Data used in the graph come from earlier editions (2003) of the Service Annual Survey, available from the Census website here.
Original source: U.S. Department of Commerce, Bureau of the Census
Posted on December 5, 2012

Apparel Consumption

Clothes, we all wear them and yet for the apparel industry what matters is fashion. It is through changing fashions that people are most often lured into buying more clothes than are strictly necessary. For many, of course, clothes buying is an entertainment.

Per capita spending on apparel in the United States peaked for the first decade of the new century in 2005 and then fell, gaining downward momentum with the onset of the recession and the financial crisis that followed. Complicating the downward spiral is the fact that apparel companies were caught somewhat off guard by the sharp decline in spending which led to excess inventories. As these were liquidated, overall apparel prices declined.

Today’s market size is a measure of the apparel industry based on per capita spending in the United States.

Geographic reference: United States
Year: 2005 and 2010
Market size: Annual, per capita spending of $1,276 and $1,136 respectively
Source: “Table 3. Age of Reference Person: Average Annual Expenditures and Characteristics,” Consumer Expenditure Survey, 2005 and 2010, U.S. Bureau of Labor Statistics, available here
Original source: U.S. Labor Department
Posted on March 21, 2012

Clothing Stores

The sale of clothing in the United States is done through a variety of retail outlets, only a portion of which are stores dedicated primarily to the sale of clothes. Today’s market size is the value of all sales made through clothing stores in 2010. Of the total, family clothing stores had the largest share, accounting for 54% of the sales. The other clothing store segments, with their share of total clothing store sales, are as follows: women’s clothing (23%), men’s clothing (4.9%) and all other clothing stores (7.2%).

Geographic reference: United States
Year: 2010
Market size: $158.8 billion
Source: “Estimates of Monthly Retail and Food Services Sales by Kind of Business: 2010,” Monthly Retail Trade Report, available online here.
Original source: U.S. Census Bureau
Posted on January 9, 2012

Clothes Stores

The sale of clothes through clothing stores is tracked by the U.S. Census Bureau by type of store: men’s clothing, women’s clothing and family clothing. In the year 2000 men’s clothing stores accounted for 9% of the category and fell to 6% by 2009. Women’s clothing stores also saw its share decline as a percent of the category from 29% in 2000 to 26% in 2009. More of us are buying our clothes at general merchandising stores and clothes stores that sell a fuller line of apparel, family clothing stores.

Today’s market size is the estimated total of sales by clothing stores in the United States in 2000 and 2009. These sales totals do not include retailers categorized under the heading general merchandisers, including department stores and warehouse clubs.

Geographic reference: United States
Year: 2000 and 2009
Market size: $118.2 billion and $152.3 billion respectively
Source: “Estimated Annual Sales of U.S. Retail and Food Service Firms by Kind of Business: 1998 Through 2009,” Annual Retail Trade Survey—2009, available in a PDF format here. For links to these data as well as earlier U.S. Annual Trade Survey data, check this Census Bureau site.
Original source: U.S. Bureau of the Census
Posted on October 13, 2011

The Business of Weddings

Today’s market size is an estimate of the size of the entire wedding industry in the United States—we take some license in using the word “industry” here. The things included in measuring the size of the wedding industry are many, from planning, apparel and jewelry through the ceremony, flowers, food, reception and honeymoon.

Geographic reference: United States
Year: 2010
Market size: $47.2 billion
Source: Toon Van Beeck and George Van Horn, “Wedding Bells are Ringing,” The RMA Journal, December 2010-January 2011, page 22-27, available online here.
Original source: IBISWorld
Posted on October 5, 2011

Apparel Sales

The market size presented here is based on estimates of the total retail sales value of all apparel sold in the United States in 1999 and ten years later, in 2009. The retail value of apparel sales over this period grew by 37.4% but when adjusted for inflation, that growth rate was actually only 8.4% for the period. By way of comparison, U.S. population growth over this period was 10.1% (from 279.3 million to 307.4 million). Worth noting, however, is the fact that while population had a steady growth rate over this period, the measure of growth between two points in time for something like apparel sales may be deceptive. In 2006, for example, retail sales of apparel in the United States were probably much higher than in 2009, a recessionary year.

Geographic reference: United States
Year: 1999 and 2009
Market size: $222 and $305 billion respectively
Source: Alva, Marilyn, “Consumers Are Spending Again But They’re Picky,” Investor’s Business Daily, January 4, 2011, page A5.
Original source: Credit Suisse

Online Sale of Clothes and Shoes

The market size presented here is the total value of clothing and shoes that were sold electronically in 2003 and 2008. It is interesting to see that online sales of clothes and shoes have grown briskly over this five-year period since it was believed that such merchandise would be harder to sell online than other things, things that people would not wish to try on before purchasing. Four Census Bureau product codes are included in this market size calculation, they are 20200 (Men’s wear); 20220 (Women’s wear); 20240 (Children’s clothes), and 20260 (Footwear).

Geographic reference: United States (based on the location of the selling entity)
Year: 2003 and 2008
Market size: Sales: $5.13 and $17.06 billion respectively, representing a 233% increase.
Source: “Table 1055. Electronic Shopping and Mail-Order Houses—Total and E-Commerce Sales by Merchandise Line,” Statistical Abstract of the United States: 2011, U.S. Census Bureau, page 663, available online here in a spreadsheet format, and here as a PDF file.
One word of clarification to help prevent any confusion about just what is being presented here. The data in the source table are provided in two columns per year, the first one called “Total,” and the second is “E-Commerce”. The column headed “Total” refers to the total sales for the industry “Electronic Shopping and Mail-Order Houses,” [NAICS 4541], and the second column is the e-commerce portion of that industry’s total. Do not confuse the “Total” column for a measure of total sales of the product line listed in that row. It is, rather, the total sales of that product line made electronically and through mail-order houses.
Original source: U.S. Department of Commerce, Bureau of the Census.