Coconut Milk Powder

coconut milk
Geographic reference: World
Year: 2019 and 2027
Market size: $52.5 million and $113.0 million, respectively
Sources: “Coconut Milk Powder Market Size, Share & Trends Analysis Report by Product (Organic, Conventional), by Application (B2B, B2C), by Distribution Channel (Offline, Online), by Region, and Segment Forecasts, 2020 – 2027,” Grand View Research Report Summary, June 2020 available online here; “Coconut Milk Powder Market Size Worth $113.0 Million by 2027 | CAGR 10%: Grand View Research, Inc.,” CISION PR Newswire, June 16, 2020 available online here; Boriana Slabakova, “The Age of Veganism,” Health Careers Blog, January 7, 2020 available online here.
Image source: Adapted from: Tijana Drndarski, “Raw Coconut Products, Coconut Flakes and Coconut Milk,” Pixabay, May 2, 2020 available online here.

Sixty-five percent of the global population is lactose intolerant, including 90% of the people in the Asia-Pacific region. In addition, the rise in health consciousness coupled with the rise in veganism has consumers worldwide seeking dairy alternatives. As of January 2020, the global market for dairy alternatives totaled $18.12 billion, a 144.9% increase from $7.4 billion in 2010. Plant-based milk constitutes 13% of the entire milk market and more than 50% of the vegan food market. Coconut milk powder is one type of dairy alternative that is expected to see significant growth in the near future.

Today’s market size shows coconut milk powder revenues for 2019 and projected for 2027. For consumers who like to buy in bulk and for those that cannot buy liquified coconut milk on a regular basis, coconut milk powder, with its long shelf life, is a convenient alternative. For many cultures such as Brazilian, Burmese, Indian, Thai, Indonesian, Hawaiian, Singaporean, Sri Lankan, and Vietnamese among others, it is considered a staple of their cuisine. Because of this, the Asia-Pacific region held a third of the market in 2019.

Commercially, coconut milk powder is used to prepare smoothies, shakes, ice creams, cakes, donuts, sauces and gravies. The growing demand for vegan ice cream and desserts at dine-in hotels and quick-service restaurants is expected to contribute to growth in the business-to-business (B2B) sector. In 2019, more than 66% of sales were in the B2B segment. The business to consumer segment is expected to have the fastest growth rate, a compound annual growth rate of 10.7% from 2020 to 2027.

Conventional coconut milk powder was the first type to be introduced to the market. In 2019, it claimed more than 70% of revenues. While it is more economical than the organic variety, organic coconut milk powder revenues are expected to grow the fastest through 2027 due to increased demand for organic products in general, products without chemical fungicides, herbicides, or insecticides and grown in an eco-friendly way.

Most manufacturers are small, catering to local markets. Some larger manufacturers include Nestlé Inc., Anthony’s Goods, BareOrganics, Bramble Berry Inc., Dr. Ben Kim Natural Health Solutions, Enerhealth, Grace Foods Canada Inc., Healthworks, King Arthur Flour Company Inc., and KOS.

Kombucha

kombucha
Geographic reference: World
Year: 2019 and 2027
Market size: $1.67 billion and $7.05 billion, respectively
Sources: “Kombucha Market Size, Share & Trends Analysis Report by Flavor (Original, Flavored), by Distribution Channel (Supermarkets, Health Stores, Online Stores), by Region, and Segment Forecasts, 2020 – 2027,” Grand View Research Report Summary, February 2020 available online here; “Kombucha Market Size Worth $7.05 Billion by 2027 | CAGR: 19.7%: Grand View Research, Inc.,” CISION PR Newswire, February 10, 2020 available online here; “Kombucha,” Wikipedia, May 24, 2020 available online here; “Kombucha FAQ,” Kombucha Brewers International available online here; Laura Zhang, “The Cloudy Origins of Kombucha,” Smithsonian Center for Folklife and Cultural Heritage Magazine, April 15, 2019 available online here; “Sugary Drink Tax,” Wikipedia, May 27, 2020 available online here; “Obesity and Overweight: Key Facts,” World Health Organization, April 1, 2020 available online here; “10 Facts on Obesity,” World Health Organization, October 2017 available online here; Christina Troitino, “Kombucha 101: Demystifying The Past, Present And Future Of The Fermented Tea Drink,” Forbes, February 1, 2017 available online here; “#68 Kombucha: Tea of Immortality,” Food Non-Fiction, June 18, 2018 available online here.
Image source: Tim-Oliver Metz, “Close Up Shot of a Kombucha Fermenting,” Unsplash, March 5, 2020 available online here.

Kombucha is a fizzy, sweet-and-sour, fermented beverage made from tea leaves, sugar, Symbiotic Colony of Bacteria and Yeast (SCOBY), and flavorings. Brewing this beverage involves first steeping tea leaves in hot sugar water. Then, once the sweetened tea is cooled, the leaves are removed and the SCOBY is added. The mixture is poured into a sterilized container with previously fermented kombucha. The container is then covered with a breathable fabric and left to ferment for 10 to 14 days at room temperature. After, the new SCOBY that has formed is removed along with some of the newly fermented tea. The remaining kombucha is strained and bottled for a second fermentation then refrigerated to slow the carbonation and fermentation processes.

Kombucha is thought to have originated in Manchuria, possibly as far back as 221 B.C. Ancient East Asian cultures drank kombucha as a health remedy. Practitioners of traditional Chinese medicine called it the “tea of immortality” or the “elixir of life.” The name “kombucha” may have derived from the combination of the name of a Korean doctor who brought the fermented tea to Japan to treat Emperor Inkyo’s digestive ailments, Dr. Kombu, and “cha”, the Japanese word for tea.

By the late 1800s, the drink was reportedly consumed in Russia and Ukraine. Demand increased in Europe in the mid-20th century. In the early 1990s, the beverage was popular with those with HIV and AIDS who believed that it would help their immune systems and increase their T-cells. Some doctors, however, warned that the beverage was dangerous. Homemade brews may contain aspergillus, a toxin-producing fungus. Pregnant women, the elderly, children, and those with compromised immune systems were discouraged from drinking it. In 1995 the U.S. Centers for Disease Control and Prevention issued a report linking the death of one woman and the illness of another from severe metabolic acidosis to their daily consumption of kombucha. Although not cited as a definitive cause, kombucha consumption declined thereafter. 

In the late 1990s, commercially bottled kombucha became available and by the early 2000s, kombucha was back in favor as those following low-carbohydrate diets searched for a healthy drink to replace sugary soda and juices. Kombucha’s popularity also rose as part of the larger probiotic food consumption trend. Probiotic foods contain bacteria which some studies show benefit digestion and improve the immune system. As consumers look for ways to eat healthier and boost their immune system during the COVID-19 pandemic, kombucha consumption is expected to increase even more.

Today’s market size shows global revenues for kombucha in 2019 and projected for 2027. To increase sales companies are investing in new product development and new flavors. They are also increasingly using social media influencers to market their products online. Online sales are expected to exceed $2.4 billion in 2027, or 34% of sales for that year. Supermarket sales claimed the largest share in 2019 due to easy accessibility. Most supermarkets also offer higher discounts and more promotional offers than smaller health food stores due to their ability to buy higher volumes of product. Supermarkets can also stock a greater variety of products.

Worldwide, flavored kombucha constituted nearly 75% of the market in 2019. Brewers are expected to increase their use of natural extracts and flavorings as well as increase their use of exotic flavorings through 2027, contributing to an expected compound annual growth rate (CAGR) of 21.8%. Sales of original flavored kombucha are expected to expand at a CAGR of 20% over this time period. 

North America held a 52% share of the global market. An increasing middle-class population and increasing demand for non-carbonated, low-calorie beverages are expected to contribute to higher sales through 2027. The popularity of sports and energy nutrition products among working professionals in Europe is expected to contribute to increased consumption in that region as is more product offerings from large companies such as PepsiCo, The Coca-Cola Co., and Starbucks Coffee Co. Worldwide, the obesity epidemic — obesity has tripled since 1975, contributing to 2.8 million deaths per year — and taxes on sugary beverages are also expected to drive revenue growth for kombucha beverages.

The global market is fragmented with many small and medium-sized companies producing kombucha. Some leading producers include GT’s Living Food, PepsiCo; Reed’s Inc., The Hain Celestial Co., KeVita Inc., Buchi Kombucha, LIVE Beverages, and RedBull.

Enzymes

enzymes in laundry detergent
Laundry detergent. Enzymes in laundry detergent allow clothes to be washed in cold water.
Geographic reference: World
Year: 2019 and 2027
Market size: $9.9 billion and $17.2 billion, respectively
Sources: “Enzymes Market Size, Share & Trends Analysis Report by Application (Industrial Enzymes, Specialty Enzymes), by Product (Carbohydrase, Proteases, Lipases), by Source, by Region, and Segment Forecasts, 2020 – 2027,” Grand View Research Report Summary, March 2020 available online here; “Enzymes Market Size Worth $17.2 Billion by 2027 | CAGR 7.1%: Grand View Research, Inc.,” CISION PR Newswire, March 16, 2020 available online here; Sindhu Raveendran, et. al., “Applications of Microbial Enzymes in Food Industry,” Food Technology & Biotechnology, March 2018 available online at the U.S. National Library of Medicine, National Institutes of Health here; JanMaarten van Dijl and Michael Hecker, “Bacillus Subtilis: From Soil Bacterium to Super-secreting Cell Factory,” Microbial Cell Factories, January 14, 2013 available online here; “A Global Fermentation Approach,” Leaf by Lesaffre available online here; “Specialty Enzymes Market Worth $6.6 Billion by 2025,” MarketsandMarkets Press Release, April 20, 2020 available online here.
Image source: habelfrank, “washing-powder-detergent-1500058,” PIxabay, July 7, 2016 available online here.

Enzymes are proteins that act as catalysts. Enzymes in the body run cellular processes and convert food to energy and to building blocks for proteins, lipids, nucleic acids, and some carbohydrates. Industrial enzymes such as proteases, amylases, lipases, and others are used in various applications: in the food and beverage industry, in detergents, animal feed, biofuels, textiles, pulp and paper, nutraceuticals, personal care products and cosmetics, wastewater treatment, and medications. In 2018, 60% of industrial enzymes on the market were proteases. In Europe, 900 tons of protease enzymes are used for detergents alone every year.

Today’s market size shows the global enzyme revenues for 2019 and projected for 2027. Microorganism-based enzymes comprised the vast majority of the industrial enzyme market in 2019, about 85%, followed by animal-based and plant-based enzymes. Microorganisms are preferred as a source due to their more predictable and controllable enzyme content. This type of enzyme can also be produced in a cost-effective manner with less space and time necessary than animal-based or plant-based enzymes. There are three types of microorganism-based enzymes: bacterial, fungal, and yeast. Bacterial enzymes are mostly sourced from Bacillus. They’re used in food and detergent and in pharmaceutical applications to diagnose diseases, promote wound healing, and kill disease-causing microorganisms. Fungal enzymes are used in the preparation and production of soy sauce, beer, baked goods, processed fruits, and dairy products. Yeast is used in beer, baked goods, and industrial ethanol production.

Increased investment in biotechnology research for the development of specialty enzymes for medicinal and diagnostic purposes is one of the main factors driving product demand globally. Increasing demand from the food and beverage, biofuel, animal feed, and home cleaning sectors along with the growing consumption of functional foods will contribute to the growth in the market through 2027. By region, growing biofuel production in North America and Europe, as well as increasing meat production in Europe and the Russian Federation, are expected to contribute to growth in these regions. Enzymes are used extensively in meat processing to improve the tenderness of the meat. Europe was third behind China and North America in meat production in 2018. The top three companies in this industry—Novozymes, DuPont Danisco, and DSM— claimed more than 75% of the market in 2019.1 Other major companies in this industry include BASF SE, Associated British Foods PLC, Chr. Hansen Holding A/S, and Advanced Enzyme Technologies.

1 Source: Grand View Research. The press release from CISION PR Newswire mentioning the same Grand View Research report states that the top 3 companies are Novozymes, DuPont Danisco, and BASF SE.

Plastic Compounding

plastic compounding - plastic thumb tacks
Plastic compounding is a method of changing the characteristics — physical, electrical, thermal, or aesthetic — of thermoplastics. It is the third step in plastics production, after acquiring the raw material and synthesizing the polymers. Depending upon what characteristics the final product should have, a base resin is selected and then specific additives, reinforcers, or fillers are incorporated into the compounded plastic using a melting and blending process. Pellets of this compounded plastic are sent to the customer for sheet extrusion or injection molding.

Today’s market size shows revenues for plastic compounding in 2019 and projected for 2027. Global plastics production continues to increase. In 2018, 359 million metric tons of plastic were produced, up from 245 million metric tons a decade earlier. The increasing use of plastic as a substitute for products traditionally made of glass, metal, wood, natural rubber, and man-made materials such as concrete will drive growth in this industry. There is also a growing demand for plastic in various industrial applications due to its versatility, easy molding, and ability to form a desired shape.

Automotive applications claimed the highest market share, about 25%, in 2019 owing to the greater reliance on plastics in automotive components. Packaging, electrical and electronics, building and construction, and consumer goods round out the top 5 applications in terms of market share. All 5 together comprised more than 75% of the plastic compounding market. Although medical devices claimed a very small share in 2019, this is expected to expand in 2020 while the automotive application share declines. As the world battles COVID-19, demand for personal protective equipment and some medical devices, made with plastics, has skyrocketed. At the same time, automotive plants worldwide shut down the production of vehicles while many retooled to build ventilators, respirators, and plastic face shields.

The Asia-Pacific region held the largest share of the market in 2018 due to a growing number of plastics manufacturers locating there and an expanding manufacturing sector. The region is the largest producer and consumer of automobiles, consumer goods, and packaging materials and one of the largest producers and consumers of electrical and electronic products. Most producers are involved in at least one of the segments of the plastics industry. Globally, more than 60% of plastic compounders are small and medium-sized businesses, many expanding their production capabilities. Major corporations such as automotive manufacturers and Original Equipment Manufacturers tend to contract with compounders who cater specifically to their company’s needs. Chinese compounders, however, tend to work with a large number of small to medium-sized businesses. Some leading global plastics compounders include BASF SE, LyondellBasell Industries N.V., The Dow Chemical Co., SABIC, Asahi Kasei Plastics, and Covestro (Bayer Material Science).

Geographic reference: World
Year: 2019 and 2027
Market size: $59.10 billion and $104.41 billion, respectively
Sources: “Plastic Compounding Market Size, Share & Trends Analysis Report by Product (PP, PET, TPV, TPO, PVC, PBT, ABS), by Application (Automotive, Electrical & Electronics, Construction), and Segment Forecasts, 2020 – 2027,” Grand View Research Report Summary, February 2020 available online here; “Plastic Compounding Market Size Worth $104.41 Billion by 2027: Grand View Research, Inc.,” CISION PR Newswire, March 3, 2020 available online here; “What is Plastic Compounding,” Marval Industries Inc. available online here; “Global Plastic Production from 1950 to 2018 (in Million Metric Tons),” Statista, October 2019 available online here; Jack R. Nerad, “How Car Companies are Helping to Produce Medical Personal Protective Equipment (PPE),” J.D. Power, March 24, 2020 available online here.
Image source: annca, “pin-pinn-needle-thumbtack-plastic-3092912,” PIxabay, January 20, 2018 available online here.

Extruded Snacks

extruded snacks - Goldfish crackers
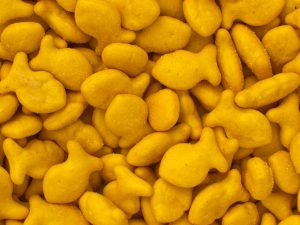
Extruded snacks are processed food products made from a combination of ingredients that are either pushed through a mold or precision cut. Extrusion allows for mass food production and uniformity of the final product. Extruded snacks are produced from starches — potatoes, rice, corn, tapioca, mixed grains, and others — and are high in calories and fat with low protein and fiber content. Some brands include Cheetos, SunChips, Goldfish® crackers, and Fritos corn chips. In general, extruded snacks are perceived as being unhealthy. However, in recent years, in response to consumer preferences for better-for-you snacks, manufacturers have been incorporating healthier ingredients such as peas, lentils, chickpeas, cauliflower, and other vegetables into their products.

The extrusion process is also used to create nutrient-dense, shelf-stable snacks to combat malnutrition around the world. More than 200 million children under the age of 5 suffer from undernutrition,1 which is linked to 45% of deaths of children in this age group worldwide. In Cambodia, Nutrix, a tube-shaped wafer snack with a slightly sweet, slightly savory fish-based filling is used to combat malnutrition in that country. Previously, the Cambodian government relied on an imported nutrient-rich mix of milk powder, wheat flour, oat flour, and soy-protein as a therapeutic food. However, when prepared, this food became chewy and hard to swallow. Nutrix, on the other hand, is similar to a well-known local snack called Num Phom, uses local ingredients, and is more palatable. Children love it according to Lyndon Paul, co-founder of Danish Care Foods, manufacturer of Nutrix, and former product designer with Vissot, a local health food company.2 Since 2019, the private sector, non-governmental organizations, development agencies, and governments in Laos, Indonesia, Nepal, Bangladesh, and India have been interested in setting up Nutrix production facilities so that they can support malnutrition programs in their respective countries.

Today’s market size shows global extruded snack revenues for 2019 and projected for 2027. People are snacking more than they have in the past. In the United States, 95% of adults snack at least once a day, with 70% snacking two or more times a day. Many are foregoing entire meals and instead are snacking throughout the day. Consumers with busy lives who are looking for convenient, on-the-go, ready-to-eat foods to satisfy their hunger will contribute to the growing demand for extruded snacks over this time period. Health-conscious snackers will contribute to the growing demand for healthier ingredients in their favorite snack foods. Increasing attendance at entertainment venues, theaters, and other gathering places is expected to spur demand for these types of snacks at these sites. However, with governments throughout the world shutting businesses and imposing stay-at-home orders to slow the spread of COVID-19 in 2019 and 2020, demand for extruded snacks away from home are expected to decrease in the near future. Meanwhile, consumers are stocking up on shelf-stable, processed foods during the quarantine, including extruded snack foods. In an April 2020 Harris poll, 40% of those surveyed said they’ve been eating more snacks since the coronavirus pandemic began.

In 2019, more than 35% of extruded snack sales took place at supermarkets and hypermarkets, followed by convenience stores and online retailers. Potato-based snacks comprised more than 25% of revenues. Tapioca-based snack revenues are expected to increase at a compound annual growth rate (CAGR) of 4.1% from 2020 to 2027 due to increasing demand by younger generations for healthier snacks. Tapioca is cholesterol-free, low in sodium and free of common allergens, such as gluten and wheat. Tapioca in various forms is widely consumed in Latin America, Africa, and Asia. Europe had a more than 40% market share in 2019 owing to consumer snacking during social occasions and snacking on-the-go. The Asia Pacific region’s share is expected to increase the most, at a CAGR of 5.6%, due to the large populations in China and India and a growing corporate culture in which parties, where drinks and snacks are served, are encouraged.3 The market for extruded snacks is fragmented with many small local and international manufacturers. Major companies with large customer bases include Nestlé S.A.; The Kellogg Co.; Calbee, Inc.; PepsiCo, Inc.; and Campbell Soup Co.

1 Undernutrition includes wasting (low weight-for-height), stunting (low height-for-age) and underweight (low weight-for-age).
2 Nutrix was developed as a result of a collaboration between Vissot, Danish Care Foods, partners at UNICEF, the French National Research Institute for Sustainable Development, the University of Copenhagen, and the Department of Fisheries Post-Harvest Technologies and Quality Control, Fisheries Administration, Cambodia in addition to a grant from the Bill & Melinda Gates Foundation.
3 Any projections involving increased sales at large venues or gatherings may be less than accurate due to the disruption to the economy and daily life as governments closed businesses and imposed stay-at-home orders to slow the spread of COVID-19 in 2019 and 2020.

Geographic reference: World
Year: 2019 and 2027
Market size: $51.59 billion and $74.52 billion
Sources: “Extruded Snacks Market Size, Share & Trends Analysis Report by Product (Potato, Corn, Rice, Tapioca, Mixed Grains), by Distribution Channel, by Region, and Segment Forecasts, 2020 – 2027,” Grand View Research Report Summary, April 2020 available online here; “Extruded Snacks Market Size Worth $74.52 Billion by 2027 | CAGR: 4.7%: Grand View Research, Inc.,” CISION PR Newswire, April 30, 2020 available online here; “Malnutrition,” World Health Organization, April 1, 2020 available online here; “Nutrix – The Big Reach of Small Fish in Nourishing Cambodia,” CGIAR, March 31, 2020 available online here; “Food Extrusion,” Wikipedia, September 20, 2019 available online here; Carlie Porterfield, “In Coronavirus Quarantine, We’re Eating More Processed Snacks,” Forbes, April 28, 2020 available online here; Lacey Bourassa, “The Health Benefits of Tapioca,” Livestrong.com, September 16, 2019 available online here; “Snacking Motivations and Attitudes – US – January 2019,” Mintel Reports Overview, January 2019 available online here; Liz Parker, “State of the Industry 2019: Puffed and Extruded Snacks Find Growth Through Product Diversity,” Snack Food & Wholesale Bakery, July 23, 2019 available online here; Steve Dwyer, “Snacks: Diving Into Extrusion,” CSP, September 5, 2017 available online here; Sorpida Korkerd, et. al., “Expansion and Functional Properties of Extruded Snacks Enriched with Nutrition Sources from Food Processing By-products,” Journal of Food Science and Technology, January 2016 available online here; Tamar Lapin, “Americans are Handling the Coronavirus Pandemic by Binging on Snacks,” New York Post, April 13, 2020 available online here.
Image source: WikimediaImages, “food-eat-diet-goldfish-crackers-2202364,” Pixabay, April 4, 2017 available online here.

Fruit Tea

fruit tea
“Some days ‘staying put’ might feel the same as Going Nowhere. Make a cup of tea, and wait for that feeling to pass.” — Vivian Swift, When Wanderers Cease to Roam: A Traveler’s Journal of Staying Put

Whether a steaming hot cup of tea on a cold winter’s night or a cold glass of iced tea on a hot summer’s afternoon, however people choose to enjoy this beverage a great many are doing just that. Worldwide tea consumption, 35.2 liters per capita in 2017, is second only to packaged water consumption. In 2018, revenues totaled $52.1 billion.

Today’s market size shows worldwide revenues for one type of tea, fruit tea, for 2019 and projected for 2027. Fruit flavored tea sales are a small fraction of overall tea sales and will continue to be in the near future; however, sales are expected to increase at a compound annual growth rate (CAGR) of 9.6% through 2027. Overall tea sales are expected to rise at a CAGR of 5.8% over most of this time period.

Growth in the fruit tea market is expected to be driven by a growing consumer preference for low caffeine beverages and fruit-infused products, especially among millennials and the health-conscious. As with other segments of the food and beverage industry that are seeing a rise in organic product sales, organic teas are gaining in popularity but they are still a small segment of the market. In 2019, conventional teas claimed more than 80% of sales. Easy accessibility and affordability are factors in conventional fruit teas maintaining their high market share.

Most people buy their tea offline. A majority of sales take place at supermarkets and discount stores. Specialty retailers and teahouses are gaining in popularity among consumers who want premium teas with unique flavors. While online sales have a small share of the market, they are expected to have the fastest growth through 2027, with a CAGR of 10.6%.

The Asia-Pacific region claimed more than 35% of the global market in 2019. China is the largest producer and consumer of fruit tea. Demand for fruit and floral-infused beverages has seen significant growth in that country in recent years. North America is expected to experience the fastest growth, a CAGR of 10.5%, from 2020 to 2027 due to shifting consumer preferences for healthier fruit-flavored beverages. The increasing popularity of ready-to-drink beverages is also expected to contribute to this growth. Leading global fruit tea manufacturers include Harney & Sons Fine Teas, R. Twining and Company Ltd., Tata Consumer Products, Hain Celestial, Unilever, The Bigelow Tea Co., Dilmah Ceylon Tea Co. PLC, Tiesta Tea, and Bettys & Taylors of Harrogate Ltd.

Geographic reference: World
Year: 2019 and 2027
Market size: $2.4 billion and $5.1 billion, respectively
Sources: “Fruit Tea Market Size, Share & Trends Analysis Report by Product (Conventional, Organic), by Distribution Channel (Offline, Online), by Region (North America, Europe, APAC, CSA, MEA), and Segment Forecasts, 2020 – 2027,” Grand View Research Report Summary, March 2020 available online here; “Fruit Tea Market Size Worth $5.1 Billion by 2027 | CAGR: 9.6%: Grand View Research, Inc.,” CISION PR Newswire, April 23, 2020 available online here; “Tea Market by Type (Green Tea, Black Tea, Oolong Tea, Fruit/Herbal Tea, and Others), Packaging (Plastic Containers, Loose Tea, Paperboards, Aluminum Tins, and Tea Bags), Distribution Channel (Supermarkets/Hypermarkets, Specialty Stores, Convenience Stores, Online Stores, and Others) and Application (Residential and Commercial): Global Opportunity Analysis and Industry Forecast, 2019-2026,” Allied Market Research Report Overview, December 2019 available online here; Dan Bolton, “Tea Consumption Second Only to Packaged Water,” Worldtea News, May 1, 2018 available online here; “Tea Quotes,” Goodreads available online here.
Image source: TerriC, “tea-cup-vintage-tea-cup-tea-cup-2107599,” Pixabay, March 1, 2017 available online here.

Vibration Control Systems

helicopter with vibration control system
A motion control system helps reduce vibration in a helicopter’s fuselage generated by the main rotor. A motion control system is a type of vibration control system.
Vibration control systems (VCS) are used to control vibrations and motion in machines in order to increase their efficiency as well as the life span of the components. Vibration can cause wear and tear on machine parts and that in turn can lead to cracks and breakage. Originally vibration control systems were designed for use in automotive and electrical equipment. The electrical and electronics segments claimed 15% of the global market in 2019 but significant growth is expected through 2027 due to the increase in the manufacturing of industrial machinery worldwide.1

Nowadays these systems are also being used in the aerospace and defense, oil and gas, mining, quarrying, and healthcare industries. Pharmaceutical companies are using VCS to diminish the effects of vibration on sensitive equipment such as magnetic resonance imaging machines and DNA sequencing microarrays.

Today’s market size shows the global vibration control system revenues for 2019 and projected for 2027. Vibration control systems for the automotive and aviation industries are expected to drive growth in the industry. VCS manufacturers are being compelled to upgrade their products due to strict regulations and policies set by the United States government and airline regulatory agencies. Overall, demand is increasing for self-controlling, smart, adaptive VCS; web-based continuous machine condition monitoring; and Active Noise and Vibration Control Systems in aircraft.

In 2019, Europe had the highest revenue share due to a large number of automobile manufacturers in the region. North America had a market share of more than 19%. This region was an early adopter of vibration control systems, with large-scale systems being used in the U.S. electronics and electrical, automotive, and food manufacturing sectors. Growing demand for VCS in the United States and Canadian healthcare, aviation, and defense industries will contribute to revenue growth in the coming years. Many manufacturers and solution providers are located in North America. Many major manufacturers are also located in China. The Asia-Pacific region is expected to experience the fastest growth owing to rapid industrialization in China, Japan, and India. Rapid development in Brazil’s oil and gas, textile, automotive, and machinery and equipment industries will contribute to growth in Latin America. Some leading companies include ContiTech AG, Lord Corp., Resistoflex Pvt. Ltd., Hutchinson, Fabreeka, Sentek Dynamics Inc., Vicoda GmbH, Isolation Technology Inc., Trelleborg AB, and Kinetics Noise Control Inc.

1 The source’s predictions were made before governments around the world shut down many businesses to slow the spread of COVID-19 in 2019 and 2020. Once the effects of the shut down are analyzed in the months to come, these predictions may change dramatically.

Geographic reference: World
Year: 2019 and 2027
Market size: $4.3 billion and $6.7 billion, respectively
Sources: “Vibration Control System Market Size, Share & Trends Analysis Report by System Type, by Application (Automotive, Manufacturers, Healthcare, Aerospace & Defense, Oil & Gas), by Region, and Segment Forecasts, 2020 – 2027,” Grand View Research Report Summary, April 2020 available online here; “Vibration Control System Market Size Worth $6.7 Billion by 2027: Grand View Research, Inc.,” CISION PR Newswire, April 23, 2020 available online here.
Image source: egon isaksson, “twilight-helicopter-himmel-1324836,” Pixabay, April 12, 2016 available online here.

Commercial Seaweed

seaweed

“Some algae are a delicacy fit for the most honoured guests, even for the King himself.”

— Sze Teu (China, 600 BC)

Since prehistoric times, seaweed has been a staple food in China, Japan, and Korea. Commercial seaweed was first consumed in Japan in the 4th century and in China in the 6th century. Currently, China, Japan, and South Korea are the top consumers. As residents of these countries migrated to other parts of the world, demand for seaweed spread. Seaweed provides vitamins and nutrients such as calcium, sodium, potassium, iodine, iron, and zinc. Nori, the seaweed used to wrap sushi rolls, is also high in protein.

Today’s market size shows global commercial seafood revenues for 2019 and projected for 2027. Over the past 50 years, harvesting seaweed from natural sources has not been able to meet increasing demand. Nowadays, more than 90% of commercial seaweed is cultivated. In addition to human consumption, commercial seaweed is used as an animal feed additive, thickening and gelling agents for the cosmetics and food industries, fertilizer, and soil conditioner. It’s also used in beauty products such as scrubs, masks, and body wraps.

There are three types of commercial seaweed: red, brown, and green. In 2019, red seaweed comprised more than 50% of the market. Its varied uses along with its easy availability will drive its growth in the market. This type of seaweed is expected to have the highest compound annual growth rate through 2027. Nori is an example of red seaweed. Brown seaweed had a market share of more than 45% in 2019. This type of seafood is used as food and as raw materials for the extraction of hydrocolloid and alginate. Hydrocolloids and alginate gel are used for wound care. Alginate is also used as a cell carrier in tissue engineering. Kelp is a form of brown seaweed. Green seaweed is also used for food. Umibudo, also known as sea grapes, is a form of green seaweed that’s a staple food in Okinawan cuisine. 

In 2019, the Asia-Pacific region accounted for more than 60% of consumption. This region is expected to experience the fastest growth rate through 2027. Increased production and demand for commercial seafood for use in food, nutraceuticals, personal care products, pharmaceuticals, adhesives, and gels from China, Indonesia, South Korea, and Japan will contribute to this growth. The market in Europe is expected to expand significantly due to increased cultivation in Ireland, France, and the United Kingdom. Growth in this region is also expected to come from high demand in the healthcare and food industries.

About 75% of commercial seaweed was used for human consumption in 2019. Animal feed claimed the second-largest share of the market. Processed commercial seaweed is used to improve the health of livestock. Agricultural uses had the third-largest market share. Producers, vendors, end-users, government organizations, and others encompass the market. Some leading global companies in this industry include Cargill Inc., Roullier Group, E.I. DuPont Nemours and Co., Biostadt India Ltd., and Compo GmbH Co.

Geographic reference: World
Year: 2019 and 2027
Market size: $5.9 billion and $11.9 billion, respectively
Sources: “Commercial Seaweeds Market Size, Share & Trends Analysis Report by Product (Brown Seaweeds, Red Seaweeds, Green Seaweeds), by Form (Liquid, Powdered, Flakes), by Application, by Region, and Segment Forecasts, 2020 – 2027,” Grand View Research Report Summary, April 2020 available online here; “Commercial Seaweeds Market Size Worth $11.9 Billion by 2027: Grand View Research, Inc.,” CISION PR Newswire, April 21, 2020 available online here; “Hydrocolloid,” ScienceDirect available online here; “Alginate,” ScienceDirect available online here; “Seaweed as Human Food,” The Seaweed Site: Information on Marine Algae available online here; Ole Mouritsen, “The Science of Seaweeds,” American Scientist, November-December 2013 available online here; Rachel Tan, “6 Most Common Varieties of Edible Seaweed,” Michelin Guide, June 12, 2019 available online here.
Image source: ivabalk, “sushi-food-roll-domestic-production-2314534,” Pixabay, May 15, 2017 available online here.

Decaffeinated Coffee

coffee
Does your morning routine include reaching for a cup of hot coffee? If so, you’re not alone. Worldwide, 2.25 billion cups of coffee are consumed each day.

Legend has it that coffee was discovered in Ethiopia in the 9th century. By the 15th century, coffee was being grown in Yemen. From there the coffee trade spread to the Arabian Peninsula, Persia, Egypt, Syria, and Turkey. The first known coffee shop opened in Constantinople around 1475. In the 1600s coffee houses opened in England, Austria, France, Germany, and Holland. Coffee came to America in the 18th century. In 1903, German merchant Ludwig Roselius and his co-workers invented the first commercially successful decaffeination process and patented it in 1906. Back then, benzene was used as a solvent to make decaffeinated coffee, however, that’s no longer the case as benzene has been classified as a carcinogen.

Currently, several methods are used to decaffeinate coffee. The direct method involves steaming unroasted coffee beans and then rinsing the beans in an organic solvent such as dichloromethane or ethyl acetate to extract the caffeine. This process is repeated several times until the caffeine content reaches the required standard. In the United States, 97% of the caffeine has to be removed. In the European Union, 99.9% has to be removed by volume in order for the coffee to be called decaffeinated.

In the indirect method, coffee beans are soaked in hot water for several hours, then the beans are removed from the water and either dichloromethane or ethyl acetate is used to extract the caffeine from the water. The caffeine is then extracted from the solvent. The same water is recycled through the process with new batches of beans until an equilibrium is reached where the beans and the water have a similar composition except for the caffeine so no coffee strength or flavorings are lost.

In the Supercritical CO2 process, unroasted coffee beans are steamed then added to a high-pressure container. A mixture of water and CO2 is circulated through the container. The caffeine dissolves into the CO2 while the compounds contributing to the flavor in the coffee remain in the bean. In a separate container, the caffeine is extracted from the CO2 and then the CO2 is recirculated to the high-pressure container.

The Swiss Water process uses Green Coffee Extract (GCE), a solution containing water-soluble components of green (unroasted) coffee except for the caffeine. The caffeine from the unroasted coffee beans is drawn to the GCE. Once the GCE is caffeine-rich, it’s filtered to remove the caffeine and reused to remove additional caffeine from the unroasted coffee beans.

The Triglyceride process involves soaking unroasted coffee beans in a hot water/coffee solution to draw the caffeine to the surface of the beans. The beans are then transferred to another container and immersed in coffee oils and left to soak. After several hours of exposure to high heat, the triglycerides in the oils extract the caffeine. The beans are separated from the oils and dried. Then, the caffeine is removed from the oils. The oils are reused to decaffeinate another batch of coffee beans.

Today’s market size shows the revenues for decaffeinated coffee in 2019 and projected for 2027. The decaffeinated market is a very small segment of the $424.7 billion global coffee market. Traditionally, decaffeinated coffee drinkers are older and/or have health conditions in which doctors recommend limiting caffeine intake. As populations age, the size of the decaffeinated coffee market is expected to grow. Growth is also expected to come from millennials who constitute more than 31% of the world’s population. Millennial coffee drinkers prefer organically and sustainably-grown, decaffeinated, and lightly roasted coffee beans. In the United States, 19% of decaffeinated coffee drinkers are millennials. Overall, demand for decaffeinated coffee is also expected to rise among health-conscious individuals who want to cut back or eliminate their caffeine consumption due to caffeine’s negative effects on health, including jitteriness, restlessness, insomnia, and elevated blood pressure. In a 2017 report by the National Coffee Association, 68% of consumers in the United States thought it was necessary to reduce their caffeine intake.

Arabica beans comprised the majority of the global decaf coffee market in 2019, followed by Robusta beans. Arabica beans have naturally less caffeine than other varieties and are regarded as providing a superior coffee flavor, aroma, and body. The natural fruity and sweet flavor makes coffee made with these beans suitable for drinking without added sweeteners. Robusta beans are more bitter but easier to tend on the farm and less expensive than Arabica beans. The lower cost is driving demand in this segment. This demand is expected to grow the fastest, at a compound annual growth rate of 8.1% through 2027.

In 2019, Europe was the largest market for decaffeinated coffee due to the popularity of coffee in the region along with consumers’ growing awareness of caffeine’s side effects. The Asia-Pacific region is expected to experience the fastest growth as health-consciousness and demand for other decaffeinated beverages rises. North America is the largest importing region, followed by Europe. Some leading global decaffeinated coffee processors include Swiss Water Decaffeinated Coffee Inc., LifeBoost Decaf, Cafe Don Pablo Colombia Supremo Decaf, No Fun Jo Decaf; Fresh Roasted; and Volcanica Coffee Costa Rica Tarrazu Decaf.

Geographic reference: World
Year: 2019 and 2027
Market size: $1.65 billion and $2.8 billion, respectively
Sources: “Decaffeinated Coffee Market Size, Share & Trends Analysis Report by Product (Roasted, Raw), by Bean Species (Arabica, Robusta), by Distribution Channel, by Region, and Segment Forecasts, 2020 – 2027,” Grand View Research Report Summary, April 2020 available online here; “Decaffeinated Coffee Market Size Worth $2.8 Billion by 2027 | CAGR: 7.0%: Grand View Research, Inc.,” CISION PR Newswire, April 15, 2020 available online here; “Decaffeination,” Wikipedia, April 17, 2020 available online here; “The Caffeine Fix: Coffee Consumption, History, Trends & Industry Statistics,” Much Needed, February 22, 2020, updated April 23, 2020 available online here; “Global Markets for Decaffeinated Coffee Brochure,” LMC International, April 2019 available online here; “Coffee Worldwide,” Statista available online here; Tasmin Grant, “Exploring Millennial Trends in Specialty Coffee,” Perfect Daily Grind, February 3, 2020 available online here; Lee J. Miller and Wei Lu, “Gen Z Is Set to Outnumber Millennials Within a Year, Bloomberg, August 20, 2018 available online here; “The History of Coffee,” National Coffee Association available online here; “10 Differences Between Robusta and Arabica Coffee,” The Roasters Pack, September 19, 2014 available online here.
Image source: emilie767, “smoky-mountains-coffee-nature-3021394,” Pixabay, December 19, 2017 available online here.

Self-Checkout Systems

self-checkout systems

While more of us are ordering our groceries online nowadays, others of us still shop at brick-and-mortar stores. With state governments limiting the number of people in a store, including limiting the number of store personnel, more of us may be using self-checkout systems to pay for our groceries. Before the restrictions implemented to slow the spread of COVID-19, stores were experiencing an increase in customers, and with that, customers were experiencing longer wait times in checkout lines.

With the growth of e-commerce, brick-and-mortar stores are also having to compete with the ease of shopping online, customers checking out their items with the click of a mouse. The stores have a need to increase revenue while decreasing costs. Increased labor costs, a shortage of workers in developed countries, and a consumer preference for personalized shopping experiences have led retailers to install self-checkout systems. These systems allow stores to shift their personnel from the checkout lane to other retail operations such as restocking shelves and helping customers directly.

Today’s market size shows self-checkout system revenue for 2019 and projected for 2027. The systems segment of the market, the hardware itself, accounted for more than 55% of revenue in 2019. The rest comes from the services segment, which includes consulting, implementation, and maintenance services. This segment is expected to experience the fastest growth during this time period. The need for customized software and the need to update or upgrade the software will contribute to this growth.

Self-checkout systems can be cash-based or cashless. Cash-based systems, whether standalone or systems that can be mounted on a shelf, pedestal or wall, had the highest market share in 2019. Consumer preferences for cash transactions along with some cities in the United States banning cashless stores will contribute to growth in this segment. Cashless systems, like what is found in Amazon Go stores, where customers can pick a product, scan it, and pay for it in the aisle using a smartphone app, are expected to experience the fastest growth through 2027. While cash is still the most widely used form of payment in the world, growth in this segment of the industry will be due to the increasing popularity of electronic payments among millennials and middle-aged consumers in addition to the increasing availability of digital payment solutions. 

However, not all retail is conducive to cashless self-checkout systems. In 2018, Walmart abandoned a pilot program that tested the technology in many of its stores. Walmart shoppers who tried the service found it awkward to scan a large number of items and found it difficult to scan fresh produce efficiently. As a result, not many customers used this system. High inventory stores with many existing checkout stations, electronics stores which require customer service personnel to help customers with their purchases, and clothing stores in which customers try before they buy, and those same customers may not return items to the shelf or rack if they decide not to purchase them are other examples of businesses where cashless self-checkout systems may not be practical.

Although self-checkout systems may be more convenient for consumers, it also contributes to a rise in the loss rate for stores. Thefts and items not being scanned, whether deliberate or accidental, lead to an average 4% loss rate for retailers who implement self-checkout systems. Newer systems, however, use artificial intelligence to reduce fraud.

By region, North America had the highest market share followed by Europe as more large supermarkets, hypermarkets, and discount chains adopt self-checkout systems. The Asia-Pacific region is expected to be the fastest-growing region for the adoption of self-checkout systems, expanding at a compound annual growth rate of more than 15%. The adoption of cashless self-checkout systems is driving the growth, especially AI-enabled cashless systems in which all products are scanned instantly before the consumer is directed for payment. Worldwide, leading self-checkout system companies include: NCR Corp., Toshiba Global Commerce Solutions, Diebold Nixdorf Inc., FUJITSU, ITAB Group, and ECR Software Corp.

Geographic reference: World
Year: 2019 and 2027
Market size: $2.8 billion and $7.8 billion, respectively
Sources: “Self-checkout Systems Market Size, Share & Trends Analysis Report by Components (Systems, Services), by Type (Cash Based, Cashless), by Application, by Region, and Segment Forecasts, 2020 – 2027,” Grand View Research Report Summary, April 2020 available online here; “Self-checkout Systems Market Size Worth $7.8 Billion by 2027 | CAGR: 13.3%: Grand View Research, Inc.,” CISION PR Newswire Press Release, April 16, 2020 available online here; “Amazon Go Remains Compelling but Niche Shopping Experience, Finds Strategy Analytics,” BusinessWire, April 21, 2020 available online here; Russell Redmond, “Walmart Pulls Plug on Moblie Express Scan & Go,” Supermarket News, May 17, 2018 available online here; Michael Suswal, “Why Retailers are Abandoning Scan & Go Self-Checkout,” Multichannel Merchant, January 15, 2019 available online here; Paul van der Knaap, Taco de Vries, and Ewout Boesenach, “World Cash Report 2018,” G4S Cash Solutions and Payment Advisory Group, 2018 available online here.
Image source: Wolfmann, “File:Self-service check-out Barcode scanning Payment machine Grocery store (Selvbetjent kasse Skanning Betalingsautomat) Interior etc Meny Supermarket Industrivegen Osøyro Norway 2019-11-28 IMG 6048.jpg,” Wikimedia Commons, November 28, 2019 available online here. This image file is licensed under the Creative Commons Attribution-Share Alike 4.0 International license.

Candy

candy
Candy, potato chips, ice cream, popcorn, fruits, or vegetables. What comfort foods have you been reaching for in these unprecedented times? If you’re like 28% of the population, your go-to comfort food is candy, with an overwhelming majority of those choosing chocolate.

Today’s market size shows candy revenues for the 52 weeks ended March 24, 2019, in the United States. Revenues for chocolate candy, totaling $14.1 billion, exceeded 55% of total candy revenue over this time period. However, this was 1.3% lower than the previous 52 week period. Non-chocolate candy, gum, and breath freshener revenues totaled $7.4 billion, $3.1 billion, and $776 million, respectively. Sales of gum grew by 2%. Non-chocolate candy sales increased by 0.8%. But sales of breath fresheners decreased by 3.8% from the year prior.

As in other sectors of the food and beverage industry, consumers are seeking better-for-you options in the candy aisle too. For consumers, “organic” labeling implies the food is pesticide-free, preservative-free and hormone-free. To replace “natural” labeling, which many see as a gimmick, manufacturers are using “free-from” labeling, such as “GMO-free” and “gluten-free”, to communicate to the consumer that their products do not have ingredients that may be perceived as unhealthy. With low-carb diets trending, sugar-free chocolate candy saw a 19.2% increase in sales from the prior year, led in part by a 152% jump in sales of Lily’s Sweets, the number two selling sugar-free chocolate candy behind Russell Stover, which saw a 13% increase in sales.1 Consumers still consider dark chocolate healthier, but they also seek indulgence. As a result, manufacturers are combining different types of chocolate, using higher-quality, ethically-sourced ingredients, offering unique flavors, and adding nuts and fruits to their dark chocolate products.

In North America in 2019, Mars Wrigley Confectionery U.S. topped sales with $18 billion, followed by Mondelez International ($11.9 billion), The Hershey Co. ($7.95 billion), Ferrero ($2.9 billion), General Mills ($2.1 billion), Kellogg Co. ($1.89 billion), Lindt & Sprungli (North America) Inc. ($1.7 billion), Barcel S.A. ($1 billion), Clif Bar & Co. ($900 million) and KIND Healthy Snacks ($719 million). Mars Wrigley Confectionary also led in sales worldwide.2

1 Russell Stover sugar-free chocolate sales totaled $95.4 million. Lily’s Sweets sugar-free chocolate sales totaled $13.7 million.
2 Candy Industry Magazine reports both North American and global sales for Mars Wrigley Confectionery as $18 billion.

Geographic reference: United States
Year: 2018-2019
Market size: $25.38 billion
Sources: “The State of the Global Candy Industry in 2019,” Candy Industry Magazine, June 10, 2019 available online here; Laurnie Wilson, “Infographic: Americans Say Chocolate, Chips Are Top Quarantine Comfort Snacks,” Civic Science, April 1, 2020 available online here; “Sweet 60 2019: The Top Candy Companies in North America,” Candy Industry Magazine available online here; “2019 Global Top 100 Candy Companies: Part 1,” Candy Industry Magazine available online here.
Original source: IRI
Image source: Patrick Fore, “Jelly Beans,” Unsplash, February 26, 2018 available online here.

Geosynthetics

Geosynthetics
Click photo to enlarge
Geosynthetics are products used to separate, reinforce, filter, drain and contain terrain. They are made of synthetic polymers and come in the following forms: geotextiles, geogrids, geonets, geomembranes, geosynthetic clay liners, geofoam, geocells, and geocomposites. Because they do not biodegrade as easily as natural materials do, they are more stable and longer-lasting when used underground.

Geotextiles are flexible porous fabric made of synthetic fibers such as polypropylene or polyester. They are used for erosion control and to strengthen the soil on slopes. In combination with steel fencing, they can contain construction debris during demolition. Geotextiles can also be used to filter pollutants from stormwater run-off.

Geogrids and geonets, as their names imply, are grid- and net-like structures formed from polymers. Geogrids can be made from polyester, polyvinyl alcohol, polyethylene, or polypropylene. Geonets are made from polyethylene resin and are often laminated with geotextiles. Geogrids are used as reinforcement materials and geonets are used for drainage of liquids and gases.

A geomembrane can be made from one of several types of polymers. It’s a low permeability synthetic liner or barrier used to contain liquids or gases. Since the 1980s, this type of geosynthetic has been used to line solid-waste landfills. Geomembranes are also used as liners for secondary containment of underground storage tanks, golf course water holes and sand bunkers, water and waste conveyance canals, heap leach pads, and fish and shrimp ponds in the aquaculture industry.

Geosynthetic clay liners consist of thin layers of factory-fabricated bentonite clay in between two layers of geotextiles or bonded to a geomembrane. They’re used to retain seepage within a landfill.

Geofoam consists of processed polystyrene. The foam has many closed cells filled with air. Geofoam is 98% air by volume. It’s formed into large, lightweight blocks used as filler below a highway, bridge approach, embankment or parking lot. Geofoam can minimize settlement and reduce the weight on underground utility lines thereby minimizing the chance of collapse. Because of its insulating properties, installing it under pavement can minimize or eliminate the damage caused by frost heave. Geofoam is also used for retaining structures and slope stabilization to minimize the likelihood of landslides.

Geocells, also known as Cellular Confinement Systems, are honeycomb-shaped structures. The cells can be filled with sand, soil, rock, gravel or concrete depending on the project. Geocells limit the movement of the material while maintaining its compaction. This structure allows for the distribution of loads over a wider area. They’re used for reinforcing soft or uneven soil foundations and for stabilizing steep slopes. Because the cells allow for the passage of water, nutrients, and organisms through the soil, plant growth is possible. The plants’ roots then provide even more stability to the soil.

Geocomposites are combinations of geotextiles, geogrids, geonets, and/or geomembranes fabricated into a single unit. What materials are combined will depend on the purpose for which the end product will be used. For example, geotextile-geogrid composites provide separation and filtration functions, and drainage is improved in comparison to using geotextiles alone. One use for this type of geocomposite is to intercept and convey leachate in landfill liner and cover systems.

Today’s market size shows the worldwide revenues for geosynthetics in 2018 and projected for 2026.1 Geotextiles commanded the highest market share in 2018, more than 30%, followed by geogrids and geomembranes. Over this time period, growth will come from the construction and mining industries. Increased infrastructure spending on roads, bridges, railways, airports, and harbors in the United States, Germany, Poland, the United Kingdom, Russia, Australia, and India will increase demand for geosynthetics. In the mining industry, geosynthetic materials are used for creating waste barriers for mining by-products. Around 40% of global geomembrane production is used in the mining industry.

North America, whose revenues totaled $10.27 billion in 2018, is expected to continue to have the largest market share over this time period due to increased mining operations in the United States as well as ongoing infrastructure projects. Europe is expected to be the second-largest market as a result of the growing demand for residential buildings. Also, strict regulations relating to industrial waste management in Germany are expected to increase demand for geomembranes. The Asia-Pacific region is expected to see substantial growth as disposable incomes rise and the government invests more in industrial and commercial construction projects. Some leading global manufacturers of geosynthetics include Solmax, TenCate Geosynthetics Asia Sdn Bhd, TENAX SPA, Fibertex Nonwovens A/S, Tensar International Corp., HUESKER, Strata Systems Inc., ASRU AMERICA Inc., Global Synthetics, and Terram Geosynthetics Pvt. Ltd.

1 Due to the COVID-19 pandemic, many industries across the world ceased operations, at least temporarily. The source’s projections were compiled before this disruption. Because of this, the data may be revised in the future.

Geographic reference: World
Year: 2018 and 2026
Market size: $27.16 billion and $45.25 billion
Sources: “Geosynthetics Market Size, Share and Industry Analysis, by Product (Geotextile Geogrid, Geonets, Geocells, Geofoam, Geosynthetic Clay Liner, Geocomposites), by Application and Regional Forecast 2019-2026,” Fortune Business Insights Summary, March 2020 available online here; “Geosynthetics,” Wikipedia, November 24, 2019 available online here; “Geotextile,” Wikipedia, December 19, 2019 available online here; “Geogrid,” Wikipedia, March 1, 2020 available online here; “Geonets,” Wikipedia, November 27, 2019 available online here; “Geomembrane,” Wikipedia, November 24, 2019 available online here; “Geosynthetic Clay Liner,” Wikipedia, March 1, 2020 available online here; “Geofoam,” Wikipedia, March 1, 2020 available online here; “Cellular Confinement,” Wikipedia, January 16, 2020 available online here; “Geocomposite,” Wikipedia, November 27, 2019 available online here; “Solmax-GSE Becomes Solmax,” Solmax Press Release, February 11, 2019 available online here.
Image source: Geosynthetic Institute, “File:Geosynthetics1.jpg,” Wikimedia Commons, April 12, 2009 available online here.

Tortillas and Tortilla Chips

tortillas
Over the past several years, tortillas and tortilla chips have become staples in the retail and foodservice sectors and perhaps in your own pantry too. The growing Hispanic and Latino population in the United States, the influence of Latin American cuisine throughout the country, and the foods’ versatility have contributed to their popularity. In addition, consumers perceive tortillas as being healthier than bread. Some consumers looking for products with few ingredients and no preservatives are switching their buying habits from loaves of bread to packages of tortillas.

To capitalize on this better-for-you trend, manufacturers are making tortillas with whole wheat flour, ancient grains, plant proteins, flax seeds, and herb-based dough. Manufacturers are also creating tortillas for specific diets, such as low-carb, high-fiber, and low-calorie. Some Paleo-friendly grain-free tortillas and tortilla chips are made with cassava flour and vegetables. Others are made with nut flours. Organic, gluten-free, and non-GMO tortillas and tortilla chips are also trending among health-conscious consumers. In addition to healthy ingredients, consumers desire a variety of flavors: from traditional Latin-inspired chipotle adobo and tomatillo salsa to Mediterranean tzatziki to comfort food favorites like bacon Cheddar.

Today’s market sizes show retail sales of tortillas and tortilla chips in 2016 and 2019. Overall, revenues are expected to decline in 2020 as demand drops dramatically from restaurants that have closed or that are operating at reduced capacity during the COVID-19 pandemic. According to the Tortilla Industry Association, most of the $17.8 billion tortilla and tortilla chip sales in 2019 occurred at retail establishments (48%); followed by foodservice locations (24%) and schools, institutions, and military bases (21%). Leading tortilla manufacturers include Mission Foods, Inc.; Gruma Corp.; General Mills, Inc.; Olé Mexican Foods, Inc.; El Milagro; B&G Foods, Inc.; La Tortilla Factory; Megamex Foods; and Kraft Heinz Co. Leading tortilla chip makers include Frito-Lay, Inc.; Barcel USA; OTB Acquisitions LLC (On the Border brand); Mission Foods, Inc.; Gruma Corp.; Late July Snacks LLC; Juanita’s Fine Foods, Inc.; Xochitl, Inc.; Garden of Eatin’, Inc.; and Food Should Taste Good, Inc. For the 52 weeks ended June 16, 2019, Frito-Lay brands commanded more than 68% of the tortilla chip and tostada market.1

1 Leading manufacturers of tortillas and tortilla chips are based on dollar sales according to IRI. Tortillas: Sales at supermarkets, drug stores, mass merchandisers, convenience stores, military commissaries, and select club and dollar chains for the 52 weeks ended March 24, 2019. Melissa Kvidahl Reilly, “State of the Industry 2019: Tortillas Offer Health Attributes and Big Flavor,” Snack Food & Wholesale Bakery, June 24, 2019 available online here. Tortilla chips: Sales by brand at supermarkets, drug stores, mass merchandisers, convenience stores, military commissaries, and select club and dollar chains for the 52 weeks ended June 16, 2019. “Claim to Fame,” Snac World Special Edition: Official State of the Industry 2019, Annual 2019 available online here.

Geographic reference: United States
Year: 2016 and 2019
Market size (Tortillas): $2.3 billion and $2.6 billion, respectively
Market size (Tortilla chips): $4.9 billion and $5.5 billion, respectively
Sources: “Tortilla Product Diversity Drives Increased Sales,” Snack Food & Wholesale Bakery, March 1, 2020 available online here; Melissa Kvidahl Reilly, “State of the Industry 2019: Tortillas Offer Health Attributes and Big Flavor,” Snack Food & Wholesale Bakery, June 24, 2019 available online here; “Claim to Fame,” Snac World Special Edition: Official State of the Industry 2019, Annual 2019 available online here; “Tortilla Production Industry in the US – Market Research Report,” IBISWorld Press Release, August 2019 available online here.
Original source: IRI
Image source: Ryan Concepcion, “Wrapped Food with Gravies,” Unsplash, July 2, 2019 available online here.

Water Flossers

water flossers

A water flosser is a handheld device that removes food and plaque between teeth using streams of water that are sprayed in steady pulses. According to the American Dental Association, using a water flosser doesn’t replace brushing and manual flossing, it’s a supplement to them, removing the food and plaque that can cause cavities and gum disease, especially for those that find flossing difficult or for those with braces, dental implants, crowns, bridges, and veneers. Today’s market size shows worldwide water flosser revenues for 2018 and projected for 2025.

According to the World Health Organization, untreated tooth decay is the most common health condition in the world. An estimated 2.3 billion people have dental cavities in their permanent teeth and 530 million children have them in their primary teeth. Ten percent of the population has severe periodontal disease. 

Dental cavities result when plaque forms on the surface of a tooth and converts sugars from food into acid that destroys the tooth over time. Several social conditions contribute to the rising prevalence of dental cavities, periodontal disease, and other oral diseases, especially in low- and middle-income countries. The lack of fluoride in water and in oral hygiene products, poor access to oral health care services, the marketing of food and beverages high in sugar content and tobacco and alcohol use all contribute to poor oral health.

An aging population, an expanding medical tourism sector and the increasing urbanization of the population in many parts of the world along with growing awareness of oral health as an aspect of overall health is expected to contribute to this product’s revenue growth. As well, increasing demand for professional dental care due to the effects of diabetes worldwide and increasing tobacco consumption in places such as India and China will lead to growth in this market. North America was the largest market in 2018 and is expected to continue to be so through 2025. The Asia-Pacific region is expected to be the fastest-growing market over this time period.

In 2018, dental clinics accounted for more than 55% of revenues, followed by hospitals. Water flossers for in-home use comprised only about one-eighth of total revenues. But, with the increasing cost of professional dental treatments, in-home water flosser revenue is expected to grow the fastest through 2025, at a compound annual growth rate of 5.2%. Leading manufacturers of water flossers include Shenzhen Relish Technology Co., Ltd.; Hydro Floss; Water Pik, Inc.; ToiletTree Products, Inc.; Ginsey Home Solutions; Oral Breeze; Koninklijke Philips N.V.; Procter & Gamble; Aquapick; and S. C. Johnson & Son, Inc.

Geographic reference: World
Year: 2018 and 2025
Market size: $806.52 million and $1.11 billion
Sources: “Water Flosser Market Size, Share & Trends Analysis Report by Application (Home Care, Dental Clinic, Hospitals), by Product (Countertop, Cordless), by Region (APAC, Europe, MEA, North America), and Segment Forecasts, 2019 – 2025,” Grand View Research Report Summary, July 2019 available online here; “Water Flosser Market Size Worth $1.11 Billion By 2025 | CAGR: 4.7%,” Grand View Research Press Release, July 2019 available online here; “Oral Health,” World Health Organization, March 25, 2020 available online here; “Water Flossing,” Mouth Healthy, Amerian Dental Association available online here.
Image source: Waterpikinc, “File:Water Flosser.jpg,” Wikimedia Commons, March 23. 2011 available online here. Use of photo does not constitute an endorsement.

Baby Apparel

baby apparel

From low-priced onesies costing a couple of dollars to high-end ruffled dresses costing a couple of hundred dollars, baby apparel is the topic of this week’s post. Today’s market size shows global baby apparel revenues in 2018 and projected for 2025. Baby apparel refers to clothing for babies and toddlers 0 to 36 months old. 

In 2018, most of the clothing bought, more than 65%, was outerwear. When buying clothing parents look for convenience, comfort, and safety. Parents want clothing that can easily be put on a squirming child and clothing that will be easy to remove for diaper changes. They also want their child to be comfortable wearing the clothes, and they want their child to be safe in them. Most clothing made for babies worldwide is made of synthetic material with dyes that can cause skin irritation and rashes. This is especially a concern with underwear. As a result, parents are expected to increase spending on undergarments that are made from natural fiber and have antibacterial and antiviral protection. Flame retardancy is also a concern. While the United States has strict regulations, other countries may not, but more governments are expected to regulate their textile industries in the next few years and create policies to make baby apparel safer.

In addition to relying on regulations for safety, if there are any in the countries in which they live, parents are choosing clothing without drawstrings or adornments such as buttons and fancy laces that could be torn off or rip causing a child to trip or leading to a choking or strangling hazard. At the same time, new parents want stylish, durable clothing. Increasingly, fashion shows and exhibitions promoting baby apparel are being held around the world to showcase fashionable clothing lines. Some of these venues also launch new clothing lines for infants, toddlers, and children. Social media sites such as Facebook, Instagram, and Pinterest that allow parents to easily keep up with fashion trends are also influencing parents’ buying decisions.

Discounts offered on e-commerce sites such as Flipkart, Amazon, and Alibaba are increasing online shopping for baby clothes; however, in 2018, online revenues were a mere fraction of the revenues from offline channels. Sales at brick-and-mortar retail establishments comprised more than 75% of total global revenues. That being said, online sales are expected to increase faster than offline sales, at a compound annual growth rate of 6.1%, from 2019 to 2025. Carter’s, Inc.; Cotton On Group; Hennes & Mauritz AB; Gerber Childrenswear LLC; and Naartjie have been focusing on increasing their presence in brick-and-mortar stores to meet demand. In 2018, Carter’s Inc. had more than 1,000 stores in North America and more than 17,000 wholesalers. Other major manufacturers include Nike, Inc.; Gymboree Group, Inc.; and Industria de Diseño Textil, S.A. 

Geographic reference: World
Year: 2018 and 2025
Market size: $135.5 billion and $198.8 billion, respectively
Sources: “Baby Apparel Market Size, Share & Trends Analysis Report by Product (Outerwear, Underwear), by Distribution Channel (Offline, Online), by Region, and Segment Forecasts, 2019 – 2025, Grand View Research Report Summary, September 2019 available online here; “Baby Apparel Market Size Worth $198.8 Billion by 2025 | CAGR: 5.6%,” Grand View Research Press Release, September 2019 available online here; “Baby Clothing Market in the US 2015-2019,” Technavio Snapshot, April 2015 available online here; “Introduction to Japanese Underwear Designed While Putting the Safety of Babies First,” Pregnancy, Childbirth, Miki House, June 23, 2017 available online here.
Image source: Baby Natur, “Assorted-color Long-sleeved Dresses Photo,” Unsplash, June 14, 2019 available online here.

E-Pharmacies

e-pharmacies
E-pharmacies, also known as online pharmacies or mail-order pharmacies, are pharmacies that conduct business over the internet through a website or secure web portal. They send orders of both prescription and non-prescription drugs to customers via the mail or through shipping companies. In 2018, the majority of revenues at e-pharmacies came from over-the-counter medications.

In the United States, legitimate e-pharmacies require a valid prescription from a doctor or other health care professional before dispensing prescription drugs. They are licensed by the appropriate state agency and have a licensed pharmacist available to answer questions. They must also provide a street address. In many cases, e-pharmacy services are part of a person’s health insurance benefits. For example, OptumRx, Express Scripts, and CVS Caremark are affiliated with the UnitedHealth Group, Cigna, and Aetna health insurance companies, respectively.

Because prescription drug prices are high, some people turn to illegal pharmacies. Illegal pharmacies may send an unsolicited email offering medicine at a deep discount. These pharmacies are not licensed and allow people to buy prescription medication without a valid prescription from a health care provider. Buying pharmaceuticals from these types of businesses is risky. The medicines ordered may have too much or too little of the active ingredient, not contain the right active ingredient or contain harmful ingredients. An estimated 10% of medications available worldwide are counterfeit. In India and developing countries in Africa, Asia, and Latin America more than 30% are.

The European Medicines Agency is currently warning consumers to avoid online pharmacies that falsely claim that a product they sell can treat or prevent COVID-19. The U.S. Food and Drug Administration (FDA) and the Federal Trade Commission issued warnings to 7 companies and shut down dozens that claimed their products do the same. Currently, there are no approved medications to treat or prevent COVID-19 and there are no vaccines available.

Today’s market size shows worldwide e-pharmacy revenues for 2018 and projected for 2025.1 In 2018, 11% of adult pharmacy customers obtained their prescriptions from e-pharmacies. Since the outbreak of the COVID-19 pandemic, some online pharmacies have been seeing a surge in orders as people decide to avoid public places such as brick-and-mortar pharmacies and instead order their medications online. Whether these new e-pharmacy consumers will continue to order their medication in this way once the pandemic is over and life returns to normal is yet to be seen.

North America is the largest market for e-pharmacies and is expected to continue to be through 2025 due to the growing number of internet users coupled with their familiarity with using online services. A growing awareness of e-pharmacies, especially ones affiliated with large companies, as well as government campaigns meant to educate consumers about how to spot illegal e-pharmacies are also expected to contribute to North America’s domination of the market. Leading global e-pharmacy companies include The Kroger Co., The Walgreen Co., Express Scripts Holding, CVS Health, Doc Morris, Giant Eagle, Wal-Mart Stores, OptumRx, 1mg, and Netmeds.

1 Revenues are for legal businesses only.

Geographic reference: World
Year: 2018 and 2025
Market size: $42.32 billion and $107.53 billion, respectively
Sources: “Global Share of E-Pharmacy Market Size to Surpass USD 107.53 Billion by 2025,” Zion Market Research Press Release, July 26, 2019 available online here; “Online Pharmacy,” Wikipedia, March 7, 2020 available online here; “How to Buy Medicines Safely From an Online Pharmacy,” U.S. Food and Drug Administration, January 25, 2018 available online here; Hannah Balfour, “EMA Warns Consumers About Falsified COVID-19 Drugs from Online Pharmacies,” European Pharmaceutical Review, March 31, 2020 available online here; Hannah Balfour, “FDA and FTC Issue Warning Letters to Companies Selling Fraudulent COVID-19 Products,” European Pharmaceutical Review, March 10, 2019 available online here; András Fittler, PharmD, PhD, et. al., “Consumers Turning to the Internet Pharmacy Market: Cross-Sectional Study on the Frequency and Attitudes of Hungarian Patients Purchasing Medications Online,” Journal of Medical Internet Research, August 22, 2018 available online here; Matt Baron, “COVID-19 Sparks Surge in U.S. Online Pharmacy Purchases,” Patch, April 3, 2020 available online here.
Image source: National Cancer Institute, “A Male Pharmacist is Examining a Drug from the Pharmacy Inventory,” Unsplash, January 29, 2020 available online here.

Opioid Use Disorder Medications

opioid use disorder drugs

Before the world was dealing with the COVID-19 pandemic, another public health emergency was on the minds of everyone: the opioid abuse crisis. Opioid use disorder (OUD) is a chronic condition characterized by a compulsive, prolonged, repeated self-administration of opioids. Patients can be addicted to either prescription opioids such as hydrocodone, oxycodone, morphine, codeine, and fentanyl or non-medical opioids such as heroin. Prescription opioids are mostly used to treat moderate to severe pain, with some types also used to treat cough and diarrhea. In addition to relieving the medical conditions for which they were prescribed, they make a person feel very relaxed and euphoric which is why they’re also used for non-medical purposes.

Today’s market size shows the global revenues for drugs used in the treatment of OUD in 2018 and projected for 2026. Worldwide more than 53 million people aged 15-64, or 1.1% of that population, abused opioids in 2019. Sixty-six percent of global drug overdose deaths associated with drug use disorders were related to opioids. In the United States in 2018, 2.9 million people aged 15 and older suffered from OUD. According to the U.S. Centers for Disease Control, 130 people in the United States die from an opioid overdose every day. In 2017, 9% of overdose deaths linked to opioids occurred in people under the age of 25.  The United States declared the opioid abuse crisis a public health emergency on October 27, 2017. 

Treatment for OUD involves Medication-Assisted Treatment (MAT) with an opioid agonist or opioid antagonist in order to mitigate the cravings and the withdrawal symptoms that come from detoxification without producing the euphoria that the abused drug caused. MAT also includes behavioral therapy and counseling. Opioid agonists activate the same opioid receptors that drugs such as heroin and opioid pain medications do but they do so more slowly or less strongly than other opioids so they do not produce euphoria in those being treated for OUD. Methadone and buprenorphine are two types of opioid agonists. Opioid antagonists such as naltrexone block the activation of opioid receptors in the brain. They prevent any opioid drug from producing euphoria. Naltrexone has been limited as an ongoing treatment for opioid use disorder due to the drug not being tolerated by patients and patients not taking the medication as prescribed. In 2010 an injectable, long-acting form of naltrexone was approved by the U.S. Food and Drug Administration for use in the treatment of OUD. This form of the drug is preferable for people who don’t have ready access to healthcare or for those who find it difficult to take medications regularly. 

Globally, in 2018, more than half of the revenues from OUD drug treatment came from buprenorphine, followed by methadone and naltrexone. In the United States, buprenorphine also had the highest market share followed by methadone and naltrexone, although naltrexone’s share is predicted to surpass methadone by 2026. Buprenorphine was the first medication eligible to be prescribed by certified doctors through the Drug Addiction Treatment Act of 2000. This eliminated the need for patients to visit specialized treatment clinics thereby increasing access to treatment. The Comprehensive Addiction and Recovery Act, signed into law in 2016, expanded eligibility to prescribe buprenorphine-based drugs as part of MAT to qualifying nurse practitioners and physician assistants through October 1, 2021.

In 2018, the North American market generated the highest revenues and is expected to do the same through 2026 due to the opioid epidemic in the United States and Canada. Also, newer forms of medication to treat OUD are expected to come on the market in the United States during this time period. Several pharmaceutical manufacturers are leaders in this industry including Indivior, Alkermes, Titan Pharmaceuticals, Hikma Pharmaceuticals, Teva Pharmaceuticals, MediciNova, Orexo, Camurus, and Omeros. To increase market share companies are focusing on mergers and acquisitions in addition to launching their products in different regions of the world.

Geographic reference: World
Year: 2018 and 2026
Market size: $1.9 billion and $4.5 billion, respectively
Sources: “Opioid Use Disorder Market Size, Share & Trends Analysis Report by Drug (Buprenorphine, Methadone, Naltrexone), Competitive Landscape, and Segment Forecasts, 2019 – 2026,” Grand View Research Report Summary, July 2019 available online here; “Opioid Use Disorder Market Worth $4.5 Billion By 2026 | CAGR 10.1%,” Grand View Research Press Release, July 2019 available online here; Report of the International Narcotics Control Board for 2019, International Narcotics Control Board, January 2020 available online here; Andrew Saxon, MD, “Opioid Use Disorder,” American Psychiatric Association, November 2018 available online here; University of Southern California. “Teens Abusing Painkillers are More Likely to Later Use Heroin,” ScienceDaily, July 8, 2019 available online here; “Prescription Opioids,” Drug Facts, National Institute on Drug Abuse, July 2019 available online here; “Medications to Treat Opioid Use Disorder,” National Institute on Drug Abuse, June 2018 available online here.
Image source: Hal Gatewood, “Meds,” Unsplash, November 15, 2019 available online here.

Pet Insurance

pet insurance
In 2019, 84.9 million households owned at least one pet in the United States with 63.4 million households owning dogs and 42.7 households owning cats. At some time in their lives most, if not all, of these pets will need medical care, whether that be spaying or neutering, routine physical exams and immunizations, or more specialized care. Veterinary care is expensive. Pet owners reported paying an average of $160 per year for routine exams for cats and $212 for dogs. Average surgical costs climb into the hundreds, with some types of specialized care, such as chemotherapy for cancer or cataract surgery, costing thousands of dollars. Add to that the cost of medications and some pet parents may need to spend upwards of several hundred to several thousand dollars a year to keep their pets healthy. Overall, in 2019, pet parents spent an estimated $29.3 billion on veterinary care in the U.S., up from $27.7 billion in 2018.1 Knowing that pet health care is expensive, an increasing number of pet parents are buying pet insurance policies.

Today’s market size shows the total amount of premiums paid for pet health insurance in 2014 and 2018 and projected for 2022 in the United States. The first animal insurance policy was written in Sweden in 1890. At the time, coverage focused on horses and livestock. In the United States, TV star Lassie received the first pet insurance policy in 1982. By 2018, 2.16 million pets were insured, an 18% increase from the year before. An overwhelming majority of policies, 98%, were accident and illness plans or insurance with embedded wellness plans. Premiums for accident and illness plans averaged $529 per year. The other two percent were accident-only policies, with premiums averaging $177 per year. In North America, 88.9% of policies provide coverage for dogs.

The pet health insurance market will continue to grow according to a report2 by the research firm Packaged Facts. Insurance companies’ use of their websites and social media for marketing as well as partnerships with veterinarians, animal shelters and breeders are expected to increase consumer awareness of insurance offerings and discounts. The use of technology to handle customer interactions more efficiently as well as expanding coverage to pets other than cats and dogs will also contribute to future growth in the industry according to the report.

1 Figures are for veterinary care and product sales. According to the American Pet Products Association: “In addition to routine veterinary care, surgical procedures and sales of pharmaceuticals and other products through veterinary clinics are now included. With clinics appearing in major retailers’ stores and veterinary telemedicine platforms on the rise, veterinary services are becoming more accessible.”
2 Pet Insurance in the U.S., 6th Edition

Geographic reference: United States
Year: 2014, 2018 and 2022
Market size: $588.4 million, $1.30 billion and $2 billion, respectively
Sources: State of the Industry Report 2019, North American Pet Health Insurance Association, June 11, 2019 available online here; “Five Trends That Will Double The U.S. Pet Health Insurance Market by 2022,” Veterinary Practice News, October 6, 2018 available online here; “Pet Industry Market Size & Ownership Statistics,” American Pet Products Association available online here; “Americans’ Pet Spending Reaches Record-Breaking High: $95.7 Billion,” American Pet Products Association Press Release, February 27, 2020 available online here; “History of Pet Health Insurance,” North American Pet Health Insurance Association available online here; Grace Schneider, “Pet Insurance Company Success is Off the Leash,” USA Today for the Lansing State Journal, February 27, 2019, page 3B.
Image source: Seaq68, “nature-friends-dog-pet-woman-suit-3042751,” Pixabay, December 27, 2017 available online here.

Smart Robots

smart robots
Smart robots have artificial intelligence systems that allow them to learn from their environment and experience. They are designed to do tasks without the supervision of humans but they can also collaborate with and work beside human beings and learn from human behavior. 1

Today’s market size shows the revenues from smart robots in 2017 and projected for 2025. Because of their accuracy and efficiency, smart robot adoption is significantly higher in the manufacturing, automotive, healthcare and retail industries. Smart robots for manufacturing dominated the industrial segment of the market in 2017. Smart vacuum cleaners constituted most of the residential segment. Growth in this segment is expected to come from increased demand for other types of smart household cleaning machines (mopping, lawn mowing, pool cleaning) as well as for smart vacuums.

Mobile robots and robots used in a healthcare setting comprise the majority of the professional services segment. Autonomous mobile robots can dynamically re-route themselves due to their advanced sensory and enhanced intelligence systems. As a result no special infrastructure alterations are needed to deploy these devices. This capability gives them an advantage over autonomous guided vehicles that have been used mainly for warehouse distribution and logistics applications. Smart robots used in a healthcare setting are helping doctors perform surgery, disinfecting hospital rooms, providing precise radiation therapy for cancer treatment, and transporting meals, linens, lab samples, waste and other items throughout hospitals. Smart robots such as PARO, a fuzzy, baby harp seal-shaped therapeutic robot, provide comfort, reduce stress, and help improve the socialization skills of people with dementia and similar conditions.

Since the outbreak of COVID-19, disinfection robots have been in high demand. Chinese hospitals have ordered more than 2,000 UVD robots from Blue Ocean Robotics alone. These robots move autonomously around patient and operating rooms using UV-C light to kill 99.99% of viruses and bacteria throughout the room in about 10 minutes. If a person enters the room, the robot automatically shuts off the UV-C light. A device such as this can also be used in offices, schools, shopping malls, airports, and manufacturing facilities.

Notwithstanding the demand caused by COVID-19, growth in the overall smart robot market is expected to be caused by several factors: increasing demand for service robots, increasing adoption of artificial intelligence and Internet of Things applications, falling prices due to innovation and a proliferation of the technology, and the use of robotics in mobile and other smart devices. Government and venture capital funding for smart robots and related technologies is also expected to enhance demand in the near future. Leading manufacturers include ABB Ltd; iRobot Corp.; Kuka AG; Fanuc Corp.; Yaskawa Electric Corp.; Panasonic Industry Europe GmbH; OTC Daihen Inc.; Kawasaki Heavy Industries; Intuitive Surgical Inc.; and Omron Adept Technologies, Inc.

1 See also our Collaborative Robots post.

Geographic reference: World
Year: 2017 and 2025
Market size: $4.06 billion and $17.56 billion, respectively
Sources: “Smart Robot Market by Component (Hardware and Software), Application (Welding & Painting, Assembling & Disassembling, Mobility, Inspection & Security and Others), Industry Vertical (Automotive, Manufacturing, Electrical & Electronic, Food & Beverage, Chemical, Residential, and Others) – Global Opportunity Analysis and Industry Forecast, 2018-2025,” Allied Market Research Report Overview, June 2018 available online here; “Smart Robots Market Size, Share & Trends Analysis Report by Component (Hardware, Software, Service), by Application, by End Use (Industrial, Commercial, Residential), by Vertical, by Region, and Segment Forecasts 2018-2025,” Grand View Research Report Summary, October 2018 available online here; “5 Medical Robots Making a Difference in Healthcare,” Case Western Reserve University, Case School of Engineering, December 28, 2017 available online here; “Executive Summary World Robotics 2019 Service Robots,” International Federation of Robotics, September 18, 2019 available online here; Bennett Brumson, “New Applications for Mobile Robots,” Robotics Industry Insights, April 5, 2012 available online here; Angela Johnston, “Robotic Seals Comfort Dementia Patients But Raise Ethical Concerns,” KALW, August 17, 2015 available online here; “Robots Help to Fight Coronavirus Worldwide,” International Federation of Robotics Press Release, March 31, 2020 available online here; “PARO Therapeutic Robot” available online here.
Image source: Pete Linforth, “connection-hand-human-robot-touch-3308188,” Pixabay, April 10, 2018 available online here.

Dental Implants

dental implants
According to a survey by the American Academy of Cosmetic Dentistry (AACD), worldwide, 95% of people said that their smile is a vital social asset and 84% report feeling pressure to perfect their smile. In the United States, 74% of people surveyed feel that an unattractive smile can hurt a person’s chance for career success. In a consumer study conducted by Beall Research & Training for the AACD, respondents who were asked to quickly judge a person based on a photograph were more likely to describe a person with a more perfect smile as intelligent, attractive, popular with the opposite sex, wealthy, and successful in their career among many other positive traits. When asked what makes a smile unattractive, “missing teeth” was second among responses behind “discolored, yellow or stained teeth.”

One way to fix the problem of missing teeth is with dental implants.1 With a dental implant, a screw-like device is implanted into a patient’s jawbone. This acts as an anchor for an artificial tooth, called a crown. A device called an abutment attaches to the anchor on one end and the crown on the other. The crown is custom made to fit the person’s mouth and to match the color of the existing teeth. Newer implants are made as one-piece systems. There are two types of dental implants: titanium and zirconia. The majority of dental implants are made of titanium due to their durability and cost-effectiveness. Titanium has been used in medical applications since the 1950s. Zirconia is nonmetallic but strong and durable. It’s also hypoallergenic. Zirconia is an option for people who are allergic to titanium. Patients may choose zirconia implants for several other reasons also. Zirconia implants are white. Those with receding gums may prefer an implant that offers a more natural look as opposed to titanium implants which can make the gums appear gray. Zirconia implants can be placed immediately following a tooth extraction, which results in shorter recovery time and less pain following the procedure. The one-piece design also eliminates the problem of bacteria possibly getting in between the anchor and abutment in two-piece titanium implants and zirconia is more resistant to corrosion than titanium. Zirconia implants are expected to be the fastest-growing segment through at least 2027.

Today’s market size shows global dental implant revenues for 2019 and 2027. Data for 2027 are projected. In 2019, Europe had the highest share of revenues, followed by North America and the Asia-Pacific region. In 2018, the European Union had 101.1 million people aged 65 and older. This number is projected to reach nearly 150 million by 2050, or 28.5% of the population. Older adults are more likely to experience tooth decay and tooth loss. As a result, the market for dental implants in Europe is expected to continue to grow over this time period. The Asia-Pacific region is expected to be the fastest-growing market through 2027 due to an aging population that is experiencing an increased incidence of osteoporosis and calcium deficiency leading to tooth loss. In addition, increasing economic stability and disposable income allowing people to afford the procedures will contribute to this growth. In the United States, nearly 5 million implants are placed yearly according to the American Dental Association. An estimated 69% of Americans between the ages of 35 and 44, the average age range when tooth loss begins, have at least one missing tooth. Twenty-four percent of those 74 years and older are completely edentulous. High demand coupled with a growing subset of the population able to afford dental implants will contribute to growth in the United States. Worldwide, an increasing number of dental injuries due to traffic accidents and sports injuries will also contribute to industry growth over this time period.

Leading dental implant manufacturers include BioHorizons IPH, Inc.; Nobel Biocare Services AG; Zimmer Biomet Holdings, Inc.; OSSTEM IMPLANT; Institut Straumann AG; Bicon, LLC; Leader Italy; Anthogyr SAS; DENTIS; DENTSPLY Sirona; DENTIUM Co., Ltd.; T-Plus Implant Tech. Co.; and KYOCERA Medical Corporation.

1 As with all surgical procedures, there are risks of complications. Also, not all people with missing teeth are candidates for dental implants. A person’s overall health and health of the bone and tissue at the implant site are factors dental surgeons take into consideration before performing dental implant surgery.

Geographic reference: World
Year: 2019 and 2027
Market size: $4.6 billion and $9.0 billion, respectively
Sources: “Dental Implants Market Size, Share & Trends Analysis Report by Type (Titanium, Zirconia), by Region (North America, Europe, Asia Pacific, Latin America, MEA), and Segment Forecasts, 2020 – 2027,” Grand View Research Report Summary, March 2020 available online here; “Dental Implants Market Size Worth $9.0 Billion by 2027 | CAGR: 9.0%: Grand View Research, Inc.,” CISION PR Newswire, March 18, 2020 available online here; “Can a New Smile Make You Appear More Successful and Intelligent?” Consumer Studies available online here; “What to Know About Dental Implants,” Medical News Today available online here; Bill Smye, “Everything About Titanium for Orthopedic Applications,” Matmatch, October 12, 2017 available online here; “7 Reasons You Might Choose Metal-Free Zirconia Dental Implants,” Friedman Dental Group, May 14, 2017 available online here; “Ageing Europe: Looking at the Lives of Older People in the EU 2019 Edition,” Eurostat, September 2019 available online here.
Image source: Peter Kasprzyk, “Dental Implants,” Unsplash, July 14, 2016 available online here.