Roads in Texas

As a nation of heavy drivers, it is not surprising that we have an awful lot of paved roads. And in this nation of drivers, the largest state in terms of the number of miles of paved roads is Texas. While Alaska is the state with the larger geographical area, it is sparsely populated compared to Texas, the state with the second largest number of square miles.

Geographic reference: Texas
Year: 2008
Market size: 306,404 miles
Source: “Table 1-1: Public Road Length, Miles by Functional Systems: 2008,” State Transportation Statistics 2009, page A-1.
Original source: Research and Innovation Technology Administration, Bureau of Transportation Statistics, U.S. Department of Transportation

Paved Roads

Roads by Type

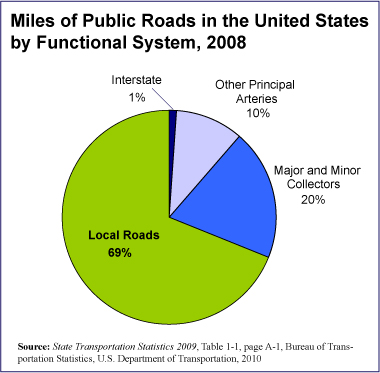
As a nation of heavy drivers, it is not surprising that we have an awful lot of paved roads. The market size presented here is for miles of paved, public roads in the United States. The chart shows how those roads are broken down by type: interstate freeways, other highways (arteries), smaller roads feeding the highway system (collector roads), and local roads.

Geographic reference: United States
Year: 2008
Market size: 4,042,778 miles
Source: “Table 1-1: Public Road Length, Miles by Functional Systems: 2008,” State Transportation Statistics 2009, page A-1.
Original source: Research and Innovation Technology Administration, Bureau of Transportation Statistics, U.S. Department of Transportation

Vehicle Registrations

Here, we look at automobile registrations as well as light truck registrations. These vehicles are used for both personal and commercial purposes but can be seen as primarily vehicles for personal use.

Geographic reference: United States
Year: 2008
Market size: Automobiles, 137.1 million and Light Trucks, 101.2 million
Source: “United States Fast Facts,” State Transportation Statistics 2009, page V.
Original source: Research and Innovation Technology Administration, Bureau of Transportation Statistics, U.S. Department of Transportation

Motorcycle Travel

This past decade or so has seen increased number of passenger-miles traveled by motorcycle in the United States. Yet a closer look at the data shows that since the number of motorcycles registered rose at a faster rate (81%) than did the passenger-miles traveled (59%) between 2000 and 2008, each bike, on average, actually traveled slightly fewer miles in 2008 than it did in 2000. Motorcycle registrations in the United States numbered 4.3 million in 2000 and 7.8 million in 2008.

Geographic reference: United States
Year: 2000 and 2008
Market size: 11,516 and 18,395 million passenger-miles respectively
Source: “Table 1-37: U.S. Passenger Miles (Millions),” Bureau of Transporation Statistics, National Transportation Statistics, available online here.

Rail Travel in the United States

Passanger-Miles on Rail

Today is another day of travel for millions of Americans as they head home after the Thanksgiving Holiday. So, here’s another market size related to travel, this time, travel by rail. Rail passenger-miles are presented here for intercity rail commuting. These data do not include commuter rail within a metropolitan area. This mode of transportation saw a sharp decline in the 1960s, a decline which had been in progress through the entirety of the 20th century. The chart shows passenger-miles traveled by rail each decade since 1960. This chart shows quite a different pattern than is seen when charting all other passenger travel modes tracked by the U.S. Bureau of Transportation Statistics. A few days ago, we charted air travel passenger-miles, by way of comparison.

Geographic reference: United States
Year: 2008
Market size: 6,179 million passenger-miles
Source: “Table 1-37: U.S. Passenger Miles (Millions),” Bureau of Transportation Statistics, National Transportation Statistics, available online here.

Midwives in the United States

In honor of a friend of ours, on her birthday, we thought we’d post a market size about the number of births in the United States that are attended to by midwives. Many people believe that midwives deliver primarily babies born outside of hospitals but this is not true. The vast majority of the births attended to by midwives (96.7%) are hospital births. Overall, in 2006—the most recent year for which data are available—of the total number of births registered in the United States, 8.7% were attended to by a midwife. In Europe, by way of comparison, that percentage tends to be in the 75% range. Our friend, she is a midwife practicing at a hospital in France.

Geographic reference: United States
Year: 2006
Market size: Births attended by a midwife in the United States, 336,347 or 8.7% of all registered births
Source: “Trends and Characteristics of Home and Other Out-of-Hospital Births in the United States, 1990-2006,” National Vital Statistics Report, Volume 58, Number 1, March 3, 2010, available online here.
Original source: U.S. Department of Health and Human Services, Centers for Disease Control and Prevention, National Center for Health Statistics

Highway Miles Driven

During this holiday week in which many people will be traveling, we present some market sizes for travel, measured in the number of passenger-miles traveled by different modes of transportation. Today, the miles we travel on highways in passenger cars (56.8% of the total), motorcycles (0.4% of total) and what the Department of Transportation calls “other 2-axle, 4-tire vehicles” (42.8% of total).

Geographic reference: United States
Year: 2008
Market size: 4,493 billion passenger-miles
Source: “Table 1-37: U.S. Passenger Miles (Millions),” Bureau of Transporation Statistics, National Transportation Statistics, available online here.

Miles Traveled by Air

Air Miles Traveled
During this holiday week in which many people will be traveling, we present some market sizes for travel, measured in the number of passenger-miles traveled by different modes of transportation. Today we look at air travel. Air carrier passenger-miles are computed by summing the products of the aircraft-miles flown on each inter airport segment multiplied by the number of passengers carried on that segment. Air travel has seen steady growth over the years as can be seen in the chart, produced with data in the source listed below.

Geographic reference: United States
Year: 2008
Market size: 583,506 million passenger-miles
Source: “Table 1-37: U.S. Passenger Miles (Millions),” Bureau of Transporation Statistics, National Transportation Statistics, available online here.

Market for Cement in Brazil

Many nations in Latin America have recovered far more quickly from the global downturn that began in 2008 than has the United States. As a basic building material, the demand for cement serves as an indicator of how the construction industry is faring from country to country. Brazil’s construction industry is doing quite well and is forecast to grow sharply over the next five years. The market sizes presented here are based on demand for cement. The figure for 2015 is a forecast by the source.

Geographic reference: Brazil
Year: 2010 and 2015
Market size: 58 million and 75 million metric tons respectively
Source: “News North and South America: Brazil Forecast to Experience Big Growth,” Global Cement Magazine, November 2010, page 41.

Cement Market in Thailand

Asia has recovered far more quickly from the global downturn that began in 2008 than have the industrialized nations of Europe and the Americas. Complicating matters for the industrialized nations, and in particular the United States, is the nature of the bubble that burst to create the downturn. It was the housing market that was being bet on to inflate the bubble and when that crashed, the overbuilding which took place during the bubble growth period left the construction industry in serious trouble. But, that trouble is not seen everywhere in the world. As a basic building material, the demand for cement serves as an indicator of how the construction industry is faring nation by nation. Thailand has seen healthy growth in the demand for cement in 2010 despite the upheaval caused by flooding in that nation during the late summer.

Geographic reference: Thailand
Year: 2010
Market size: 24 million metric tons
Source: “News Asia: Siam Cement Group Profits Down Slightly,” Global Cement Magazine, November 2010, page 43.
Original source: Siam Cement Group

Muslim Population

Today is Eid al Adha, an important Muslim holiday which marks the end of Hajj, the annual Muslim pilgrimage to Mecca. The name of this holiday is usually translated as “Festival of Sacrifice”. With a nod of recognition of this holiday we look today at the size of the Muslim population worldwide. We have always used the term “market” quite broadly on this site, measuring everything from the size of the market for cement to the size of the voting population and the size of the demand for pumpkins, jack-o-lanterns, and candy around Halloween.

The population size presented here is taken from a Pew Research Center report which provides a great deal of interesting information about Muslims around the word. A link to that report is provided in the source note below.

Geographic reference: World
Year: 2009
Market size: 1.57 billion
Source: “Mapping the Global Muslim Population; A Report on the Size and Distribution of the World’s Muslim Population,” The Pew Forum on Religion and Public Life, October 7, 2009, available online here.
Original source: Pew Research Center

Chiropractic Services

The market size presented here is based on revenue from all offices offering primarily chiropractic services in the United States. The Bureau of the Census definition for this industry reads as follows: “This industry comprises establishments of health practitioners having the degree of D.C. (Doctor of Chiropractic) primarily engaged in the independent practice of chiropractic. These practitioners provide diagnostic and therapeutic treatment of neuromusculoskeletal and related disorders through the manipulation and adjustment of the spinal column and extremities, and operate private or group practices in their own offices (e.g., centers, clinics) or in the facilities of others, such as hospitals or HMO medical centers.”

Geographic reference: United States
Year: 1997 and 2007
Market size: $6.57 billion and $10.15 billion in annual receipts respectively
Source: “2007 Economic Census: Sector 62: Health Care and Social Assistance Programs: Preliminary Comparative Statistics for the United States 2007 and 2002”, March 26, 2010, available online here. Data for 1997 are from a report by the same title in the “1997 Economic Census” series.
Original source: U.S. Bureau of the Census

Veteran Population

Military Population

The number of military veterans in the United States is our focus on this Veterans Day.

The chart we present here shows three population figures over more than a half century: Active Duty Military, Military Veterans, and the overall population, by way of comparison. The veterans population is shown as the dark blue columns along the bottom of the chart.

We offer our sincere thanks to all those who have served—or are serving—this country in one of our military branches.

Geographic reference: United States
Year: 1980 and 2008
Market size: 28.6 million and 23.2 million respectively
Source: Statistical Abstract of the United States, editions 1980, 1990 and 2010. Recent editions are available online here.
Original source: U.S. Bureau of the Census

Iron Ore Mining

Today we look at iron ore, as a sort of hat tip to the anniversary of the sinking of the Great Lakes freighter, the Edmund Fitzgerald, thirty-five years ago today. The Fitzgerald was carrying iron ore pellets.

The Bureau of the Census definition of iron ore mining reads as follows: “This industry comprises establishments primarily engaged in (1) developing mine sites, mining, and/or beneficiating (i.e., preparing) iron ores and manganiferous ores valued chiefly for their iron content and/or (2) producing sinter iron ore (except iron ore produced in iron and steel mills) and other iron ore agglomerates.

Geographic reference: United States
Year: 2007
Market size: $2.96 trillion (value of primary product shipments)
Source: “2007 Economic Census: Sector 21: Mining: Preliminary Comparative Statistics for the United States 2007 and 2002”, October 16, 2009, available online here.
Original source: U.S. Bureau of the Census

Coal Mining Industry

The United States has the largest proven coal reserves in the world. The market size presented here is based on employment within the U.S. coal mining industry.

Geographic reference: United States
Year: 2009
Market size: 87,755 people
Source: “Annual Coal Report, 2009,” October 1, 2010.
Original source: Energy Information Administration, U.S. Department of Energy

Medical Laboratories

As is true with all the sectors of the health care industry, medical laboratories have seen significant growth over the last decade plus with revenues more than doubling between 1997 and 2007.

The Bureau of the Census definition for “medical laboratories” reads as follows: “This U.S. industry comprises establishments known as medical laboratories primarily engaged in providing analytic or diagnostic services, including body fluid analysis, generally to the medical profession or to the patient on referral from a health practitioner.”

Geographic reference: United States
Year: 1997 and 2007
Market size: $10.4 billion and $24.3 billion in annual receipts respectively
Source: “2007 Economic Census: Sector 62: Health Care and Social Assistance Programs: Preliminary Comparative Statistics for the United States 2007 and 2002,” March 26, 2010, available online here. Data for 1997 are from a report by the same title in the “1997 Economic Census” series.
Original source: U.S. Bureau of the Census

Diagnostic Imaging Services

The increased use of electronic machinery for medical diagnosing has given us more accurate diagnostic tools, tools which can often be used instead of more invasive surgical intervention. Diagnostic imaging centers are at the center of the medical services industry. Revenues earned by diagnostic imaging centers grew by 200% between 1997 and 2007, an annual growth rate of 18.1%. By way of comparison, the inflation rate over this period averaged 2.6% annually.

The activities which fall under the umbrella term “diagnostic imaging” include four major types of scans: 1. Radiological (x-rays); 2. Computer Tomography (CT); 3. Magnetic Resonance Imaging (MRI), and 4. Ultrasound. Worth noting is the fact that the term also refers to the activities undertaken by physicians, now and throughout history, when they used their tactile sense, feeling an area of the body in order to visualize the condition of internal organs. The services offered at diagnostic imaging centers do not include this most basic form of diagnostic imaging.

Geographic reference: United States
Year: 1997 and 2007
Market size: $5.87 billion and $17.58 billion in annual receipts respectively
Source: “2007 Economic Census: Sector 62: Health Care and Social Assistance Programs: Preliminary Comparative Statistics for the United States 2007 and 2002,” March 26, 2010, available online here. Data for 1997 are from a report by the same title in the “1997 Economic Census” series.
Original source: U.S. Bureau of the Census

Lighting Worldwide

Lots of light bulbs
On the eve of the end of daylight savings for 2010 in the United States, we are headed into a darker period and one in which we’ll be switching on the lights earlier and earlier each day. So, today we look at the lighting market worldwide. According to a speech by the chairman of Philips Lighting North America, Kaj de Daas, there were approximately 4 billion screw-in light sockets in the United States in 2008. In terms of the global lighting market, Royal Philips, parent company of Philips Lighting North America, represents approximately 5% of the total.

Geographic reference: World
Year: 2008
Market size: $75 billion
Source: “The Global Lighting Market, Courtesy of Philips,” Seeking Alpha, October 23, 2008, available online here.
Original source: Philips Lighting North America

Home Health Care Market

Yesterday’s post looked at the growth of receipts at hospitals in the United States between 1997 and 2007. Their receipts grew at a healthy clip of 10% a year over this period. The market for home health care services saw even greater growth over this period. Revenues generated by home health care service providers grew at an average rate of 33% per year between 1997 and 2007. There were 3,375 establishments primarily engaged in providing home health care services in the United States in 1997 and in 2007 there were 22,975 such establishments.

The Bureau of the Census definition for the “home health care services” industry reads as follows: “This industry group comprises establishments primarily engaged in providing skilled nursing services in the home, along with a range of the following: personal care services; homemaker and companion services; physical therapy; medical social services; medications; medical equipment and supplies; counseling; 24-hour home care; occupation and vocational therapy; dietary and nutritional services; speech therapy; audiology; and high-tech care, such as intravenous therapy.”

Geographic reference: United States
Year: 1997 and 2007
Market size: $10.1 billion and $46.2 billion in annual receipts respectively
Source: “2007 Economic Census: Sector 62: Health Care and Social Assistance Programs: Preliminary Comparative Statistics for the United States 2007 and 2002,” March 26, 2010, available online here. Data for 1997 are from a report by the same title in the “1997 Economic Census” series.
Original source: U.S. Bureau of the Census

Hospitals

People who follow these mattters at all know that expenditures on health care in the United States have been rising steadily and at a pace far higher than inflation for many years now. So, it comes as no surpise to see the size of the market for hospital services more than double in the period 1997 to 2007. Hospital revenues grew by 108.6% between 1997 and 2007 which is 80% above the rate of inflation over this period.

The Bureau of the Census definition of the industry covered by this market size, a subset of the overall health care industry, reads as follows: “Industries in the Hospitals subsector provide medical, diagnostic, and treatment services that include physician, nursing, and other health services to inpatients and the specialized accommodation services required by inpatients. Hospitals may also provide outpatient services as a secondary activity. Establishments in the Hospitals subsector provide inpatient health services, many of which can only be provided using the specialized facilities and equipment that form a significant and integral part of the production process.”

Geographic reference: United States
Year: 1997 and 2007
Market size: $339 billion and $707 billion in annual receipts respectively
Source: “2007 Economic Census: Sector 62: Health Care and Social Assistance Programs: Preliminary Comparative Statistics for the United States 2007 and 2002,” March 26, 2010, available online here. Data for 1997 are from a report by the same title in the “1997 Economic Census” series.
Original source: U.S. Bureau of the Census