Wholesale Trade

The last couple of posts have been about the size of certain wholesale and retail industries. We thought that we’d spend this week on a few key wholesale industries that have seen particular declines over the last decade or so. In order to place those industry’s relative health into a larger context, we’ll start off with a look at the entire industry as a whole, all wholesalers. There is a clear pattern of consolidation evident as the number of establishments declined while sales grew. Overall, the sector looks pretty healthy as of 2007, ending that year with fewer establishments but 8.6% more employees than in 1997 and a nearly 50% increase in sales. Unfortunately, December 2007 was also the official start of a significant recession.

Geographic reference: United States
Year: 1997 and 2007
Market size: Number of Establishments: 453,470 and 432,094 respectively for a decrease of 4.7%.
Market size: Sales: $4,059.7 and $6,039.2 billion respectively for an increase of 48.76%.
Source: “Sector 00: EC0700CADV2: All Sectors: Core Business Statistics Series: Advanced Compariative Statistics for the United States (2002 NAICS Basis): 2007 and 2002,” 2007 Economic Census, available online here. The data from 1997 are from the 1997 Economic Census.
Original source: U.S. Department of Commerce, Bureau of the Census.

Office Equipment and Computer Wholesalers

The way we move food, for example, from producer to end user has not changed a great deal in the last decade. The way we move office equipment and computers from producer to end user has changed greatly. The wholesalers of office equipment and computers have seen their business shrink significantly and the routes used to get these products to the end user have bypassed traditional wholesalers.

Worth noting is the fact that the effects of the recession, which began in December 2007, are not yet visible in these market size data. The markets presented here are for two Census Bureau defined industries: Office Equipment Merchant Wholesalers [NAICS 42-3420], and Computer and Computer Peripheral Equipment Wholesalers [NAICS 42-3430].

Geographic reference: United States
Year: 1997 and 2007
Market size: Number of Establishments: 24,248 and 17,801 respectively.
Market size: Sales: $258.09 and $290.39 billion respectively.
Source: “Sector 42: EC0742I2: Wholesale Trade: Industry Series: Preliminary Comparative Statistics for the U.S. (2002 NAICS): 2007 and 2002,” 2007 Economic Census, available online here. The data from 1997 are from the 1997 Economic Census.
Original source: U.S. Department of Commerce, Bureau of the Census.
Furniture Stores

The furniture industry is one that has been experiencing a significant shift in how it gets product to market. Wholesaling is declining as a segment of the overall distribution of furniture in the United States. Retailers have also declined slightly in numbers but their sales have risen as has the number of people employed by furniture stores. This shows that there has been some consolidation of furniture stores. Worth noting is the fact that furniture sales benefitted from the housing boom, which ended in December 2007 when the recession began. Effects of the recession are not visible in these data. The market size data presented here is for all furniture retailers which are covered as a group in the U.S. Census Bureau designated industry, NAICS 442 [Furniture and Home Furnishing Stores].

Geographic reference: United States
Year: 1997 and 2007
Market size: Number of Establishments: 64,725 and 64,590 respectively.
Market size: Sales: $71.7 and $107.8 billion respectively.
Source: “Preliminary Comparative Statistics for the U.S. (2002 NAICS): 2007 and 2002,” 2007 Economic Census, available online here. The data from 1997 are from the 1997 Economic Census.
Original source: U.S. Department of Commerce, Bureau of the Census.

Furniture Wholesalers

The furniture industry is one that has been experiencing a significant shift in how it gets product to market. The role of the wholesaler in the distribution of furniture in the United States is declining as large retailers go directly to manufacturers and manufacturers set up their own direct sales outlets. The market size data presented here are for all furniture wholesalers and include the two industries designated by the U.S. Census Bureau with NAICS codes 42-3210 [Furniture Merchant Wholesalers] and 42-3220 [Home Furnishing Merchant Wholesalers].

Tomorrow we will look at furniture retailers.

Geographic reference: United States
Year: 1997 and 2007
Market size: Number of Establishments: 15,246 and 14,433 respectively.
Market size: Sales: $75.01 and $91.25 billion respectively (error in original post corrected on Feb. 7, 2011).
Source: “Sector 42: EC0742I2: Wholesale Trade: Industry Series: Preliminary Comparative Statistics for the United States (2002 NAICS Basis): 2007 and 2002,” 2007 Economic Census, available online here. The data from 1997 are from the 1997 Economic Census.
Original source: U.S. Department of Commerce, Bureau of the Census.

Shopping Centers

The ways in which we buy things in the United States has been changing over the last two decades and continues to be in a state of flux as the lines between traditional wholesalers and retailers are blurred and the rise of online shopping alters the retail landscape. We’ll look at a few market size items over the next few days that highlight how these sectors are being changed. Today we look at the leasable area that is offered in shopping centers throughout the nation.

Geographic reference: United States
Year: 1990 and 2009
Market size: 4,788 and 7,232 gross leasable area measured in millions of square feet, respectively.
Source: “Table 106 – Shopping Centers—Number and Gross Leasable Area: 1990 to 2009,” Statistical Abstract of the United States: 2011, page 666, availalble online here.
Original source: U.S. Department of Commerce, Bureau of the Census, and CoStar Group, Inc.

Yogurt Production

The dairy industry is broken into several product categories. Of these, yogurt is the one that has seen the greatest growth over the last decades. Between 1990 and 2009, the production of yogurt in the United States rose 291.4%. By way of comparison, the U.S. population grew by 24% in this same time period. While production of all dairy products grew, yogurt was by far the leading category. Butter production grew by 20.8% and the production of all cheeses grew 66.78% while the quantity of yogurt almost trebled during this two-decade period.

Geographic reference: United States
Year: 1990 and 2009
Market size: 978.9 million and 3.832 billion pounds respectively.
Source: “Dairy Products, 2009 Summary,” USDA publication, April 2010, page 9, available online here. Data for 1990 are from the 1991 edition of the USDA report.
Original source: U.S. Department of Agriculture, National Agricultural Statistics Service

Gold Bars

A National Geographic journalist, while on assignment for the journal, was given a tour of the vast Paris underground, a maze of structures excavated over the years at various levels under the surface of the Earth. Gold Bars It consists of old crypts, used and unused sewer lines, metro train tunnels, the empty quarries from which much of the stone used to build the city was extracted, and heavily fortified vaults under banks and museums. The journalist and author of the source article, Neil Shae, and his colleague, photographer, Stephen Alvarez, were taken into the vault under the Banque de France and shown the French national gold reserves which are kept there in piles and piles of gold bars, each valued at around $500,000.

Geographic reference: France
Year: 2010
Market size: Approximately 2,600 tons.
Based on the price of gold on the international market on January 28, 2011, the approximate value of the gold bars under the Banque de France is $120.1 billion.
Source: “Under Paris,” National Geographic, February 2011, page 124. The image of gold bars we use here comes from a Banque de France Annual Report, available online here.
Original source: Banque de France

Buttermilk

The United States produces and consumes a great deal of dairy food, buttermilk being one of the small product categories within this huge market. The market size presented below is the quantity of buttermilk produced in the United States in 2009. It represents 3% of all milk products and a mere 0.6% of all dairy products.

Geographic reference: United States
Year: 2009
Market size: 125.3 million pounds.
Source: “Dairy Products, 2009 Summary,” USDA publication, April 2010, page 9, available online here.
Original source: U.S. Department of Agriculture, National Agricultural Statistics Service

Coffee

In the Upper Midwest of the United States this time of year, our love of hot drinks is particularly noticeable, as it is, no doubt, anywhere the temperatures drop below freezing and stay there a while. This made us think of the market for coffee. The market sizes presented here are world production figures for two years.

The production of this commodity is tracked in 60-kilogram bags of the beans. The price of coffee is tracked by the International Coffee Organization and has been rising steadily in recent years. Based on the monthly composite indicator price at which coffee is traded on the New York market the price rose 160% between December 2000 and December 2009. Over the same period, world inventories grew by 40%. And, since December 2009 the price has continued to rise, reaching 173.9 cents per pound in November 2010, the equivalent to 260% of the price per pound back in December 2000. Savor every sip!

We could do a simple calculation to get a rough approximation of the value of coffee produced in 2010, based on the information in our source report. If the November composite price for all types of coffee beans was $1.74, then a 60-kilogram bag would cost about $47.33 and thus world production in 2010 was worth approximately $5.6 billion. Of course, this is a very crude approximation so take it for what it is worth.

Geographic reference: World
Year: 2008 and 2010
Market size: 133.6 million and 139 million 60-kilogram bags respectively.
Source: “Coffee: World Markets and Trade,” USDA Circular Series, Table 6 and Table 8, December 2010, available online here.
Original source: U.S. Department of Agriculture, Foreign Agricultural Service, and the International Coffee Organization.

Bricks

Today we look at the market size of another construction materials industry that has been hard hit by the housing crisis in the United States. The market size being presented here, for two different years, is the number of standard brick equivalents or SBEs shipped by the industry per year. It is worth noting that the interim years, between 1995 and 2009, saw strong sales and shipments—in the range of 8 to 9 billion SBEs—but did not skyrocket quite as much as some other construction material sectors.

Geographic reference: United States
Year: 1995 and 2009
Market size: 7.0 billion and 3.7 billion SBEs respectively.
Source: “Boral USA, Analyst Visit,” a presenation, table 60, September 2009.
Original source: Boral Ltd. and Brick Industry Association

Drug Company R&D

The market size presented here is an estimate of the dollars spent by the pharmaceutical industry on research and development in 2009. This is a thorny and complex subject—what costs are included in R&D and how do pharmaceutical companies decide what to spend on developing new drugs and to modify old ones. For anyone interested in the subject beyond this quick snapshot, we recommend a report titled “Research and Development in the Pharmaceutical Industry,” published in 2006 by the Congressional Budget Office, and available online here.

Geographic reference: World
Year: 2009
Market size: $45.8 billion
Source: “New Federal Research Center Will Help Develop Medicines,” The New York Times, January 23, 2011, page 1.
Original source: Industry estimate

Industrial Scrubbers

The sorts of scrubbers we’re looking at here are a diverse assortment of complex pollution control devices. They are used to control—reduce and capture— pollutants that are emitted during an industrial process. The market size presented here is based on an industry projection.

Geographic reference: World
Year: 2012
Market size: $6.5 billion
Source: Water World, October 2009
Original source: McIlvaine Company

Military Spending

Spending on the military varies greatly from country to country and in part, because of concerns about national security, acquiring information about just what is spent in each country is very difficult. The Stockholm International Peace Research Institute studies this topic and tracks it, publishing an international yearbook with statistics on the same. It has done this since 1969, making the 2010 edition of its yearbook the 41st edition.

The United States ranks at the top of the list of military spending by nation, as it has for decades. In 2009 the United States’ military spending represented 43% of world military spending. The United States’ share of world military spending has consistently been above 40% since the SIPRI Yearbook has been published.

Geographic reference: World
Year: 2009
Market size: $1.531 trillion
Source: “The Top 10 Military Spenders, 2009,” SIPRI Yearbook 2010, Armaments, Disarmament and International Security, page 11, available online here.
Original source: Stockholm International Peace Research Institute

Diagnostic Testing Laboratories

The market for all things medical appears to be on a steady rise in the United States and the services of diagnostic testing laboratories no exception. According to the source article, one of the hot trends in this industry is genetic-testing which is done by scanning the DNA of a “consumer” in order to check for any signs of irregularity that may be a pointer to potential and specific diseases or health conditions to which the consumer may be at higher risk than the general public. The government has begun to look at this industry more closely, as these tests can offer results that are contradictory or misleading.

Based on our earlier market size posts on the diagnostic laboratory industry, we assume that this market size includes both medical testing laboratories as well as diagnostic imaging services, which are listed in detail here.

Geographic reference: United States
Year: 2009
Market size: $60 billion
Source: Wall Street Journal, July 23, 2010, page B1.
Original source: Washington G-2 Reports

Dialysis Market

This market size represents the number of tax dollars spent to care for those on dialysis every year in the United States. In October 1972, Congress made revisions to the Social Security Act so that anyone diagnosed with kidney failure, regardless of age or income, would have comprehensive coverage under Medicare.

Initially, before guaranteed payments from Medicare, hospitals provided most of the care on a nonprofit basis, albeit on a limited basis. In 2010, 80 percent of the clinics offering dialysis were for-profit, with two-thirds of those operated by two chains: DaVita Incorporated (based in Colorado) and Fresenius Medical Care North America (a subsidiary of a German company that makes dialysis machines and supplies). Together these two companies make $2 billion in operating profits per year. More than 100,000 people start dialysis each year in the United States. In 2010, there were nearly 400,000 patients receiving dialysis.

Geographic reference: United States
Year: 2010
Market size: $20 billion
Source: Robin Fields, “God Help You. You’re On Dialysis,” The Atlantic, December 2010, pages 82-92.

Refrigerators in Homes

The market size referred to in this post is the number of refrigerators that were in place in residential housing units in the United States in 2009. While the source does not specify that this is the number of full sized and primary refrigerators per residence, it would seem that that must be the case, since we all know somebody with an old refrigerator (or two) in the basement…

Geographic reference: United States
Year: 2009
Market size: 126,534,000
Source: “Housing Units—Characteristics by Tenure and Region: 2009,”
Statistical Abstract of the United States: 2011, Table 983, U.S. Census Bureau, page 616, available online here.
Original source: U.S. Department of Commerce, Bureau of the Census.

Residential Smoke Detectors

The number of working smoke detectors in residential housing units in the United States is listed below. This figure translates into a single smoke detector in 87% of all residential housing units in the country, which is an encouraging number. However, a more promising figure would be well over 100% since that would mean that many homes made use of more than a single smoke detector, as is recommended by the U.S. Fire Administration, part of the Federal Emergency Management Agency, on its website here.

Geographic reference: United States
Year: 2009
Market size: 116,141,000 detectors
Source: “Housing Units—Characteristics by Tenure and Region: 2009,”
Statistical Abstract of the United States: 2011, Table 983, U.S. Census Bureau, page 616.
Original source: U.S. Department of Commerce, Bureau of the Census.

Mortgage Debt Nationally

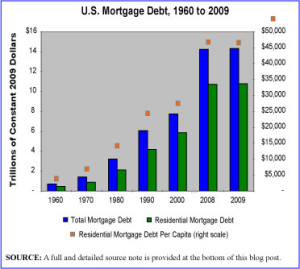
Mortgage Debt Nationally, 1960 to 2009

It should not come as a surprise to see that the U.S. has dramatically increased its national, total mortgage debt over the last few decades and in particular over the last decade. The graphic presented here shows the increase in national mortgage debt from 1960 to 2009. The most striking leaps in indebtedness are seen in the period since 2000. While not surprising since we all now understand that the last decade was indelibly marked by a housing bubble, it is sobering to see just how high that debt really is, well after the bubble has burst.

The graphic depicts inflation-adjusted dollars so what we see here is the increase in mortgage debt AFTER INFLATION. Just for fun, the graphic also shows—with an orange dot per year—residential mortgage debt on a per capita basis, using the right scale on the chart. We are certainly an indebted people.

Geographic reference: United States
Year: 2009
Market size: $14.3 trillion, of which $10.8 trillion is residential mortgage debt as opposed to commercial or agricultural mortgage debt.
Source: “Table 1191 — Mortgage Debt Outstanding by Type of Property Holder: 1952–2009,” Statistical Abstract of the United States: 2011, available online here.
Original source: Board of Governors of the Federal Reserve System, “Federal Reserve Statistical Release, Z.1, Flow of Funds Accounts of the United States,” March 2010, available online here.
Full source note for graphic: “Table 1191 — Mortgage Debt Outstanding by Type of Property Holder: 1952–2009,” Statistical Abstract of the United States: 2011; Population data 1960-1970: “No. HS-1. Population: 1900-2002,” available online here; Population data 1980-2009: “Table 7. Resident Population by Sex and Age: 1980 to 2009,” Statistical Abstract of the United States: 2011, page 11 available online here. The price deflator series used to convert current dollars to constant 2009 dollars came from two spreadsheets. For 1960: “Table 7.14. Chain-Type Quantity and Price Indexes for Gross Domestic Product by Sector,” Bureau of Economic Analysis, February 28, 2003 available online here; For 1970-2009: “Table B-6. —Chain-type quantity indexes for gross domestic product, 1962-2010,” Economic Report of the President: 2011 Spreadsheet Tables, U.S. Government Printing Office, available online here.

Number of Repossessed Homes

During the housing market crisis we have read many and often contradictory accounts of just how many homes are in foreclosure, or the number of homes being foreclosed upon, or the number of home mortgages in a delinquent state. The process of foreclosing on a delinquent mortgage is a lengthy one and the measures being spoken of in the media so often refer to measurements at different stages in this process. What we present here are the number of homes that were repossessed by the bank, the number of home foreclosures that reach the endgame in three different years.

Geographic reference: United States
Year: 2008, 2009 and 2010 (estimate)
Market size: 862,000, 918,000 and 980,000 housing units respectively
Source: “Record U.S. Foreclosures in 2009,” an article on the World Socialist Web Site, available online here. The 2010 figure was taken from “Number of Homes Taken by Lenders Tumbles,” SFGate.com a news site sponsored by Hearst Communications Inc. and available online here.
NOTE: A new RealtyTrac Press Release came out on January 13, 2011 and has been reported on by the AP here. The AP report states that over one million homes were repossessed in 2010. This heavily repeated figure is all over the news, blogospher, and Internet yet, oddly, we have been unable to obtain an actual figure of repossessed homes from a thorough search of the RealtyTrac web site. So, we shall leave our originally presented estimate as is.
Original source: RealtyTrac Inc.

Homes

After looking at the number of vacant homes in the United States, we turn to a measure of all houses in the country. The market size number presented below includes all single-family attached and detached units as well as apartments and condominiums, it is the total of all residential housing units.

This market size is broken out by type of housing unit in this way: Single family detached homes, 63.4%; single family attached (townhouses and the like), 5.5%; apartments and condominiums in 2 to 4 unit buildings, 7.8%; units in 5 to 9 unit buildings, 4.9%; units in buildings with 10 to 19 units, 7.4%; apartments and/or condominiums in buildings with 20 or more units, 7.4%, and manufactured/mobile homes, 6.8%.

Geographic reference: United States
Year: 2009
Market size: 130,112,000 housing units
Source: “Housing Units—Characteristics by Tenure and Region: 2009,”
Statistical Abstract of the United States: 2011, Table 983, U.S. Census Bureau, page 616.
Original source: U.S. Department of Commerce, Bureau of the Census.