Upon the news of the merger of American Airlines and U.S. Airways, creating in the process the largest passenger air carrier in the world, our attention is again drawn to the commercial airline industry. It has been a very rocky century so far for this industry.
In late 2011, the parent company of American Airlines, AMR, filed for bankruptcy protection, making American Airlines the last of the big six U.S. airlines to file for bankruptcy protection since the turn of the century (they are listed below). The use of commercial, passenger aircraft as missiles in the September 11, 2001 attacks in the United States can be seen as the first of many disruptions to the system, disruptions that included a worldwide financial crisis and a region-wide shutdown of air traffic due to the threat posed by volcanic ash. Underlying all of this has been the steady increase in the price of jet fuel which now makes up just over one-third of operating expenses for the industry as a whole.
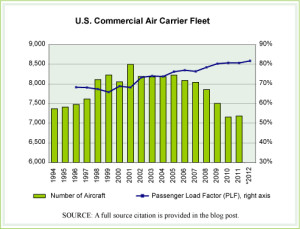
Today’s market size is the number of aircraft being operated by U.S. air carriers. This number does include aircraft used for freight (12.3%) but does not include private jets or the fleets operated by small companies offering nonscheduled, special order flights. The graph shows how the industry fleet size has changed over the past 17 years. A line is also provided on the graph that shows the average, industry-wide, passenger load factor each year (PLF). The PLF is a calculation of Revenue Passenger Miles (RPM) divided by Available Seat Miles (ASM).
Geographic reference: United States
Year: 2001 and 2011
Market size: 8,497 and 7,185 aircraft respectively
Source: “TABLE 2-6. Number of U.S. Aircraft, Vehicles, and Other Conveyances: 2004-2009,” Transportation Statistics Annual Report-2010, Research and Innovative Technology Administration (RITA) – U.S. Department of Transportation (US DOT), available online here. Data for 2010 and 2011 are from an article by Aaron Karp, “FAA: US Commercial Aircraft Fleet Shrank in 2011,” March 13, 2012, Airports Today, available online here. The data on passenger load factors in the graph are from another report by the Bureau of Transportation Statistics, available online here.
Original source: U.S. Bureau of Transportation Statistics, Federal Aviation Agency
Largest Bankruptcy Filings in the U.S. Airline Industry since 2000
TWA (2001)
U.S. Airways (2002)
United Airlines (2002)
Delta Air Lines (2006)
Northwest Airlines (2006)
AMR (American Airlines) (2011)
Posted on February 14, 2013

