 From a four-volume work titled
Social Trends & Indicators USA
that we made for publication by Thomson Gale
Volume 1, page 155
This reference work presents short essays, each preceded by a graphic highlighting the trends seen in statistical data on the topic to be discussed. The four volumes are subtitled as follows: Volume 1: Work & Leisure; Volume 2: Community & Education; Volume 3: Health & Sickness, and Volume 4: Crime & Justice.
Ouch! — The Injuries We Get At Work

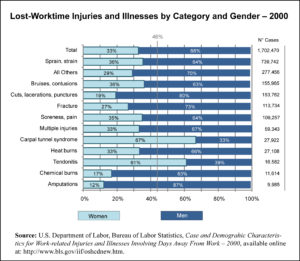
This chart provides data on the number of non-fatal injuries and illnesses that were reported in the United States in 2000 and resulted in lost work time. The injuries are categorized by type, in descending order, and by gender of the injured party.
A line has been placed at the 46% mark because this is the percentage of the workforce that was, in 2000, made up of women. Although men make up 54% of the workforce, they suffer 67% of all non-fatal occupational injuries and represent more than 54% of injuries suffered in all but two categories. Those categories are Carpal Tunnel Syndrome and Tendinitis, which together represented only 2.6% of occupational injuries in 2000.
Carpal Tunnel Syndrome and Tendinitis are suffered disproportionately by women. They are caused by tasks that require repetitive motions — typing, keying, fitting parts, gripping and twisting actions, etc… As the use of PCs expanded in the 1980s and 90s, so too did cases of Carpal Tunnel Syndrome and Tendinitis. Nonetheless, these types of injuries have declined in the late 1990s, as has the incidence of injuries in all categories.
It appears that the workplace is becoming a safer and safer place to be, at least when it comes to physical wellbeing. We will look more closely at the gender difference in those suffering injuries at work in the next panel.
