
 Today’s market size is the size of the wholesale trade industry in the United States. This industry breaks down into those who work with durable goods—furniture, cars, trucks, construction materials, electronics, appliances and the like—and those who deal in nondurables—food, clothes, paper products, drugs, gas, and other such.
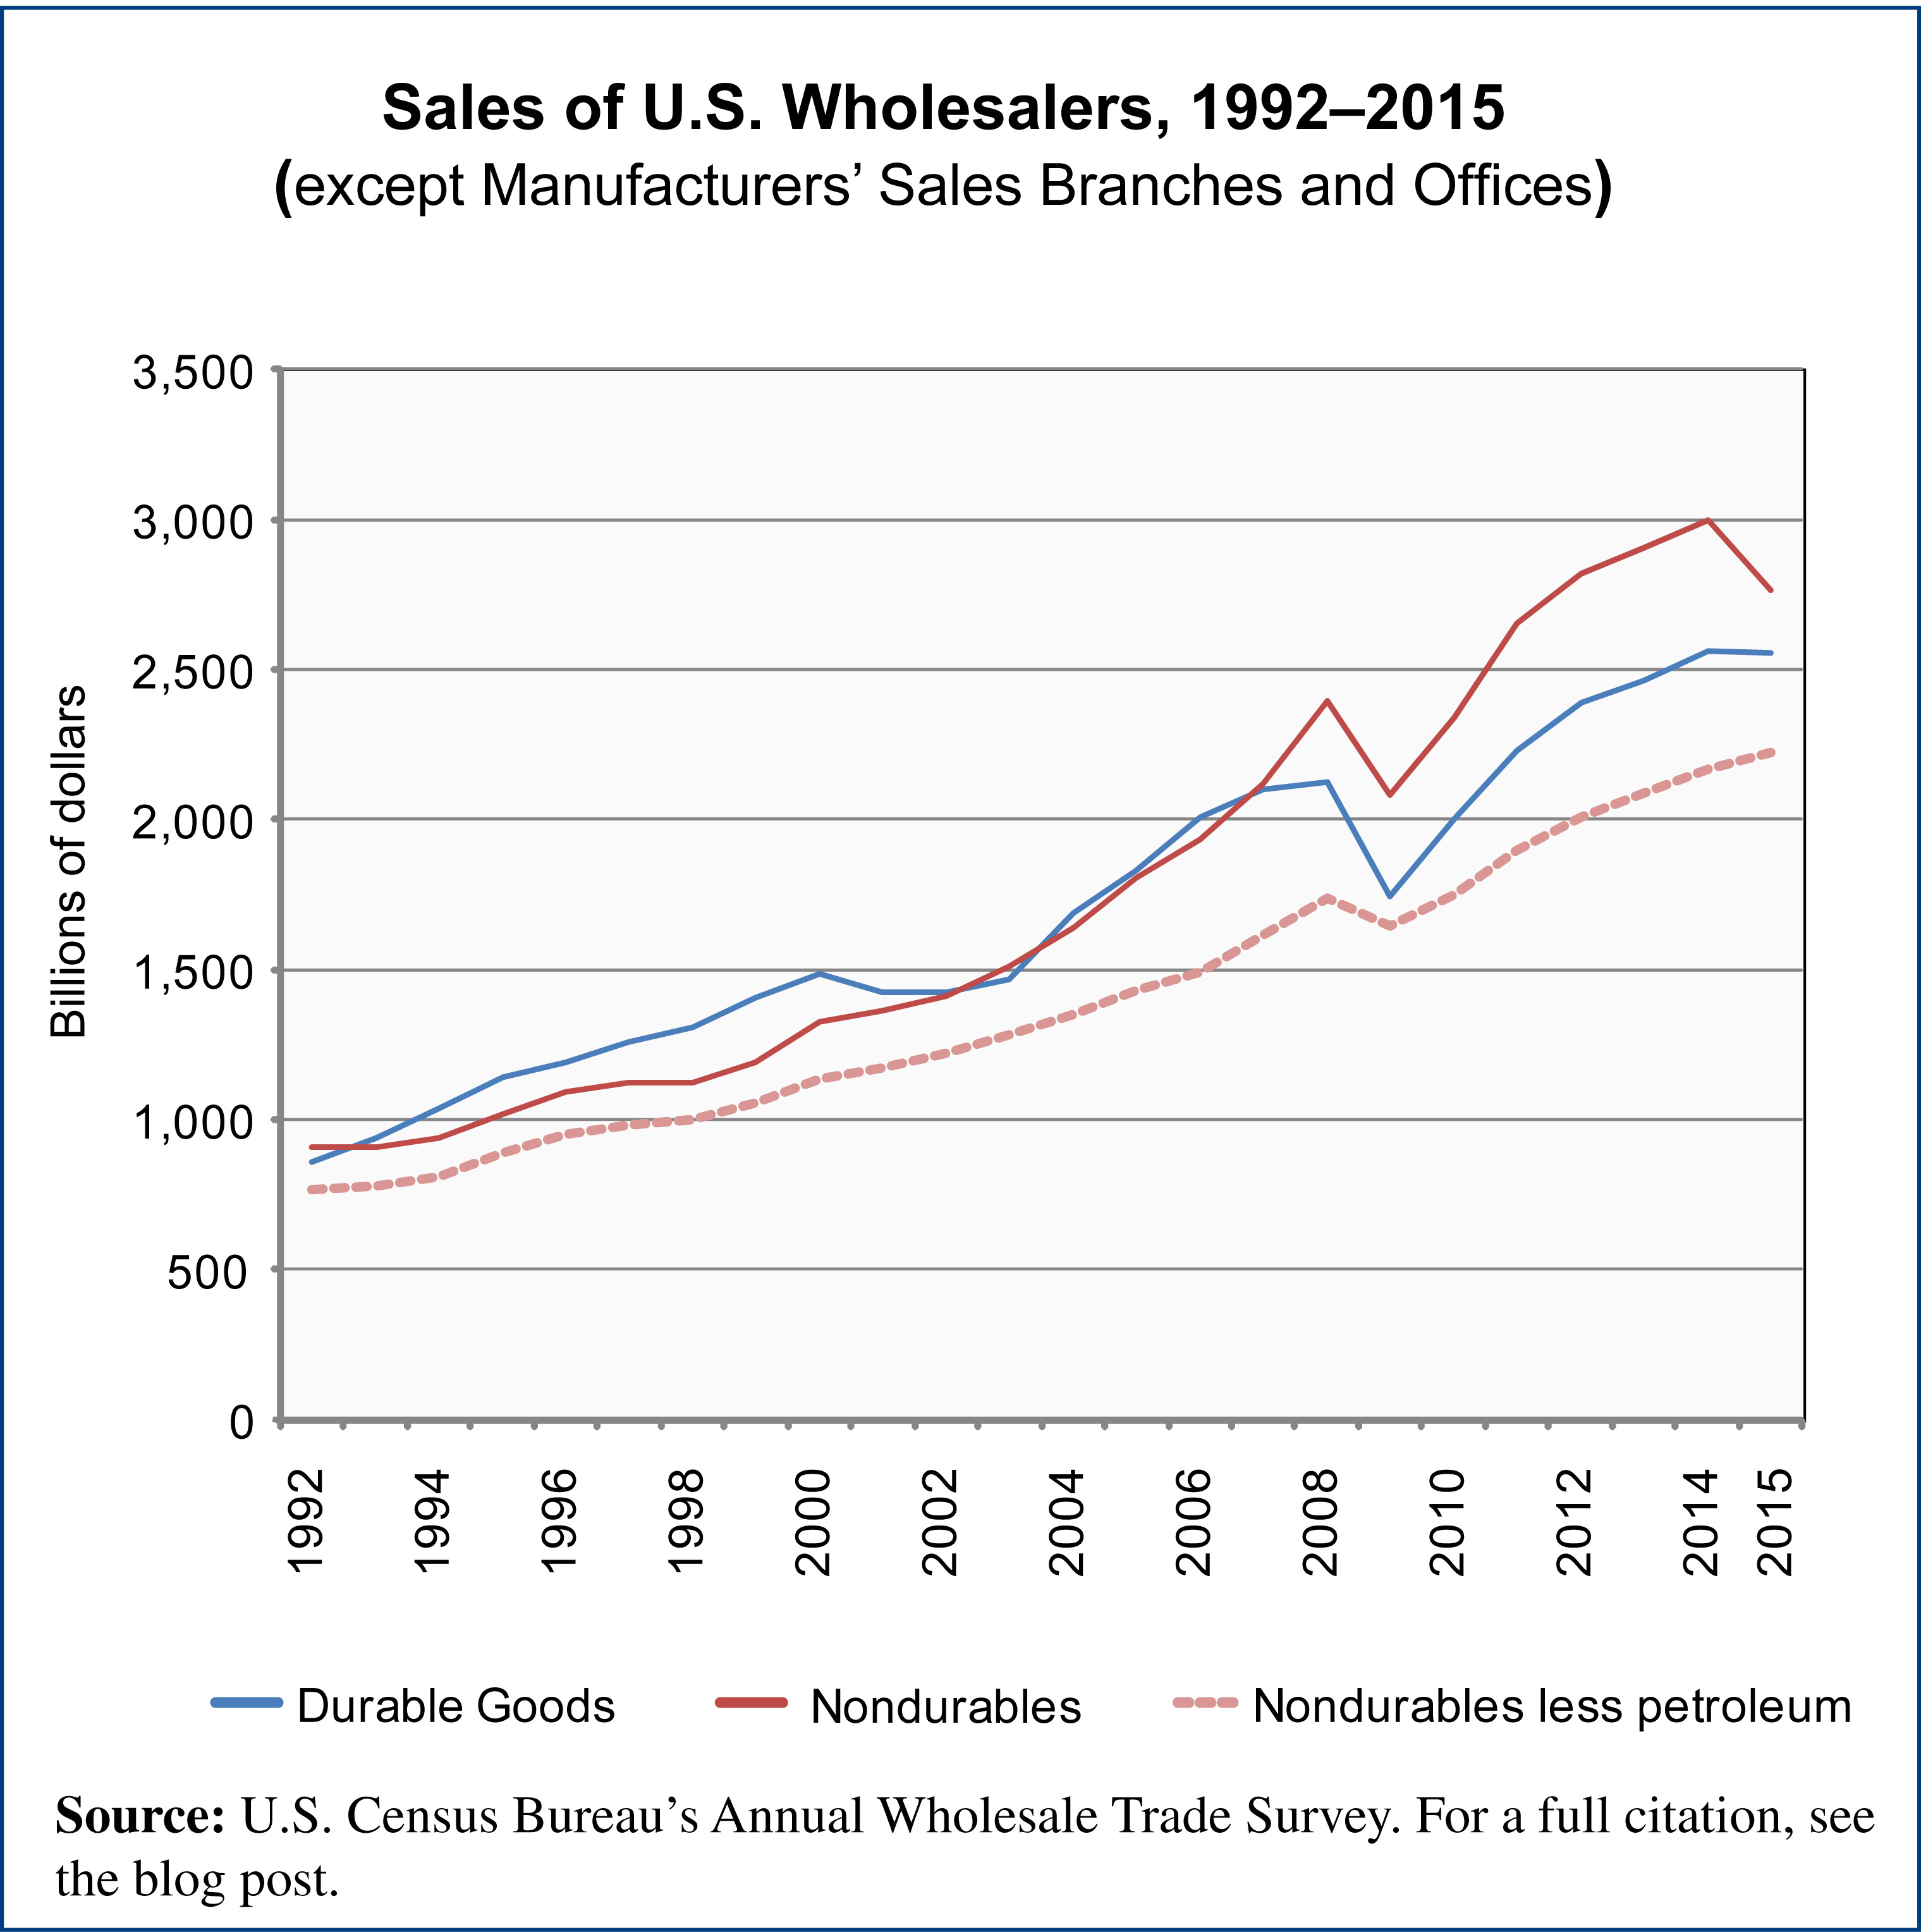
The graph shows total annual sales made by wholesale firms that are not also manufacturers over the period 1992-2015. The sales are broken out by the two major categories discussed, durable goods and nondurable goods. There is also one further line presented, one showing sales of all nondurable goods wholesalers other than those selling petroleum and petroleum products. We have added this line by way of showing how much less volatility there is in annual sales volumes when the petroleum sector is removed from the nondurables category.
Geographic reference: United States
Year: 2000, 2009 and 2015
Market size: $2.81, $3.83 and $5.32 billion respectively
Source: “Table 2. Revised (Not Adjusted) Estimates of Monthly Sales, Inventories, and Inventories/Sales Ratios of Merchant Wholesalers, Except Manufacturers’ Sales Branches and Offices: January 1992 Through July 2016, Monthly & Annual Wholesale Trade reports, U.S. Census Bureau, available online here
Original source: U.S. Department of Commerce