
One of the basic infrastructural needs of any modern society, particularly one in which the density of population is great, such as in urban areas, is that which supplies clean water and carries waste away. It is one of those things that in modern industrial society we take very much for granted and almost don’t notice it, until something isn’t working.
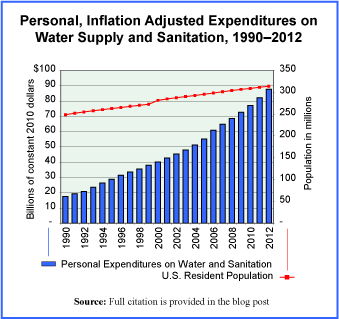
Today’s market size is the amount spent by residents, in the United States, for water supply and sanitation in 1990 and again in 2012. This does not include the expenditures of companies or other entities for water and sewer services but is, rather, the total spent by individuals for personal use. The graph provides a year-by-year picture of these expenditures in constant 2010 dollars, in other words, in inflation-adjusted terms. A red line on the graph is there to show how the population has risen over this period and it is clearly at a rate much slower than the rate of growth in expenditures on water.
Geographic reference: United States
Year: 1990 and 2012
Market size: $27.1 and $85.9 billion respectively (in current dollars)
Source: “Table 2.5.5 Personal Consumption Expenditures by Function (A),” National Income and Product Accounts Tables, (NIPA), Bureau of Economic Analysis, August 7, 2013, available from the BEA web site here.
Original source: U.S. Department of Commerce, Bureau of Economic Analysis
Posted on January 20, 2014