
We hear a lot today about e-commerce, which may be defined in many ways and has been around for longer than most people think if we include exchanges made at the wholesale trade level as a part of e-commerce. Wholesalers have been using electronic sales for a long time now. But e-commerce is not actually synonymous with nonstore retail. While electronic shopping accounts for a great deal of the total nonstore retail business, nearly 80% in 2013 when combined with mail-order house sales, there are others in this nonstore sector.
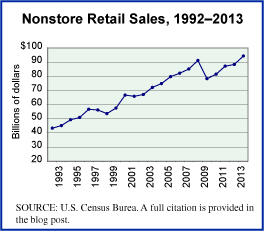
The total nonstore retail sector includes, as we’ve seen, electronic shopping and auction websites and mail-order houses. It also includes businesses that do their selling with infomercials on TV, by going door-to-door, through the use of in-home demonstrations, those that sell from portable stalls or food trucks, and those operating vending machines. The graph we present shows annual sales by nonstore retailers other than electronic shopping, auctions, and mail-order houses.
Today’s market size is the total value of sales made in the United States through nonstore retailers in 2000 and in 2013.
Geographic reference: United States
Year: 2000 and 2013
Market size: $180.5 billion and $450.2 billion
Source: “Time Series / Trend Charts,” a new interactive resource made available by the U.S. Census Bureau using its wealth of data collected in a monthly survey series it does of the retail trade sector. The main website for the “Monthly and Annual Retail Trade” data is here and the new Time Series / Trend Chart offering is available online here.
Original source: U.S. Census Bureau
Posted on March 13, 2014