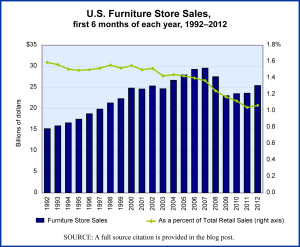
The sale of furniture—through furniture stores—in the United States has begun to recover from the significant hit it took as a result of the housing bubble collapse and the recession of 2007–2009. The graph we present here shows sales receipts for all furniture stores in the United States during the first six months of each year from 1992 through this year. The NAICS code (North American Industrial Classification System code) for furniture stores as measured here is 4421.
Geographic reference: United States
Year: 2007 and 2012 (first 6 months)
Market size: $29.6 billion and $25.4 billion respectively
Source: Annual Retail Trade Survey 2010, and updates from the Monthly Retail Trade Reports from the same reporting series, U.S. Census Bureau, available online here.
Original source: U.S. Department of Commerce, Bureau of the Census
Posted on August 17, 2012


Rather an interesting way of charting retail sales. Suggests to me that new household formations — or moving to a new house — are the occasions when serious furniture purchases take place….
Good record.
In 2012 market was really not much good but in 2013 hope so its will be good.
Furniture market have a good place and good shape in US market.