In the United States, people pay less for food than anywhere else in the world, as a percentage of their total expenditures. Here is a link to a site with a very interesting world map showing U.S. Department of Agriculture and Euromonitor data on how much of our total expenditures we spend on food worldwide, nation by nation. As many people worry about the cost of food rising it is worth noting, at the most basic level, just how inexpensively we’re able to feed ourselves in the United States.
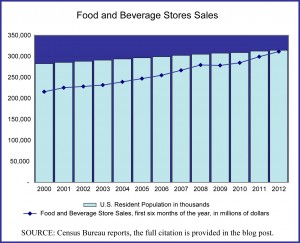
Today’s market size is the value of food and beverage store sales in the United States for the first six months of 2000 and 2012. The graph shows the first six months of each year’s food and beverage store sales for the entire period.
Geographic reference: United States
Year: 2000 and 2012 (January – June)
Market size: $215.6 and $311.2 billion respectively
Source: Monthly Retail Trade Report, August 14, 2012, part of a series of reports by the U.S. Census Bureau, available online here.
Original source: U.S. Department of Commerce
Posted on September 13, 2012

