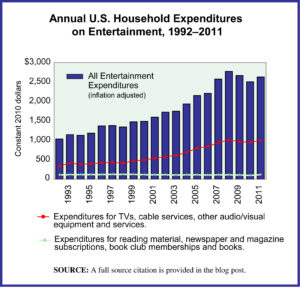
The U.S. Bureau of Labor Statistics (BLS) carries out an annual survey of millions of households to track what they spend money on, by category. The resulting data has been collected over decades and seeing the trends that these data expose over time is very interesting.
The graph presented here is made with BLS data from this survey series. It shows inflation-adjusted household expenditures on all categories of entertainment, as well as two subsets of expenditures, (1) those for TVs, audio/video equipment and services, such as cable subscriptions and (2) expenditures for reading material. The full category of entertainment expenditures is broad and includes things such as:
—Fees to attend concerts, sporting events, movies, and sporting clubs/fraternal organizations.
—TVs, radios and other audio/video equipment as well as subscriptions for cable, premium TV and the like.
—Pets, toys and hobbies, as well as all the services and equipment related to those.
—Bikes, athletic shoes, and equipment for camping, exercising, fishing, and all sports, as well as boats and docking fees, fireworks, pinball machines and video consoles.
Today’s market size is the average spent by U.S. households on reading material in 1994 and in 2011. The figures do not include expenditures for any textbooks or reading material purchased as part of a formal educational program. The transition to digital which is taking place in most areas of publishing is not well tracked by this BLS survey series. It is unclear from studying the survey results, for example, whether or not all online subscriptions to newspapers and magazines are consistently captured in the expenditure category “Reading.” Over time this will change as time allows data collection organizations, like the BLS, to adjust to the digital transition. Data collection organizations can only adjust as quickly as the industries they cover—in this case, the publishing industry—adjust to such dramatic changes.
Geographic reference: United States
Year: 1994 and 2011
Market size: $165 and $115 respectively. These figures translate to a national gross household spending on reading materials for each of those years of $16.86 billion and $14.06 billion respectively
Source: “Consumer Expenditure Survey,” Multiyear Tables: 1992-99 Multiyear Table, 2000-05 Multiyear Table, and 2006-11 Multiyear Table, all available on the Bureau of Labor Statistics website here.
Original source: U.S. Department of Labor, Bureau of Labor Statistics, Consumer Expenditure Surveys
Posted on May 9, 2013

