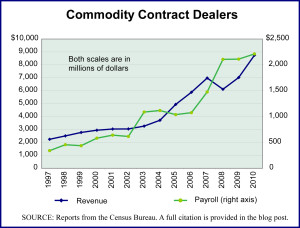
With the growth of globalization and the rise in consumption levels in many parts of the world, the cost of basic commodities has been on a strongly upward trajectory but one with great fluctuations. Such fluctuations in commodity prices tend to favor attempts to trade in futures by way of limiting the uncertainty of volatile prices. The services of commodity contract dealers have been in high demand and they have done quite well. The growth in both revenue and employment in the commodity contracts business shows how it has survived the recession and financial crisis of 2007–2009 far better than most industries.
The graphic presents annual revenue and payroll for Commodity Contract Dealers [NAICS 523130] in the United States from 1997 through 2010. Over this period, industry revenues grew by a very healthy 290% and payroll grew by an even more impressive 549%. In 1997, payroll accounted for 15% of revenue for this industry. In 2010 payroll accounted for 25% of revenue, off from a high of 34.5% of revenue reached in 2008. The total number employed by this industry also grew over the period 1997–2010, by 152%, from 4,519 to 11,400.
Today’s market size is the total industry revenue generated by commodity contract dealers in the United States in 2010.
Geographic reference: United States
Year: 2010
Market size: $8.75 billion
Source: Economic Census reports on the NAICS industry 523130 from the 1997, 2002, and 2007 Economic Censuses. The 2003 and 2010 editions of the Service Annual Survey, “Table 4.1. Finance and Insurance (NAICS 52) — Estimated Revenue fro Employer Firms.” All of these reports are available online from the Census Bureau’s website here.
Original source: U.S. Department of Commerce, Bureau of the Census
Posted on November 1, 2012

