Ride-Hailing Services in Southeast Asia

Ride-hailing services are on-demand transportation services that do not include other on-demand services such as food delivery or package delivery. Ride-hailing vehicles can be any type of motor vehicle: private car, motorcycle, auto rickshaw or private taxi, for example. Customers use smartphone apps to book and pay for rides.

Of the 16 billion trips completed by ride-hailing services worldwide in 2017, more than 70% were in Asia. Didi Chuxing, which claimed 90% of the Chinese ride-hailing market, provided the most rides, 7 billion. Grab and Go-Jek, the largest ride-hailing companies in Southeast Asia provided 1 billion and 900,000 rides, respectively. Globally, these two companies ranked 4th and 5th for the number of rides provided.

This week’s market size post shows the total revenues for ride-hailing services in Southeast Asia for 2015, 2017, 2018 and 2025.1 The figure for 2025 is projected. Grab has a presence in 8 countries: Malaysia, Thailand, Singapore, Philippines, Indonesia, Vietnam, Myanmar, and Cambodia. After Grab acquired Uber’s Southeast Asia division in March 2018, Grab claimed 90% of the Southeast Asian ride-hailing market. Go-Jek has had a presence in Indonesia since 2011 and expanded into Thailand, Singapore, and Vietnam in 2018. Its attempts to expand into the Philippines were unsuccessful due to government regulatory requirements. Grab and Go-Jek have been competitors in Indonesia since 2015 when they both launched motorcycle-taxi hailing apps. By 2018, Go-Jek claimed 79.2% of the ride-hailing market; Grab, 20.8%, according to the Business Competition Supervisory Commission.

Throughout Southeast Asia, 35 million people use ride-hailing services, booking an average of 8 million rides per day. But there is an opportunity for growth. While 90% of the more than 350 million internet users in Southeast Asia2 have smartphones, 80% do not use ride-hailing services. However, rather than focusing their attention on expanding their ride-hailing business, Grab and Go-Jek are using the familiarity and trust built from their ride-hailing services to expand into banking, e-commerce, e-wallet, food delivery, and other services. All of these services will be accessible through their smartphone super-apps. As of January 2019, Grab had 125 million downloads; Go-Jek, 108 million.

1 Source for 2015 and 2017: Nicholas Shields, “Grab Could Lock Down Another $1 Billion in Funding,” Business Insider Intelligence, October 8, 2018 available online here; Source for 2018 and 2025: Resty Woro Yuniar, “Can Indonesia’s Go-Jek Loosen Grab’s Grip on Southeast Asia?” South China Morning Post, February 11, 2019 available online here.
2 Internet user numbers are for the 6 biggest economies in Southeast Asia: Indonesia, Philippines, Vietnam, Thailand, Malaysia, and Singapore.

Geographic reference: Southeast Asia
Year: 2015, 2017, 2018 and 2025
Market size: $2.5 billion, $5.1 billion, $8 billion, and $31 billion, respectively
Sources: Nicholas Shields, “Grab Could Lock Down Another $1 billion in Funding,” Business Insider Intelligence, October 8, 2018 available online here; Resty Woro Yuniar, “Can Indonesia’s Go-Jek Loosen Grab’s Grip on Southeast Asia?” South China Morning Post, February 11, 2019 available online here; Elaine Huang, “Asia is the World’s Largest Ride-Hailing Market With Over 70% Share – Grab Dominates SEA,” Vulcan Post, September 7, 2018 available online here; Mars Woo, “Grab and Go-Jek’s Dominance is Not Deterring Upstarts, These are Their Ride-Hailing Competitors in Southeast Asia,” KrAsia, January 9, 2019 available online here; Kentaro Iwamoto and Shotaro Tani, “Ride-Hailers Grab and Go-Jek Wage First Full-On War in 2019,” Nikkei Asian Review, January 17, 2019 available online here; “Southeast Asia Mobile Internet Usage Increasing Dramatically,” FinanceX on Medium, December 5, 2018 available online here; Erkka Niemi, “The Most Interesting Players in the Ride-Hailing Market,” Medium, November 13, 2018 available online here; Herry Barus and Aldo Bella Putra, “The Market Share of Gojek is Almost 80 Percent,” 2nd Industry.co.id, September 6, 2018 available online here; Cindy Silviana and Fanny Potkin, “Grab, Go-Jek Wage Street Fight for SE Asia ‘Super-App’ Supremacy,” Reuters, November 29, 2018 available online here.
Original sources: Google and Temasek
Image source: Free-Photos, “car-traffic-man-hurry-1149997,” Pixabay, February 14, 2016 available online here.

Airbnb Market in the Finger Lakes Wine Region of New York

Finger Lakes Wine RegionFrom the mid-1980s to the early 1990s, consumption of wine in the United States trended downward, however, since 1994 wine consumption has been trending upward. That year about 400 million gallons of wine were consumed. In 2016, 790 million gallons were. In the early 2000s, wholesalers began moving away from selling wine from small producers because demand for wine could be met by larger producers. As a result, owners of small vineyards began focusing their marketing efforts on tasting room experiences and direct-to-consumer sales to promote their products. In 2017, 60% of winery sales on average came from direct-to-consumer sources, more so the smaller the winery. For the largest wineries, less than 10% of sales were direct-to-consumer.

Agritourism, defined as “a commercial enterprise at a working farm, ranch, or agricultural plant conducted for the enjoyment of visitors that generates supplemental income for the owner,”1 of which winery tours are a part, grew in popularity around this time as more people became interested in experiential travel, healthy eating, learning about the food that they consume, and learning about rural, agricultural life. State and local tourism agencies began promoting wine trails, groups of wineries in close proximity that a tourist can visit in a day, as vacation destinations. These trails also offer themed events throughout the year in some cases pairing wine with food and art to appeal to a variety of visitors to the region. Restaurants, hotels, motels and other lodging options such as those offered on Airbnb2 also are benefitting from wine tourism. Today’s market size shows the amount Airbnb hosts in the Finger Lakes Wine Region of New York earned in 2017. Most of the 26,600 tourists who booked Airbnb lodging in this region came from nearby cities such as New York City, Rochester, and Buffalo. The Finger Lakes Wine Region is centered around Keuka, Seneca and Cayuga Lakes and includes more than 100 wineries, distilleries, and breweries. For comparison, Airbnb hosts in the Niagara Wine Region of Canada earned $12.9 million and welcomed more than 163,000 guests.

1“What is Agritourism?” University of California Small Farm Program, June 1, 2012 available online here
2Mention of the company and its market size does not constitute an endorsement.

Geographic reference: Finger Lakes Wine Region, New York
Year: 2017
Market size: $3.8 million
Sources: The Citizen Staff, “Airbnb: Finger Lakes Wines a Draw,” The Citizen, June 3, 2018; Rob McMilan, State of the Wine Industry 2018, Silicon Valley Bank, 2018 available online here; “What is Agritourism?” University of California Small Farm Program, June 1, 2012 available online here; “Leelanau Peninsula Wine Trail,” America’s Wine Trails, LLC available online here; “Taste,” Finger Lakes Wine Country Tourism and Marketing Association, 2018 available online here.
Image source: By Flickr user: Valerie Knoblauch Canandaigua, New York https://www.flickr.com/people/visitfingerlakes/ [CC BY 2.0 (https://creativecommons.org/licenses/by/2.0)], via Wikimedia Commons

Iran’s Tourism Industry

Jameh Mosque of Isfahan, Iran
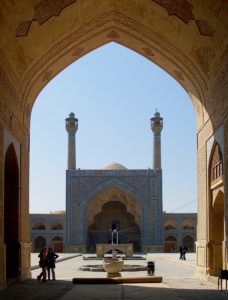
After the Iran Nuclear Deal took effect and some sanctions were lifted, Iran saw a surge in tourism, up three-fold since 2009. In the year ending March 2017, more than 6 million tourists visited the country. Many of the tourists were young, individual travelers from Europe and Asia who were interested in Iran’s history and culture. As a result of this influx of tourists, hotel firms from France, Spain, the United Kingdom, and the United Arab Emirates have opened or plan to open hotels there within the next few years.

Today’s market size shows the total amount tourists spent in Iran in 2016, in U.S. dollars.

Geographic reference: Iran
Year: 2016
Market size: $8 billion
Source: Alkhalisi, Zahraa, “Iran’s Tourism Industry is Booming,” CNN Money, September 5, 2017 available online here.
Image source: By seier+seier+seier (friday mosque, isfahan, iran) [CC BY 2.0], via Wikimedia Commons

Recreational Vehicles

Low gas prices, favorable interest rates, and a renewed interest in the outdoors are fueling record sales of recreational vehicles (RVs). In addition, more people in their 20s and 30s are interested in buying RVs. Trailers, which make up 87% of the RVs sold, appeal more to Millenials who prefer something less expensive for weekend trips. Baby Boomers, in contrast, prefer buying motorhomes in order to spend most of their retirement years traveling. In 2016, a record number of RVs were shipped, more than 430,000. Manufacturers expect a 3.6% increase in shipments in 2017.

Today’s market size is the estimated total retail value of all RVs that will be sold in the United States in 2017.

Geographic reference: United States
Year: 2017
Market size: $18.5 billion (estimated)
Source: Diana Kruzman, “Millennials Fuel Growth in RV Sales,” USA Today for the Lansing State Journal, May 26, 2017, page B4.
Original source: Recreational Vehicle Industry Association

Public Transportation in the Lansing, Michigan Area

The Capital Area Transit Authority (CATA) is the largest public transit provider in the tri-county area around Lansing, Michigan. The tri-county area consists of Ingham, Clinton, and Eaton counties. CATA has been operating public transportation in the mid-Michigan area since 1972 and has been twice named the best transit system of its size in North America by the American Public Transportation Association.

Ridership grew steadily during the 1970s, before leveling off during the 1980s and most of the 1990s. During the 1980s and 1990s, the number of rides fluctuated around 3-4 million annually. In 1999, CATA took over the Michigan State University bus service. Since then ridership has increased nearly 3-fold. In contrast, the population of the tri-county area grew by 22.6% from 1970 to 2010.

In 2013, CATA set a fourth consecutive yearly record for number of rides. By 2014, however, ridership was down overall despite seeing increased ridership on its Michigan State University routes and increased requests for its paratransit services. In the fourth quarter of 2014, gasoline prices fell which could account for the decreased ridership. Gasoline prices remained low in 2015. Nationally, according to the American Public Transportation Association, total passenger trips declined by 3.5 percent from October 2015 to December 2015. CATA reported a 1 percent decline in ridership in 2015 relative to the close of 2014.

Today’s market size represents the number of rides annually on CATA vehicles in 1972 and 2015.

Geographic reference: Lansing, Michigan area
Year: 1972 and 2015
Market size: Less than 1 million rides and 11.43 million rides respectively
Sources: “National Trend Leaves Its Mark on Ridership,” CATA 2016 Community Report, June 2016, page 3; “Ridership Trends Vary by Service Type”, CATA 2015 Community Report: Where Public Transportation Goes Community Grows, June 2015, page 3; “Passenger Trips Reflect Stable Demand”, CATA 2014 Community Report: Moving You Forward With Pride, June 2014, page 3; “Growth in Ridership Remains Strong”, CATA 2013 Community Report: Moving You Toward Your Dreams, June 2013, page 4; “Riding High with Record Ridership,” CATA 2012 Community Report 40th Anniversary Edition: Greater Lansing on the Move, August 2012; “CATA Demand Grows with Community Need,” CATA 2011 Community Report: Greater Lansing on the Move, August 2011; Tri-County Regional Planning Commission, “Tri-County Regional Growth: Choices for Our Future,” Draft Report, August 2002 available online here; “Ingham County, Michigan” available online here; “Clinton County, Michigan” available online here; and “Eaton County, Michigan” available online here.

Youth Sports Tourism

An estimated 35 million children in the United States between the ages of 5 and 18 play organized sports every year. Of those, 21 million play non-school youth sports, which include baseball, soccer, lacrosse, rowing, hockey, volleyball, and gymnastics. These non-school groups are organized through local programs, such as Little League, or through sports clubs.

Unlike school-sponsored sports, in which teams usually travel by bus from one local school to another for games and tournaments, non-school sports games and tournaments may be held either across town or across the country. Parents are expected to spend the time and money to take their children to these events. Because of the money families spend while at these far away locations, more cities are planning to build sports complexes to attract youth sports tournaments.

Today’s market size is an estimate of the total spent in 2013 by families in the United States on travel for youth sports, including hotels, restaurants, and shopping. This category of tourism—Youth Sports Tourism—didn’t even exist a few years ago but is now one that is keenly tracked by industry observers and chambers of commerce.

Geographic reference: United States
Year: 2013
Market size: $7 billion
Source: Mark Koba, “Spending Big on Kids’ Sports? You’re Not Alone,” CNBC.com, January 13, 2014, available online here.
Original source: Minnesota Amateur Sports Commission
Posted on January 16, 2014

Map Apps

According to IHS Automotive, one in four U.S. cars now comes with a navigation system. Globally, installations of dashboard navigation systems are estimated to reach 13.8 million by the end of 2013. Typically, automakers charge between $500 to more than $2,000 for these systems. Even standalone GPS systems tend to cost hundreds of dollars. In addition to high cost, these systems come preloaded with maps and are not connected to the internet, thereby making them more difficult to update. In some cases, a trip to the dealership is necessary.

In contrast, smartphone and tablet map apps are internet-connected, easy to update, often give real-time traffic information and in some cases can be downloaded for free. In 2012, 47% of car owners said that they used a smartphone map app while driving, up from 37% in 2011. Makers of dashboard navigation systems have taken notice. General Motors’ OnStar, Garmin, and TomTom all have created map apps of their own, ranging in price from $36 to $150. In some cases, these apps run both on mobile devices and on a car’s dashboard.

Today’s market size is the number of map app downloads in the U.S. in May 2013, an 11% increase from the total downloaded in May 2012.

Geographic reference: United States
Year: May 2013
Market size: 79.1 million
Source: Keith Naughton, “OnStar, Garmin Try to Keep Pace with Waze, Other Free Navigation Apps,” Bloomberg Businessweek, July 25, 2013, available online here.
Original source: ComScore
Posted on August 13, 2013

Marathon Races

By way of tipping our hat to one of our own who ran a half marathon over the weekend past, today’s market size report is all about marathon races run in the United States. While still an elite group, marathon running has been gaining in popularity over the last two decades and the number of races has been growing steadily.

Congratulations, Bob!

Geographic reference: United States
Year: 2000 and 2011
Market size: Marathon races, 300 and 720 respectively
Market size: Number of runners who finished a marathon: 353,000 and 518,000 respectively
Source: Running USA’s Annual Marathon Report, February 26, 2012, available online here.
Original source: Running USA
Now, how shall we categorize this entry… hmm…?
Posted on June 4, 2012

The Business of Weddings

Today’s market size is an estimate of the size of the entire wedding industry in the United States—we take some license in using the word “industry” here. The things included in measuring the size of the wedding industry are many, from planning, apparel and jewelry through the ceremony, flowers, food, reception and honeymoon.

Geographic reference: United States
Year: 2010
Market size: $47.2 billion
Source: Toon Van Beeck and George Van Horn, “Wedding Bells are Ringing,” The RMA Journal, December 2010-January 2011, page 22-27, available online here.
Original source: IBISWorld
Posted on October 5, 2011

U.S. Airlines

miles and operating revenue

The graphic to the right presents both passenger miles of travel provided by U.S. airlines between 1990 and 2008 and operating revenues in those years. The picture this graph presents is a pleasant one with both measures rising pretty steadily over the period shown, with the notable exception of 2001 and 2002, the years for which the terrorist attacks of 2001 had the greatest impact on air travel. However, the airline business is a complicated business. As it turns out, over this same 19 year period, the industry as a whole suffered cumulative losses of $45.3 billion.

Today’s market size is the operating revenue earned by Airlines in 2008, a year in which the industry had losses of $23 billion. Running an airline is a complicated business to be sure.

Geographic reference: United States
Year: 2008
Market size: $186.12 billion
Source: “Table 1073. U.S. Scheduled Ariline Industry — Summary: 1995 to 2009,” Statistical Abstract of the United States 2012, page 677 and earlier editions. A PDF of page 677 of the work is available here. “Table 1-37: U.S. Passenger-Miles (Millions),” from the national transportation statistics available here.
Original source: U.S. Department of Transportation and U.S. Census Bureau
Posted on September 30, 2011

Air Travel Globally

Despite the dramatic declines in air travel for several years following the terrorist attacks in 2001, over the last decade, humans have been flying more and more. Worldwide, approximately 513 million passengers traveled by air in 1991 and by 2007 that figure had quadrupled, reaching 2,076 million.

Today’s market size is the value of the global airline business in 2007 and a forecast of the value in the year 2012. What is not evident from these revenue based figures is the fact that airlines, despite their growth, have not added up to a profitable business sector. In fact, since deregulation in the United States in 1978, airlines as a whole have lost money.

Geographic reference: World
Year: Forecast for 2007 and forecast for 2012
Market size: $430 billion and $711 billion respectively
Source: “The Global Airline Industry Will Reach a Value of $711 Billion in 2012, Forecasts New Report,” a press release dated March 14, 2009, announcing the publication of a market report being offered through a web service called “Report Buyer.” The press release is available here. The original report is titled Airlines: Global Industry Guide.
Original source: Datamonitor
Posted on September 16, 2011

Visitors to Midtown Detroit

In recent years, Midtown Detroit has seen an economic revival. The area is a major destination for visitors to Detroit. The number one destination is the main branch of the Detroit Public Library, followed by The Detroit Institute of Arts across the street. Data show the annual number of visitors.

Geographic reference: Midtown Detroit, Michigan
Year: 2010
Market size: Nearly 1.9 million people
Source: Doug McInnis, “Talk of the Town: Midtown Detroit Undergoes an Economic Revival,” Wayne State, July 2011, pages 10-19
Original source: University Cultural Center Association.

“Green” Commuting

Ways to commute to work

Whenever we hear about the rising price of oil, most of us immediately worry about the increased cost for the gasoline we put in our vehicles to get us to and from work each day. But for some of us, this is not a worry. Although still a small percentage of the working population as a whole, increasing numbers of workers are choosing to bicycle or walk to work. And, some of us who are able are choosing to work from home, thereby not commuting at all. The data show the number of workers 16 years old and over who bicycle or walk to work and those that work from home. Numbers in parentheses represent the percentage of the working population as a whole.

Geographic reference: United States
Year: 2000 and 2009
Market size: Bicycle to work — 566,384 (0.4%) and 831,551 (0.6%) respectively
Market size: Walk to work — 3,417,080 (2.7%) and 4,019,162 (2.9%) respectively
Market size: Work from home — 4,009,006 (3.2%) and 5,959,448 (4.3%) respectively
Source: American Community Survey, various dates, available online here.
Original source: U.S. Census Bureau

Airline Industry Worldwide

At the Show in 2009

Today’s market size is the estimated net profits of the worldwide airline industry. The Paris Air Show is being celebrated this week and the press coverage of this important aerospace industry show is providing many interesting glimpses of the industry. The most recent recession combined with high energy costs hit the airline industry hard, causing two years of losses. Financial returns in 2010 represent a return to profitability for the industry as a whole. The mood is good at this year’s Paris Air Show as aircraft manufacturers are hopeful that orders will be healthy this year.

Geographic reference: World
Year: 2010
Market size: $18 billion (Global airline industry net profits)
Source: Nicole Clark, “At the Paris Air Show, Anticipating a Surge in Sales,” The New York Times, June 18, 2011, page B1. The image used above is from the Paris Air Show website, here.

Truck Border Crossings into the U.S. from Mexico

Four U.S. states share a land border with Mexico over which a great deal of commerce enters the United States by truck. The measurement presented here is the number of truckloads entering the United States from Mexico in 2009. Texas is the state through which the largest number of trucks cross the U.S.–Mexican border.

Geographic reference: United States
Year: 2009
Market size: 4,291,000 crossings
Source: “Table 3-18: Incoming Truck Crossings, U.S. – Mexican Border: 2002–2009,” State Transportation Statistics 2009, page C-14.
Original source: Research and Innovation Technology Administration, Bureau of Transportation Statistics, U.S. Department of Transportation

Truck Border Crossings into the U.S. from Canada

Ten U.S. states share a land border with Canada over which a great deal of commerce enters the United States by truck. The measurement presented here is the number of truckloads entering the United States from Canada in 2009. Michigan is the state through which the largest number of trucks cross the border.

Geographic reference: United States
Year: 2009
Market size: 5,021,000 crossings
Source: “Table 3-12: Incoming Truck Crossings, U.S. – Canadian Border: 2002–2009,” State Transportation Statistics 2009, page C-12.
Original source: Research and Innovation Technology Administration, Bureau of Transportation Statistics, U.S. Department of Transportation

Bridges

The total number of road bridges presented in this market size post can be broken down by whether these are rural bridges or urban area bridges. Rural bridges make up 74% of the total and urban bridges 26%. According to the source, nearly a quarter of these bridges are in poor shape, defined as either structurally deficient or, more ominously, functionally obsolete.

Geographic reference: United States
Year: 2009
Market size: 601,078 bridges
Source: “Table 1-5: Number of Road Bridges by Functional System: 2009,” State Transportation Statistics 2009, page A-5.
Original source: Research and Innovation Technology Administration, Bureau of Transportation Statistics, U.S. Department of Transportation

Roads in Texas

As a nation of heavy drivers, it is not surprising that we have an awful lot of paved roads. And in this nation of drivers, the largest state in terms of the number of miles of paved roads is Texas. While Alaska is the state with the larger geographical area, it is sparsely populated compared to Texas, the state with the second largest number of square miles.

Geographic reference: Texas
Year: 2008
Market size: 306,404 miles
Source: “Table 1-1: Public Road Length, Miles by Functional Systems: 2008,” State Transportation Statistics 2009, page A-1.
Original source: Research and Innovation Technology Administration, Bureau of Transportation Statistics, U.S. Department of Transportation

Vehicle Registrations

Here, we look at automobile registrations as well as light truck registrations. These vehicles are used for both personal and commercial purposes but can be seen as primarily vehicles for personal use.

Geographic reference: United States
Year: 2008
Market size: Automobiles, 137.1 million and Light Trucks, 101.2 million
Source: “United States Fast Facts,” State Transportation Statistics 2009, page V.
Original source: Research and Innovation Technology Administration, Bureau of Transportation Statistics, U.S. Department of Transportation

Motorcycle Travel

This past decade or so has seen increased number of passenger-miles traveled by motorcycle in the United States. Yet a closer look at the data shows that since the number of motorcycles registered rose at a faster rate (81%) than did the passenger-miles traveled (59%) between 2000 and 2008, each bike, on average, actually traveled slightly fewer miles in 2008 than it did in 2000. Motorcycle registrations in the United States numbered 4.3 million in 2000 and 7.8 million in 2008.

Geographic reference: United States
Year: 2000 and 2008
Market size: 11,516 and 18,395 million passenger-miles respectively
Source: “Table 1-37: U.S. Passenger Miles (Millions),” Bureau of Transporation Statistics, National Transportation Statistics, available online here.