Video Games

video gamesThe number of active gamers worldwide exceeds 2.3 billion, 46% of whom buy video games. Video game enthusiasts not only play video games, they read about them and discuss them in online communities. They also watch esports and their favorite players on video game streaming services.

Video games have come a long way since Atari’s Pong debuted in arcades in 1972. Graphics have improved greatly, from 8-bit in the 1970s, 3D in the 1990s and high-definition in the early 2000s to augmented and virtual reality currently. Video game enthusiasts have a wide range of genres to choose from: action, adventure, role-playing, strategy, simulation, sports, logic, and trivia, to name a few. Gamers can play against the computer, with a few friends, or as part of a team in massively multiplayer online games.

Worldwide, mobile games are expected to generate 51% of video game sales in 2018, console games 25% and PC games 24%. Smartphone game revenue is projected to reach $56.4 billion in 2018, more than 80% of total mobile gaming revenue.

Today’s market size shows the projected global sales of video games in 2018 and 2021. Overall, sales increased by 13.3% from 2017 to 2018. Smartphone game sales grew the most, 29.0%, followed by tablet games (+13.1%) and boxed/downloaded PC games (+4.5%). Console game sales rose 4.1% over this time period. Browser PC game sales, however, dropped 13.9%. Which games are most popular? God of War for the PS4 topped sales with nearly 4.6 million units sold in 2018, followed by Monster Hunter: World (PS4, 4.3 million) and Far Cry 5 (PS4, 3.5 million).

Geographic reference: World
Year: 2018 and 2021
Market size: $137.9 billion and $180.1 billion respectively
Sources: Leo Sun, “The World’s Top 5 Video Game Markets,” Lansing State Journal, August 25, 2018, page 3B; Tom Wijman, “Newzoo’s 2018 Report: Insights Into The $137.9 Billion Global Games Market,” June 20, 2018 available online here; “Video Game History,” History, 2017 available online here; “Global Yearly Chart,” VGChartz available online here.
Original source: Newzoo.
Image source: Pexels, “candy-crush-device-electronics-game-1869655,” Pixabay, November 29, 2016 available online here. Use of image does not constitute endorsement.

Pinball Tournaments

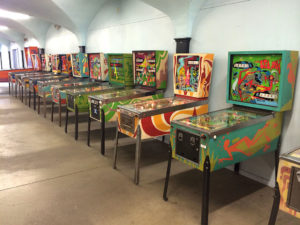
Pinball machinesPinball machines have existed in one form or another since the 1930s. Before that, the French game Bagatelle, a predecessor to pinball, was popular in Europe and United States in the 1700s and 1800s. In the early 1930s, there were more than 100 companies manufacturing pinball machines. Before 1947 when the flipper became a part of pinball machines, pinball was considered by some a game of chance—a form of gambling—and was outlawed in many large cities, including Chicago where pinball machines were manufactured. A mayoral commission in New York City in 1941 “declared that pinball could lead youths to a life of crime.”1 The game, however, remained popular, especially in the suburbs.

In 1956 a Federal court ruled that flipper-type pinball games were not a form of gambling and could not be regulated as such. Starting in the 1960s, ordinances banning pinball games were removed, although some bans would remain until the mid-1970s.

The popularity of pinball began to wane in the 1980s due to the emergence of video games. By 1999 there was only one manufacturer of pinball machines, Stern Pinball. Jersey Jack Pinball became another manufacturer in the United States in 2011. The game has become more popular in recent years, and so have pinball tournaments. In 2016 the International Flipper Pinball Association (IFPA) hosted 3,571 tournaments worldwide, attended by more than 91,000 people. In 2008 the IFPA hosted 334 tournaments, attended by 7,436 people.

Today’s market size shows the number of players who attended a tournament in 2008 and 2016, according to the IFPA. Competitors are mostly male (88.4%) and between the ages of 30 and 49 (66.2%). In 2016 tournaments were held in 24 countries. Of the 40 countries with players in the ranking system, the United States has the most by far, 18,924, followed by Canada (2,736), Australia (2,029), France (1,388) and Germany (1,148).

1“Pinball,” How Products Are Made from Encyclopedia.com, Gale Research, Inc., 1996 available online here.

Geographic reference: World
Year: 2008 and 2016
Market size: 2,585 and 17,244 respectively
Source: “Players by Year,” International Flipper Pinball Association, 2017 available online here; “Events by Year,” International Flipper Pinball Association, 2017 available online here; “Pinball,” How Products Are Made from Encyclopedia.com, Gale Research, Inc., 1996 available online here; “A Little Pinball History,” Pinball Magazine available online here; Balestier, Courtney, “Inside the Wild Comeback of Tournament Pinball,” CNN, June 9, 2014 available online here; Robach, Amy, “A Look at the Unlikely Resurgence of Pinball in the Mobile Age,” NBC Nightly News with Lester Holt, October 1, 2017 available online here; “Players by Country,” International Flipper Pinball Association, 2017 available online here.
Image source: Howzit, Sam, “Pinball Machines at Cedar Point,” Wikimedia Commons, July 10, 2014 available online here.

E-sports

E-sports tournamentE-sports are tournaments where teams of video game players compete against each other for prize money. Traditionally, fans have watched in person and online on streaming services such as Twitch and BAMTech. As e-sports have become more mainstream, fans are able to watch the tournaments on television channels such as TBS and ESPN also. An estimated 258 million people watched e-sports in 2017, an increase of 20% from 2016, according to SuperData.
Today’s market size shows total revenues earned by e-sports in 2016. Most of the revenues were earned from advertising, ticket sales, and merchandise. According to the source, e-sports is a valuable marketing tool for selling video games. Worldwide video game sales—mobile, computer, and console—in 2016 totaled $83 billion according to SuperData.

Geographic reference: World
Year: 2016
Market size: $900 million
Source: “E-sports: Play Time,” The Economist, August 19-25, 2017, page 56; “eSports Market Report,” SuperData Research available online here.
Original source: SuperData
Image source: Yo_Tobimoto 2017_05_20_2GGC Greninja Saga_ (46 of 50) via photopin (license)

Electronic Games

The world of games, electronic games, is changing quickly as mobile devices become an ever more important platform on which they’re played. As a result, one may find estimates of sizes for this market that vary greatly, all depending on how a particular source defines the market. What was once primarily a software business—the making of electronic games to be sold, loaded onto a computer and then played—has become something much broader. Access to the Internet and higher speed connections globally have also fueled the growth in this industry.

Today’s market size is an estimate of total revenues—including all platforms, PCs, smartphones, TV and consoles, tablets, and massively multiplayer online (MMO) games—of the global electronic games market in 2012 and a forecast for revenues in 2016.

Geographic reference: World
Year: 2012 and forecast for 2016
Market size: $66.3 billion and $86.1 billion
Source: Dean Takahashi, “Mobile growth will fuel global game market that hits $86.1B by 2016,” VB Gamebeats, June 6, 2013, available online here.
Original source: Newzoo
Posted on March 31, 2014

Expenditures on Reading Materials

The U.S. Bureau of Labor Statistics (BLS) carries out an annual survey of millions of households to track what they spend money on, by category. The resulting data has been collected over decades and seeing the trends that these data expose over time is very interesting.

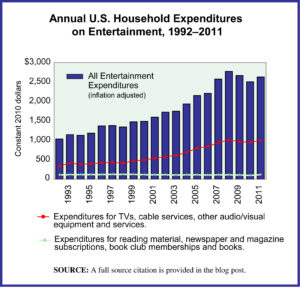
The graph presented here is made with BLS data from this survey series. It shows inflation-adjusted household expenditures on all categories of entertainment, as well as two subsets of expenditures, (1) those for TVs, audio/video equipment and services, such as cable subscriptions and (2) expenditures for reading material. The full category of entertainment expenditures is broad and includes things such as:

—Fees to attend concerts, sporting events, movies, and sporting clubs/fraternal organizations.
—TVs, radios and other audio/video equipment as well as subscriptions for cable, premium TV and the like.
—Pets, toys and hobbies, as well as all the services and equipment related to those.
—Bikes, athletic shoes, and equipment for camping, exercising, fishing, and all sports, as well as boats and docking fees, fireworks, pinball machines and video consoles.

Today’s market size is the average spent by U.S. households on reading material in 1994 and in 2011. The figures do not include expenditures for any textbooks or reading material purchased as part of a formal educational program. The transition to digital which is taking place in most areas of publishing is not well tracked by this BLS survey series. It is unclear from studying the survey results, for example, whether or not all online subscriptions to newspapers and magazines are consistently captured in the expenditure category “Reading.” Over time this will change as time allows data collection organizations, like the BLS, to adjust to the digital transition. Data collection organizations can only adjust as quickly as the industries they cover—in this case, the publishing industry—adjust to such dramatic changes.

Geographic reference: United States
Year: 1994 and 2011
Market size: $165 and $115 respectively. These figures translate to a national gross household spending on reading materials for each of those years of $16.86 billion and $14.06 billion respectively
Source: “Consumer Expenditure Survey,” Multiyear Tables: 1992-99 Multiyear Table, 2000-05 Multiyear Table, and 2006-11 Multiyear Table, all available on the Bureau of Labor Statistics website here.
Original source: U.S. Department of Labor, Bureau of Labor Statistics, Consumer Expenditure Surveys
Posted on May 9, 2013

Dolls, Games, and Toys

The United States is the largest toy and game market in the world, with an estimated retail sales value in 2010 of $22 billion. This estimated value includes video game consoles but does not include the games themselves, which are categorized as software but by some estimates would add another $10 billion to the actual value of the dolls, games, and toys market. Of course, if we included things that somebody considered a toy while another considered a vehicle of some sort—boat, bike, snowmobile—it would be an even larger market… Yes, defining the market is key, which is part of what makes a system like the North American Industrial Classification System (NAICS)—used by Canada, Mexico, and the United States—so useful.

Today’s market size post breaks the U.S. dolls, games, and toys industry down into three categories, U.S. manufacturer shipments, imports, and exports. The fact that U.S. made product is valued by the Census Bureau at less the value of exports is the result of what is called re-exportation; some of what is imported is turned right around and exported. A topic for another day.

Geographic reference: United States
Year: 2002 and 2010
Market size: Domestic production at wholesale: $4.85 and $2.86 billion
Market size: Exports F.A.S.: $1.16 and $3.77 billion
Market size: Imports C.I.F.: $12.06 and $22.30 billion
Source: “Statistics for Industry Groups and Industries: 2010 and 2009,” Annual Survey of Manufactures 2010, available from the Census Bureau website here. and data from the U.S. International Trade Statistics database on NAICS industry 339932. The International Trade Statistics database is available online here.
Original source: U.S. Department of Commerce, Bureau of the Census
Posted on May 5, 2012

Toys & Games

Today’s market size post is the size of the market for toys and games in 2007 based on total retail sales made in any retail outlet, from grocery stores and pharmacies to department stores and toy stores. For those wishing to investigate further, the market size posted here is based on the product category “toys, hobby goods and games” which is designated by the U.S. Census Bureau with the product code 20460.

Geographic reference: United States
Year: 2007
Market size: $90.55 billion
Source: “Sector 44: Retail Trade: Industry Series: Preliminary Product Lines Statistics by Kind of Business for the United States: 2007,” 2007 Economic Census, released on September 29, 2009available online here.
Original source: U.S. Census Bureau
Posted on December 21, 2011

Gaming Software

The production of video game software is part of the larger software publishing industry, a small part but a growing part. Based on the report used as our source here, cited below, and data from the U.S. Census Bureau on the industry as a whole, in 2010 the gaming software revenue portion of the larger software industry accounted for 6.7% of the total. Today’s market size is the estimated revenue of the largest 220 companies active in the entertainment and games software industry in the United States.

Geographic reference: United States
Year: 2010
Market size: $10 billion
Source: “Entertainment & Games Software Industry Profile,” last updated on November 7, 2011. This is a report being sold by First Research on the website here.
Original source: First Research
Posted on November 18, 2011

Recreational Boating

Boat Registrations in Michigan

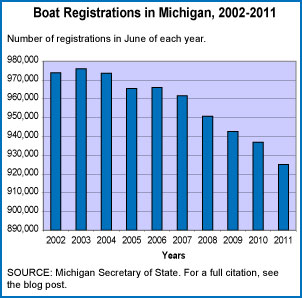
The market size reflects the amount spent on new boats, boating accessories, engines, trailers, and services in Michigan. Despite the fact that the number of boat registrations dropped from 2010, total spending on boats shows a 10.6% increase from a year ago. Nationwide, in 2010, the number of boaters hit a record high of 75 million, or 32.4% of adults. According to the National Marine Manufacturers Association, that’s the highest percentage since 1999.

Geographic reference: Michigan
Year: 2011
Market size: $351 million
Source: Barbara Wieland, “Boating Industry Rides Recovery Wave,” Lansing State Journal, June 19, 2011, page 1E
Original source: National Marine Manufacturers Association.

Video Games

The world of gaming is big and it is growing. Today’s market size is the number of video games sold annually. Leading video game publishers include Nintendo with around 19% of the market in 2010, Electronic Arts (12%), Activision (9.6%) and Ubisoft (7%).

Geographic reference: World
Year: 2000, 2005 and 2010
Market size: In millions of units: 43.7, 128.7 and 651.9 respectively
Source: “Worldwide Yearly Chart,” a report on the industry by VGChartz made available online here.
Original source: VGChartz Network

Toys, Dolls, and Games

The size of the retail market for toys, dolls, and games is our market size post for today. It seems a natural topic for this week of Christmas preparations.

Geographic reference: United States
Year: 2008
Market size: $21.6 billion
Source: “Toys — Industry Outlook,” Great American Group, Volume 121, available here.
Original source: The NPD Group, Inc.

Size of the Sporting Goods Equipment Market

The size of this market is estimated based on the sale of new equipment. The leading product categories in this market include exercise equipment (21.3%), golf gear (14.3%), sports-related firearms (11%), fishing equipment (8.3%), and camping gear (8%).

Geographic reference: United States
Year: 2008
Market size: $53.4 billion
Source: Sporting Goods available online here.
Original source: IBISWorld

U.S. Market for Toys, Dolls and Games

This market is broken down into product segments in this way: video games (35.9%), infant and preschool (9.2%), outdoor sports (8.4%), dolls (7.8%), arts & crafts (7.5%), games & puzzles (6.9%), vehicles (6.1%), other toys (6.1%), and 12.1% for the three remaining categories of plush toys, action figures and their accessories, and youth electronics.

Geographic reference: United States
Year: 2008
Market size: $21.9 billion
Source: “Toys Industry Outlook,” September 2009 available online here.
Original source: IBISWorld