Driving Apparel

motorsports driving apparelMotorsports describes a group of competitive sporting events in which motorized vehicles are used. Automobiles, motorcycles, boats and snowmobiles are some of the vehicles used in these types of competitions. Not all are racing competitions, however. Drifting and tractor pulling are two non-racing motorsports.

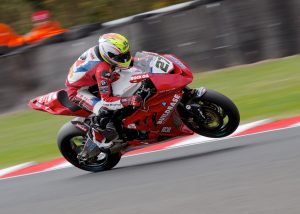
From 2015 to 2020, the global motorsports market is expected to grow at a compounded annual growth rate of nearly 10%, reflecting the popularity of the sport. Participating in this sport is dangerous and requires specialized driving apparel—helmets, jackets, gloves, boots, and other protective clothing—in order to keep the drivers of the vehicles safe. This apparel is usually thicker and heavier than regular clothing, heavily padded, and in some cases contains armor.

Today’s market size shows the amount spent globally on specialized driving apparel in 2016 and spending projections for 2025. The market is expected to grow between 2017 and 2025 primarily due to laws and regulations mandating the use of protective clothing and the drivers themselves concerned about their safety. The Asia-Pacific region spent nearly $4.5 billion on driving apparel in 2016, accounting for more than one-third of the total global spending on this type of apparel that year.

Geographic reference: World
Year: 2016 and 2025
Market size: $12.03 billion and $18.56 billion respectively
Sources: “Global Driving Apparel Market Size US$18.565.0 mn by 2025 | CAGR: 5.3% – Transparency Market Research,” Nasdaq GlobeNewswire Press Release, November 29, 2017 available online here; “Driving Apparel Market,” Transparency Market Research Press Release, November 6, 2017 available online here; “Motorsports Market Analysis: By Channels (Broadcasting Revenue In Motorsports Market, Ticketing Revenue in Motorsports Market and Others) and by Geography (Americas, APAC and Europe) – With Forecast (2015-2020),” Cision PR Newswire Press Release, April 21, 2016 available online here; “Motorsport,” Wikipedia, January 12, 2018 available online here; “Drifting (Motorsport),” Wikipedia, January 11, 2018 available online here.
Image source: sms467, “superbike-motorsport-fast-speed-930715,” Pixabay, September 11, 2015 available online here. Use of the image does not constitute endorsement of the brands shown.

College Football Guarantee Games

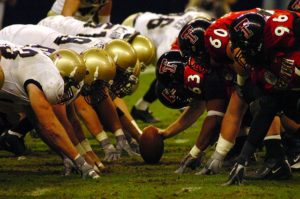
College football guarantee games are mostly non-conference games arranged by contract among opponent schools, in most cases many years in advance. These contracts involve payment to one or both of the schools involved. While these types of games have been in existence for many years, payments have skyrocketed in the past decade and a half from several hundred thousand dollars per contract to several million dollars per contract.

In some cases, larger schools hand-pick their opponents, sometimes smaller schools that they’re presumably likely to beat, while paying the smaller schools an amount more than the revenue the smaller schools are likely to earn by ticket and merchandise sales. In other cases, matchups are chosen based on the strength of both teams, thereby giving their schedule a presumed advantage with the College Football Playoff selection committee. A matchup between two strong teams may also generate more revenue from fans and higher ratings from television broadcasts.

Today’s market size is the estimated amount of money exchanged during the regular 2017 college football season for guarantee games involving teams in the Football Bowl Subdivision (FBS). In 2017 there were more than 200 guarantee game contracts with teams in the FBS.

Geographic reference: United States
Year: 2017
Market size: More than $150 million
Source: Berkowitz, Steve, “Guarantee Games Grow in Stature,” USA TODAY for the Lansing State Journal, August 30, 2017, page 5C.
Original source: USA TODAY Sports
Image source: Skeeze, “Football-american-scrimmage-line-557206,” Pixabay, December 9, 2014 available online here.

Athlete Endorsements

With the end of the 2014 Winter Olympics having been celebrated yesterday, we turn our attention today to the subject of how much is spent every year paying athletes to endorse products. By its very nature, the endorsement of an athlete requires that the athlete be a superstar, at least within his or her own sport. Thus, it will come as no surprise that 70% of the earnings from athlete endorsements in 2013 were earned by the top 100 such spokesmen and women.

The top three earners included two golfers and a tennis player, in order; Tiger Woods, Roger Federer, and Phil Mickelson. Also of interest, only four women made the top 100 list, each is a tennis player. When the top one hundred athlete endorsement deals of 2013 are analyzed by sport, one sees that basketball has the largest number of players on the list and earns the largest total of the athletic endorsement pie (15%). A full breakdown by sport is provided in a detailed table on the source website, a link to which is provided below.

Today’s market size is the approximate value of all athlete endorsements, worldwide, in 2013. We give a tip of the hat to the Ghulf Genes blog for a link to the source of today’s market size.

Geographic reference: World
Year: 2013
Market size: $1.1 billion
Source: “Top 100 Highest-Paid Athlete Endorsers 2013,” Opendorse, available online here.
Posted on February 24, 2014

Super Bowl TV Ads

SuperBowlAds

The Super Bowl is one of the big, annual TV events in the United States and as such it draws a large number of views. As a result, those wishing to reach a broad audience and having lots of money to spend, like to advertise during the Super Bowl. In fact, for many viewers, the advertisements themselves have become part of the attraction of the event.

The pie graph we present here shows ad spending by industry category in 2003 and 2013. Clearly, the auto industry has decided that the Super Bowl is a great way to grab attention for new cars and trucks. In 2013 that industry accounted for 33% of Super Bowl ad spending, up from 7% in 2003.

Today’s market size is the total spent on TV advertisements during the Super Bowl in 2003 and in 2013. The source we link to below provides a very interesting, interactive graphic with details on each Super Bowl from 2000 through 2013 as well as links to videos of memorable advertisement broadcasts in each year.

Geographic reference: United States
Year: 2003 and 2013
Market size: $130 and $292 million respectively
Source: Andrew Garcia Phillips and Willa Plank, “Super Bowl Spending Driven by Automotive Ads,” Wall Street Journal, available online here.
Original source: Kantar Media
Posted on February 5, 2014

“Big Ten” Conference TV Revenues

The “Big Ten Conference” is the oldest Division I college athletic conference in the United States. It has twelve member institutions, despite its name, and is slated to add two more in 2014. These are flagship research universities in their respective states, well-regarded academically and with relatively large student enrollment. They are located primarily in the Midwest.

In the Big Ten conference, revenue from television contracts helps to cover the cost of coaches salaries, scholarships, travel and game-day expenses. TV revenue also helps to cover the cost of athletic programs that do not bring in sufficient revenues to sustain themselves, such as tennis, gymnastics and rowing.

The National Collegiate Athletic Association requires athletic programs to maintain at least 16 varsity sports. The Big Ten conference requires 20. According to Sports Illustrated, the expansion of the Big Ten conference to 14 schools in the 2014-2015 school year will help to nearly double the per-school television contract revenue by 2017-2018. The data shown are on a per-school basis.

Geographic reference: United States
Year: 2012-2013 and 2017-2018
Market size: $25 million and $40 million, respectively, per school
Source: Editorial Staff, “MSU Athletics Win Off The Field, Too,” Lansing State Journal, July 14, 2013, page 7F and Chris Solari, “Power Play,” Lansing State Journal, July 14, 2013, pages 1D, 5D.
Original source: Sports Illustrated
Posted on July 16, 2013

Expenditures on Reading Materials

The U.S. Bureau of Labor Statistics (BLS) carries out an annual survey of millions of households to track what they spend money on, by category. The resulting data has been collected over decades and seeing the trends that these data expose over time is very interesting.

The graph presented here is made with BLS data from this survey series. It shows inflation-adjusted household expenditures on all categories of entertainment, as well as two subsets of expenditures, (1) those for TVs, audio/video equipment and services, such as cable subscriptions and (2) expenditures for reading material. The full category of entertainment expenditures is broad and includes things such as:

—Fees to attend concerts, sporting events, movies, and sporting clubs/fraternal organizations.
—TVs, radios and other audio/video equipment as well as subscriptions for cable, premium TV and the like.
—Pets, toys and hobbies, as well as all the services and equipment related to those.
—Bikes, athletic shoes, and equipment for camping, exercising, fishing, and all sports, as well as boats and docking fees, fireworks, pinball machines and video consoles.

Today’s market size is the average spent by U.S. households on reading material in 1994 and in 2011. The figures do not include expenditures for any textbooks or reading material purchased as part of a formal educational program. The transition to digital which is taking place in most areas of publishing is not well tracked by this BLS survey series. It is unclear from studying the survey results, for example, whether or not all online subscriptions to newspapers and magazines are consistently captured in the expenditure category “Reading.” Over time this will change as time allows data collection organizations, like the BLS, to adjust to the digital transition. Data collection organizations can only adjust as quickly as the industries they cover—in this case, the publishing industry—adjust to such dramatic changes.

Geographic reference: United States
Year: 1994 and 2011
Market size: $165 and $115 respectively. These figures translate to a national gross household spending on reading materials for each of those years of $16.86 billion and $14.06 billion respectively
Source: “Consumer Expenditure Survey,” Multiyear Tables: 1992-99 Multiyear Table, 2000-05 Multiyear Table, and 2006-11 Multiyear Table, all available on the Bureau of Labor Statistics website here.
Original source: U.S. Department of Labor, Bureau of Labor Statistics, Consumer Expenditure Surveys
Posted on May 9, 2013

Spending on TV Ads During Sporting Championships

As we prepare to feast upon the spectacle that is the Super Bowl there is much talk about the advertisements that will be shown during the game. Turns out, in three of the last five years baseball’s World Series actually sold more advertising during its championship series than did the Super Bowl, with far less attention to the fact. But the baseball World Series is, of course, a series and not a single, super hyped game. There is no question that Super Bowl ads have become for many part of the show.

Today’s market size is the spending on network television advertising during the broadcasting of major sporting championships in 2011.

Enjoy the spectacle!

Geographic reference: United States
Year: 2011
Market size: Football – Super Bowl $228 million
Market size: Baseball – World Series $269 million (7 game series)
Market size: Basketball – NCAA Mens BB Final Four $170 (3 games)
Source: Jack Loechner, “Super Bowl Ad Stats,” a blog post on MediaPost, January 30, 2012, available here.
Original source: Kantar Media
Posted on February 4, 2012

Spectator Sports

Today’s market size is the estimated total of revenue brought in by professional or semi-professional sports teams or clubs primarily engaged in participating in live sporting events—baseball, basketball, football, hockey, soccer, and jai alai games—before a paying audience. These establishments may or may not operate their own arena, stadium, or other facility for presenting these events. This is an industry that did not see a decline in revenues year-over-year during the recent recession, though its rate of growth did slow a bit.

Geographic reference: United States
Year: 2009
Market size: $20.64 Billion
Source: “Table 9.1. Arts, Entertainment, and Recreation Services (NAICS 71) — Estimated Revenue for Employer Firms: 2001 Through 2009,” Service Annual Survey: 2010, the report on NAICS Sector 71 is available online here.
Original source: U.S. Census Bureau
Posted on October 7, 2011

Major League Baseball Tickets

The 2011 Major League Baseball postseason has begun but statistics have yet to be published to reveal the official number of regular season MLB tickets that were sold this season. Therefore, we look to last year for the size of audiences at MLB games for today’s market size post. Projections early in 2011 forecast a slight increase in ticket sales for 2011.

Go Tigers!

Geographic reference: United States
Year: 2010
Market Size: $73.1 million tickets sold
Source: David Simmons, “Early Ticket Sales and Attendance Projections for MLB in 2011,” Bizofbaseball.com, April 13, 2011, available online here.
Original Source: Business of Sports Network
Posted on October 4, 2011