LNG Bunkering

cargo ship LNG bunkering
The increase in demand for cargo shipping through 2027 is expected to lead to a 45.4% compound annual growth rate for LNG bunkering over this time period.
Geographic reference: World
Year: 2019 and 2027
Market size: $0.38 billion and $5.14 billion, respectively

Today’s market size shows the total global revenues from LNG (liquefied natural gas) bunkering in 2019 and projected for 2027. LNG bunkering is the process of fueling a ship with liquefied natural gas. On January 1, 2020, new International Maritime Organization regulations concerning sulfur dioxide emissions went into effect. The new rule limits sulfur in fuel oil used in marine vessels (bunker fuel) to 0.50% mass by mass (m/m), much lower than the previous 3.5% limit.1 Sulfur dioxides are linked to asthma, and pulmonary, cardiovascular, and respiratory diseases. Sulfur dioxides also cause acid rain. Traditional bunker fuel contains 27,000 parts per million (ppm) of sulfur compared to 10-15 ppm in vehicle fuel. Heavy fuel oil accounts for 14% of sulfur emissions. The use of liquefied natural gas, on the other hand, reduces sulfur dioxide emissions by 100%. In addition, carbon dioxide emissions are reduced by 25% and nitrogen oxide emissions are reduced by 90%. In 2020, fewer than 400 out of more than 80,000 registered ships globally ran on liquefied natural gas.2 This number is expected to grow to 1,000 by 2030. About 13% of the new build order book is for LNG-fuelled ships.

Ship-to-ship bunkering held 60.5% of the market in 2019 and is expected to maintain the highest share through 2027 due to the increasing number of LNG-fuelled ships, a fuel ship’s high capacity, and the fast transfer rate of fueling operations. The increase in demand for cargo shipping is expected to lead to a 45.4% compound annual growth rate in the cargo fleet segment through 2027. This segment also held the highest share of the market in 2019. By region, Europe had the highest revenue share in 2019 and is expected to maintain its lead through 2027 due to a broad customer base and a rise in shipping activity. In addition, this region is increasing its investment in LNG bunkering infrastructure. Some leading global LNG bunkering companies include Broadview Energy Solutions B.V., Crowley Maritime Corp., Gasum Oy, Harvey Gulf International Marine, Klaw LNG, Korea Gas Corp., Polskie LNG S.A., Royal Dutch Shell PLC, Petronas, and Exxon Mobile Corp. among others. 

1 Certain parts of the world—the Baltic Sea area, the North Sea area, the North American area, and the United States Caribbean Sea area—have limits of 0.10% m/m.
2 Those that did not invest in LNG-fuelled ships took other steps to comply with the new environmental regulations. Some shipowners fitted their ships with exhaust-gas cleaning systems that prevent sulfur from being released into the atmosphere. Others started using very low-sulfur fuel oil (VLSFO) to meet the higher standards. By the end of 2020, 70% of major ships were using VLSFO. In some parts of the world, prices for such fuel were double that of heavy fuel oil and there were shortages at some ports. In addition, some shipping companies were reporting engine failures after switching to this new fuel blend.

Sources: “LNG Bunkering Market Size to Reach USD 5.14 Billion by 2027 at a CAGR 45.2% | Valuates Reports,” CISION PR Newswire, April 1, 2021 available online here; “LNG Bunkering Market by End-User (Container Fleet, Tanker Fleet, Cargo Fleet, Ferries, Inland Vessels and Others) – Global Opportunity Analysis and Industry Forecast, 2017-2023,” Valuates Reports Description, November 2019 available online here; “Bunker (Fuel),” Science Direct, 2019 available online here; Jack Wittels, “Shipping’s Big Bang Sends Two Global Industries Spinning,” Transport Topics, January 14, 2020 available online here; “IMO 2020 – Cutting Sulphur Oxide Emissions,” International Maritime Organization available online here; Peter Keller, “The Outlook for LNG as a Marine Fuel,” The Maritime Executive, February 20, 2021 available online here; “LNG: An Energy of the Future,” Elengy available online here; Jessica Jaganathan, “LNG-fuelled Tankers to More Than Double by 2030 – Petronas Exec,” Reuters, September 15, 2020 available online here; Nishan Degnarain, “Shipping-Gate: Why Toxic VLSFO ‘Frankenstein Fuel’ Is Such A Danger For The Planet,” Forbes, December 21, 2020 available online here.
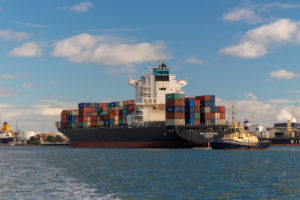
Image source: John Simmons, “Melbourne Shipping,” Unsplash, April 9, 2021 available online here. Photo is used for illustration purposes. This particular vessel may not be LNG-fuelled.

Seaborne Freight

SeaborneFreight

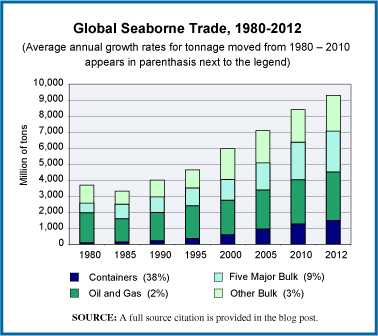
The most energy efficient means of moving freight is by moving it over water. The increase in global trade over the last few decades and particularly the increase in moving raw materials long distances as part of the overall manufacturing process has meant a significant rise in seaborne freight. The chart we offer here shows that increase by charting the tonnage moved annually by sea, broken into three categories: (1) tonnage moved in shipping containers, (2) movements of oil and gas, and (3) movements of cargo in bulk which includes all those things which may be moved in a dry cargo container ship. This final category is further broken down into the five major bulk products and all other bulk. The five major bulk products are iron ore, grain, coal, phosphates and bauxite.

The overall trajectory of growth is clear. What may not be quite as clear is the growth in how much of that freight is moved in container ships, the category shown in blue at the bottom of each bar. The growth of containerized freight movements has been the most striking. Over the period 1990 to 2012 the movement of containerized freight, when measured in tons moved, increased by 16% per year For those interested in more on container shipping, here’s a link to an earlier post we did covering the container ship market.

Today’s market size is the number of tons of freight moved by sea in 2000 and 2012. Of these totals, the percentage of freight moved in container ships, and thus, for the most part, finished goods as opposed to raw materials, was 10% in 2000 and 16% in 2012.

Geographic reference: World
Year: 2000 and 2012
Market size: 5,984 and 9,297 million tons respectively
Source: “Figure 1.2 International Seaborne Trade, by Cargo Type, Selected Years, 1980-2012,” Review of Maritime Transportation 2012, United National Conference on Trade and Development, 2013, page 9, available online here.
Original source: United Nations
Posted on August 19, 2013

Container Ships

The sharp rise in global trade over the last decades has been a boon to the shipping industry. The number of large container ships, which move so much of the increased quantity of partially and/or fully finished products being traded internationally, has grown and that growth is anticipated to continue through 2016 according to the World Shipping Council. The size of those ships is also on the rise.

The capacity of container ships—referred to in the trade as cellular vessels as they are designed to efficiently load and store freight containers one on top of the other with vertical braces at the four corners—is measured in terms of twenty-foot equivalent units (TEUs), or the number of twenty-foot containers that the vessel can carry (these containers measure 20′ x 8′ x 8’6″). In the year 2000, the world fleet of container ships was primarily made up of ships with a capacity of 1,000 or fewer TEUs. Vessels this size made up approximately three-quarters of the world fleet. In 2012, they represented less than 30% of the fleet with much larger vessels dominating the trade. While the number of ships rose by only 2.8% between 2000 and 2012, the fleet’s carrying capacity almost tripled, rising 182%. So, the average per container ship capacity went from 1,200 TEUs in 2000 to 3,295 in 2012.

Today’s market size is the number and carrying capacity of cellular shipping vessels worldwide in 2000, in 2012, and a projection for where this fleet will stand in 2016.

Geographic reference: World
Year: 2000, 2012, 2016
Market size: Number of ships respectively: 4,828; 4,961 and 5,433
Market size: Carrying Capacity in million TEUs: 5.8; 16.34 and 19.83
Source: “Container Ship Types,” GlobalSecurity.org, July 7, 2011, available online here. “Cellular Fleet Forecast,” Alphaliner, February 2013, available online here.
Original source: Alphaliner
Posted on February 21, 2013

Marinas

Those offering services to boaters by operating docking and/or storage facilities for pleasure craft owners are Marinas. Some marinas offer additional services such as repair and maintenance services as well as retailing of fuel and marine supplies. The states within the United States with the largest marina industries, in order, are Florida, New York, California, Michigan and Massachusetts.

Today’s market size is the estimated revenues from all marinas in the United States in 2009.

Geographic reference: United States
Year: 2009
Market size: $3.3 billion
Source: “Table 9.1. Arts, Entertainment, and Recreation Services (NAICS 71) — Estimated Revenue for Employer Firms: 2001 Through 2009,” Service Annual Survey: 2010. The report on NAICS Sector 71 is available online here.
Original source: U.S. Census Bureau
Posted on September 9, 2011

Recreational Boat Market

Recreational boats

North America is the largest geographical market for recreational boats but growth in this market is anticipated primarily in Europe and the Asia-Pacific areas. Trends show that higher-end and luxury boats will be the area of most market growth in the coming years. The market size listed for 2014 is a forecast based on the source’s research.

Geographic reference: World
Year: 2008 and 2014
Market size: $23.9 billion and $25.8 billion respectively
Source: Travel & Leisure Close-Up, January 15, 2010.
Original source: Research and Markets