Metal Recycling

copper metal recycling
Geographic reference: World
Year: 2019 and 2027
Market size: $957.8 billion and $1.4 trillion, respectively

Metal recycling is a multibillion-dollar enterprise that will soon become a trillion-dollar industry. Today’s market size shows total global revenues for metal recycling in 2019 and projected for 2027. Society’s focus on conservation of resources and reducing greenhouse gas emissions along with increasing demand for metals are fueling growth in this industry.

By using recycled metal for their finished products, manufacturers can reduce their production costs. Recycling metal is less costly than mining ore and refining it into usable metals. Since the extraction and refining have already been done, the recycled metal just needs to be melted down into usable shapes, eliminating some of the more expensive and energy-intensive steps in the process. Recycling steel uses 74% less energy than creating it from raw materials.

Steel is the world’s most recycled material, with 650 million tons recycled every year. By volume, steel accounted for 79% of recycled metal demand worldwide in 2019. Steel can be infinitely recycled without loss of quality and can be easily separated from other types of metal scrap during the recycling process using large industrial magnets. Despite the large amount of steel that’s recycled, there isn’t enough scrap available to meet the demand for steel products. On average new steel products contain about 37% recycled steel.

China is the largest steel producer in the world, producing more than 996 million tons in 2019, or about 53% of global production. Of that, 215 million tons were sourced from scrap recycling, the most in the world. That year, the United States ranked third in steel production, behind the European Union. It produced 87.9 million tons of steel, using 60.7 million tons of steel scrap.

While aluminum and copper make up a small fraction of the metals recycled by volume, recycling rates for both are quite high. The global recycling rate for aluminum is 76%, with 30 million tons being recycled yearly. Three-quarters of the 1.5 billion tons of aluminum ever produced is in use currently. Only about 12% of the 5.8 trillion pounds in the world’s known copper reserves have been mined, but almost all of it is still in circulation. Each year about 8.5 million tons of copper are recovered from scrap.1 In the United States, about 72% of copper used by copper and brass mills, excluding wire production which uses newly refined copper, comes from recycled copper. In Europe, 50% of the copper consumed is sourced from recycled material.

By industry, the construction sector held a greater than 46% share by volume in 2019, followed by the automotive sector with a 25% share. Although there was decreased demand for metal in several industries including the construction and automotive sectors in much of 2020 due to the coronavirus pandemic, demand is expected to recover in 2021 and beyond as restrictions ease once vaccination becomes widespread. In fact, by late November 2020 in the United States overseas demand for recycled ferrous metals increased substantially due to governments investing in steel-intensive infrastructure projects. However, the supply of scrap metal has remained below pre-pandemic levels due to seasonal factors and public health restrictions, causing prices to rise.

The Asia-Pacific region is the largest producer of metals worldwide. With its well-established recycling industry, it accounted for more than 67% of global recycled metal revenue. This region is expected to be the fastest-growing market for metal recycling at least through 2027. Rapid urbanization, a need for proper waste management, and a growing manufacturing sector in India, China, Vietnam, Thailand, Myanmar, and Indonesia are expected to increase demand. Europe produces less metal than the Asia-Pacific region, however, its rate of recycled metal usage is higher in comparison to its virgin metal usage. Strict government regulation of energy usage along with an emphasis on the circular economy is expected to lead to increased demand for recycled metal in this region. Several leading metal recyclers maintain a presence in these two regions and in the United States including European Metal Recycling, CMC, Utah Metal Works, GFG Alliance, Norsk Hydro ASA, Kimmel Scrap Iron & Metal Co. Inc., Schnitzer Steel Industries Inc., Novelis Inc., Tata Steel Ltd., and Sims Metal Management Ltd. Tata Steel started its first recycling plant in Haryana, India in June 2019 to gain an early advantage in the Indian market.

1 In comparison, in 2019, 20 million metric tons of copper were mined worldwide.

Sources: “Metal Recycling Market Size, Share & Trends Analysis Report by Product (Aluminum, Steel, Copper), by Application (Construction, Automotive, Consumer Goods), by Region, and Segment Forecasts, 2020 – 2027,” Grand View Research Report Summary, July 2020 available online here; “Metal Recycling Market Size Worth $1.4 Trillion by 2027 | CAGR 4.9%: Grand View Research, Inc.,” CISION PR Newswire, January 21, 2021 available online here; “The Environmental and Financial Benefits of Recycling Metal,” Greener Ideal, April 6, 2020 available online here; “How Recycling Your Metal Can Benefit the Economy,” Taroni Metal Recycling available online here; “Steel Recycling,” World Steel Association available online here; “Steel: The Most Recycled Material in the World,” Napa Recycling and Waste Services available online here; World Steel Recycling in Figures 2015-2019, 11th Edition, Bureau of International Recycling, Ferrous Division, 2020 available online here; M. Garside, “Copper – Statistics & Facts,” Statista, December 4, 2020 available online here; “Copper Recycling,” International Copper Association, Copper Alliance available online here; “Europe Leading the World in Copper Recycling,” Energy Industry Review, August 7, 2018 available online here; “Copper – The World’s Most Reusable Resource,” Copper Development Association Inc. available online here; Brian Taylor, “Ferrous Market Booms Its Way Into 2021,” Recycling Today, December 11, 2020 available online here.
Image source: Alexas_Fotos, “copper-scrap-metal-scrap-disposal-1504098,” PIxabay, July 8, 2016 available online here.

Personal Luxury Goods

Personal luxury goods include high-end apparel, leather goods, accessories, watches, jewelry, perfume, beauty products and other high-end goods for personal use. Today’s market size shows the total global sales of personal luxury goods for 2018 and projected for 2025.1 Top companies in this sector, ranked by 2018 sales, include LVMH ($53.66 billion), EssilorLuxottica ($18.57 billion), Richemont ($16.05 billion), Kering ($15.71 billion), Swatch ($8.71 billion), Chow Tai Fook ($8.71 billion), Hermés ($6.88 billion), Ralph Lauren ($6.42 billion), Tapestry ($5.96 billion), and Capri Holdings ($5.38 billion).2

Traditionally consumers who wanted to purchase personal luxury goods shopped at specialty boutiques or high-end department stores such as Nordstroms, Bergdorf Goodman, or Saks Fifth Avenue. But, just as other brick-and-mortar retail establishments have been affected negatively by online retailers, so too have personal luxury goods retailers. Several online sites such as Net-a-Porter offer multiple brands of high-end merchandise for sale, free shipping and the convenience of shopping from home. Overall, in-store traffic decreased by 30% from 2012 to 2018. Still, according to EY Advisory, although more than 70% of purchases are influenced by online channels, nearly 90% of purchases are made in store.

Increasingly, many shoppers in their 20s through 40s who can afford high-end merchandise do not want to pay full price for their purchases. In addition, while many Millennials and Generation Z consumers want to be seen in new styles often, they are also concerned about sustainability. They see clothing resale and reuse as a way to conserve resources while also satisfying their want of a new wardrobe. Overall, 26% of luxury shoppers also buy secondhand. While wealthy consumers are unlikely to shop at places such as Goodwill or other thrift stores, they are shopping online at sites such as Fashionphile and TheRealReal which allow consumers to buy, sell and consign used luxury clothing and accessories and at sites such as Rent the Runway which allows consumers to rent high-end clothing for a monthly fee. Millennial and Generation Z consumers made a third of luxury purchases worldwide in 2018 according to Bain & Co. Purchases made by consumers in these two generations combined contributed to nearly all of the growth in the luxury goods sector in 2018.

Some luxury brands such as Gucci and Louis Vuitton have been opening boutique stores and expanding their website offerings in order to control their exclusivity while at the same time their merchandise is discounted at resale sites. Some luxury retailers are focusing on experiences and services to compete with online retail, resale, and rental sites by offering customers champagne and hors d’oeurves while they shop, having cafés and beverage bars in store, and hiring style advisors to help customers. Nordstrom partnered with Rent the Runway to offer customers the ability to drop off their Rent the Runway fashion items at their store. After learning that half their customers also buy or sell used merchandise, Neiman Marcus invested in a minority share of Fashionphile, however, they do not plan to sell secondhand merchandise in their stores or on their website.3 They may want to rethink that strategy, however. In ThredUp’s 2019 Resale Report, GlobalData, a retail analytics firm, found that 33% of consumers would buy more from luxury retailers if they offered secondhand clothing.

1 For the projected 2025 data, the source mentions the “luxury goods market.” The article in which this appears reports only on personal luxury goods, therefore, our editors assumed that this figure was for personal luxury goods only.
2 The source reports sales figures in euros. Our editors used the December 31, 2018 conversion rate of 1 Euro = 1.1466 U.S. dollars given on the Market Insider website here to convert the sales figures to U.S. dollars. Rankings do not include cosmetics companies. If they did the following companies would be in the top 10: L’Oréal ($30.84 billion), Estée Lauder ($13.99 billion) and Beiersdorf ($8.26 billion). Cosmetics sales include products at all price points.
3 Through the partnership with Fashionphile, Neiman Marcus has designated a few of their stores as drop-off points for customers who want to sell their merchandise on Fashionphile. Sellers receive an immediate quote from Fashionphile for their merchandise and immediate payment if they choose to sell. Neiman Marcus is hoping that customers will then want to use that payment to buy merchandise in their stores.

Note: Any mention of brands or companies in this post does not constitute an endorsement.

Geographic reference: World
Year: 2018 and 2025
Market size: $286.53 billion and $445 billion, respectively
Sources: Anne D’Innocenzio, “Luxury Stores Adapt to Changing Shoppers,” The Denver Post, December 29, 2019, pp. 1K, 6K; Florine Eppe Beauloye, “The 15 Most Popular Luxury Brands Online in 2019,” Luxe Digital, April 20, 2019 available online here; “Tailoring the Luxury Experience: The Luxury and Cosmetics Financial Factbook 2019 Edition,” EY Advisory S.p.A., 2019 available online here; ThredUp 2019 Resale Report, March 2019 available online here; Tom Ryan, “Are Secondhand Sales the Right Branding Move for Neiman Marcus?” RetailWire, April 23, 2019 available online here.
Original source: Bain & Co.
Image source: FranckinJapan, “bag-luxury-accessories-japan-ginza-2060110,” Pixabay, February 13, 2017 available online here. Use of image does not constitute an endorsement.

Recycling

America Recycles Day was started in 1997 by the National Recycling Coalition. Since 2009, it has been a national initiative of Keep America Beautiful. Events are held around the country to educate people about recycling not only for its positive effects on our environment but also for its importance to our economy. According to Brenda Pulley, senior vice president, recycling, of Keep America Beautiful, “America Recycles Day helps to shine a light on our ongoing efforts to educate and inspire people to reduce, reuse and recycle, and when they buy, to buy products made from sustainable and recycled materials.”

On November 13, 2015, President Barack Obama issued a Presidential Proclamation declaring November 15 America Recycles Day:

Every American has a role to play in preserving our planet for future generations. Being good stewards of our environment and protecting our natural resources are imperative tasks for ensuring our children and grandchildren live in a clean and sustainable world, and recycling is a pivotal way each of us can do our part. Today, we acknowledge the importance of reusing materials and reducing consumption, and we recognize that a recycling bin may often be a better alternative to a garbage can.

Each year, as much energy is saved recycling and composting as is consumed by 10 million American households. …

Recycling is one way all people can join in the effort of maintaining a sustainable society. Reusing goods and reducing consumption, in addition to donating old or unwanted materials, can have significant impacts on the earth, as well. …

Communities across America must continue promoting activities that encourage people to recycle and to conserve so we do not take for granted today the world our children will inherit tomorrow. We owe it to them to leave behind a stable, secure planet, and that begins with preserving the natural blessings of our Nation. On this day, let us work to fulfill our obligation to our next generation by safeguarding our resources and working with our friends, family, and neighbors to protect the world we share.

On this America Recycles Day we’re recycling our blog post from July 21, 2017, titled Recyclable Materials:

Recycling is beneficial for the environment. It keeps materials out of landfills and helps to reduce the need for harvesting materials from the natural environment. When cities first started recycling programs the assumption was that the cost of the collection and sorting of the materials would be covered by the proceeds of the sale of those materials. In recent years this has not been the case. The value of some materials has dropped dramatically while the cost of recovering them has risen.

Reclaimed paper, a once valuable commodity that was in high demand by the newspaper industry, is one of these materials. As print newspaper circulation dropped dramatically, so did the need for reclaimed paper. Reclaimed plastics is another of these materials. As oil prices remain low, it’s less expensive for manufacturers to make products from new plastic than it is for them to use reclaimed plastic. Since much of the reclaimed materials in the United States are sent overseas, recent legislative action by some countries limiting the amount of imported reclaimed materials has also negatively affected the market making it more difficult to sell such materials.

Today’s market size is the value of a ton of mixed recyclable material for 2011, 2015 and an estimated value for 2017.

Geographic reference: United States
Year: 2011, 2015 and 2017
Market size: $180, $80, and just shy of $100 per ton of mixed recyclable material respectively.
Sources: Paul Singer, “Recycling Market in a Heap of Trouble,” USA Today for the Lansing State Journal, April 21, 2017, page B1; Obama, Barack, “Presidential Proclamation — America Recycles Day, 2015,” The White House, Office of the Press Secretary, November 13, 2015 available online here; Pulley, Brenda, “America Recycles Day Marks 20th Anniversary, Focuses Nation’s Attention on Recycling Every Day,” Keep America Beautiful Press Release, November 2, 2017 available online here; “America Recycles Day,” National Day Calendar available online here.
Image source: 9355, “recycle-reuse-recycling-recyclable-57136,” Pixabay, September 20, 2012 available online here.

Thrifting

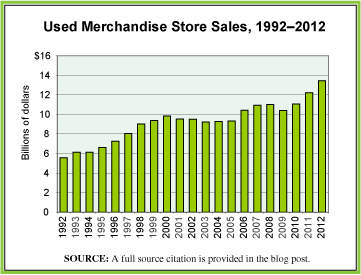
Several decades ago thrifting—shopping at used merchandise stores—was associated with poverty. More recently while some continue to shop at used merchandise stores to save money, many see thrifting as a lifestyle choice, a way to find inexpensive, unique pieces for their wardrobe or to find pieces to repurpose for do-it-yourself projects. The younger generation, especially, has embraced thrifting. Perhaps as a reflection of that, the 2012 Macklemore song “Thrift Shop” became a hit. The official music video on YouTube, as of May 2017, had more than 1 billion views and more than 5 million likes.

The total revenue of used merchandise stores in the United States is today’s market size.

Geographic reference: United States
Year: 2017
Market size: $17 billion
Source: Princess Gabbara, “How Thrifting Became Chic,” Lansing State Journal, May 7, 2017, pages 1D, 5D; Ryan Lewis, “Macklemore & Ryan Lewis – Thrift Shop Feat. Wanz (Official Video),” YouTube, August 29, 2012 available online here.
Original source: Dun & Bradstreet
Image source: PublicDomainPictures, “second-hand-sign-thrift-shop-20113,” Pixabay, March 1, 2012 available online here.

Recyclable Materials

Recycling is beneficial for the environment. It keeps materials out of landfills and helps to reduce the need for harvesting materials from the natural environment. When cities first started recycling programs the assumption was that the cost of the collection and sorting of the materials would be covered by the proceeds of the sale of those materials. In recent years this has not been the case. The value of some materials has dropped dramatically while the cost of recovering them has risen.

Reclaimed paper, a once valuable commodity that was in high demand by the newspaper industry, is one of these materials. As print newspaper circulation dropped dramatically, so did the need for reclaimed paper. Reclaimed plastics is another of these materials. As oil prices remain low, it’s less expensive for manufacturers to make products from new plastic than it is for them to use reclaimed plastic. Since much of the reclaimed materials in the United States are sent overseas, recent legislative action by some countries limiting the amount of imported reclaimed materials has also negatively affected the market making it more difficult to sell such materials.

Today’s market size is the value of a ton of mixed recyclable material for 2011, 2015 and an estimated value for 2017.

Geographic reference: United States
Year: 2011, 2015 and 2017
Market size: $180, $80, and just shy of $100 per ton of mixed recyclable material respectively.
Source: Paul Singer, “Recycling Market in a Heap of Trouble,” USA Today for the Lansing State Journal, April 21, 2017, page B1.

Used Merchandise

UsedMerchStores

Whether it be the post-recession, budget-conscious consumers or eco-friendly consumers who’d rather reuse than buy new, more and more people are buying used merchandise. In a July 2013 survey by America’s Research Group, nearly 20% of adults surveyed said they shopped at a secondhand store in the past year. According to the Association of Resale Professionals, there are an estimated 25,000 used merchandise stores in the United States, which includes thrift, resale, and consignment shops. This number is projected to increase by 7% annually.

The graphic shows U.S. sales made through used merchandise stores from 1992 through 2012. What is worth noting is the fact that, as is true for all categories of products, used merchandise is sold online as well as through retail outlets. The sales figures presented in the graphic do not include online sales of used merchandise, think eBay… We suspect that if those sales were added to the sales made through retail outlets, the significance of a shift towards used would be even more striking.

Today’s market size is the sales volume of used merchandise stores in the United States 2002 and 2012.

Geographic reference: United States
Year: 2002 and 2012
Market size: $9.5 and $13.4 billion respectively
Source: Lindsay VanHulle, “As Recession Alters Shopper Attitudes, Secondhand Shops Thrive,” Lansing State Journal, August 25, 2013, pages 1E, 3E. The graphic was made with data from the U.S. Census Bureau’s series of reports on the retail trade sector, specifically: “Estimated Annual Sales of U.S. Retail and Food Services Firms by Kind of Business: 1992 Through 2011,” released March 29, 2013 and available here.
Original source: First Research and the U.S. Bureau of the Census
Posted on August 28, 2013