Bookmobiles

Bookmobiles GraphBookmobiles, mobile libraries in vans, trucks or other large vehicles, reach underserved populations in the community. In many parts of the country, especially in rural, remote areas, people live too far from a library branch to take advantage of its services. In poor neighborhoods, children may not have access to the public library. Their parents may not have time to take them to the library after a long day’s work or may not make reading at home a priority. Seniors in assisted living facilities and nursing homes are two other groups served by bookmobiles. Besides providing books and movies, bookmobiles also provide high-speed internet access to people who may not have access otherwise.

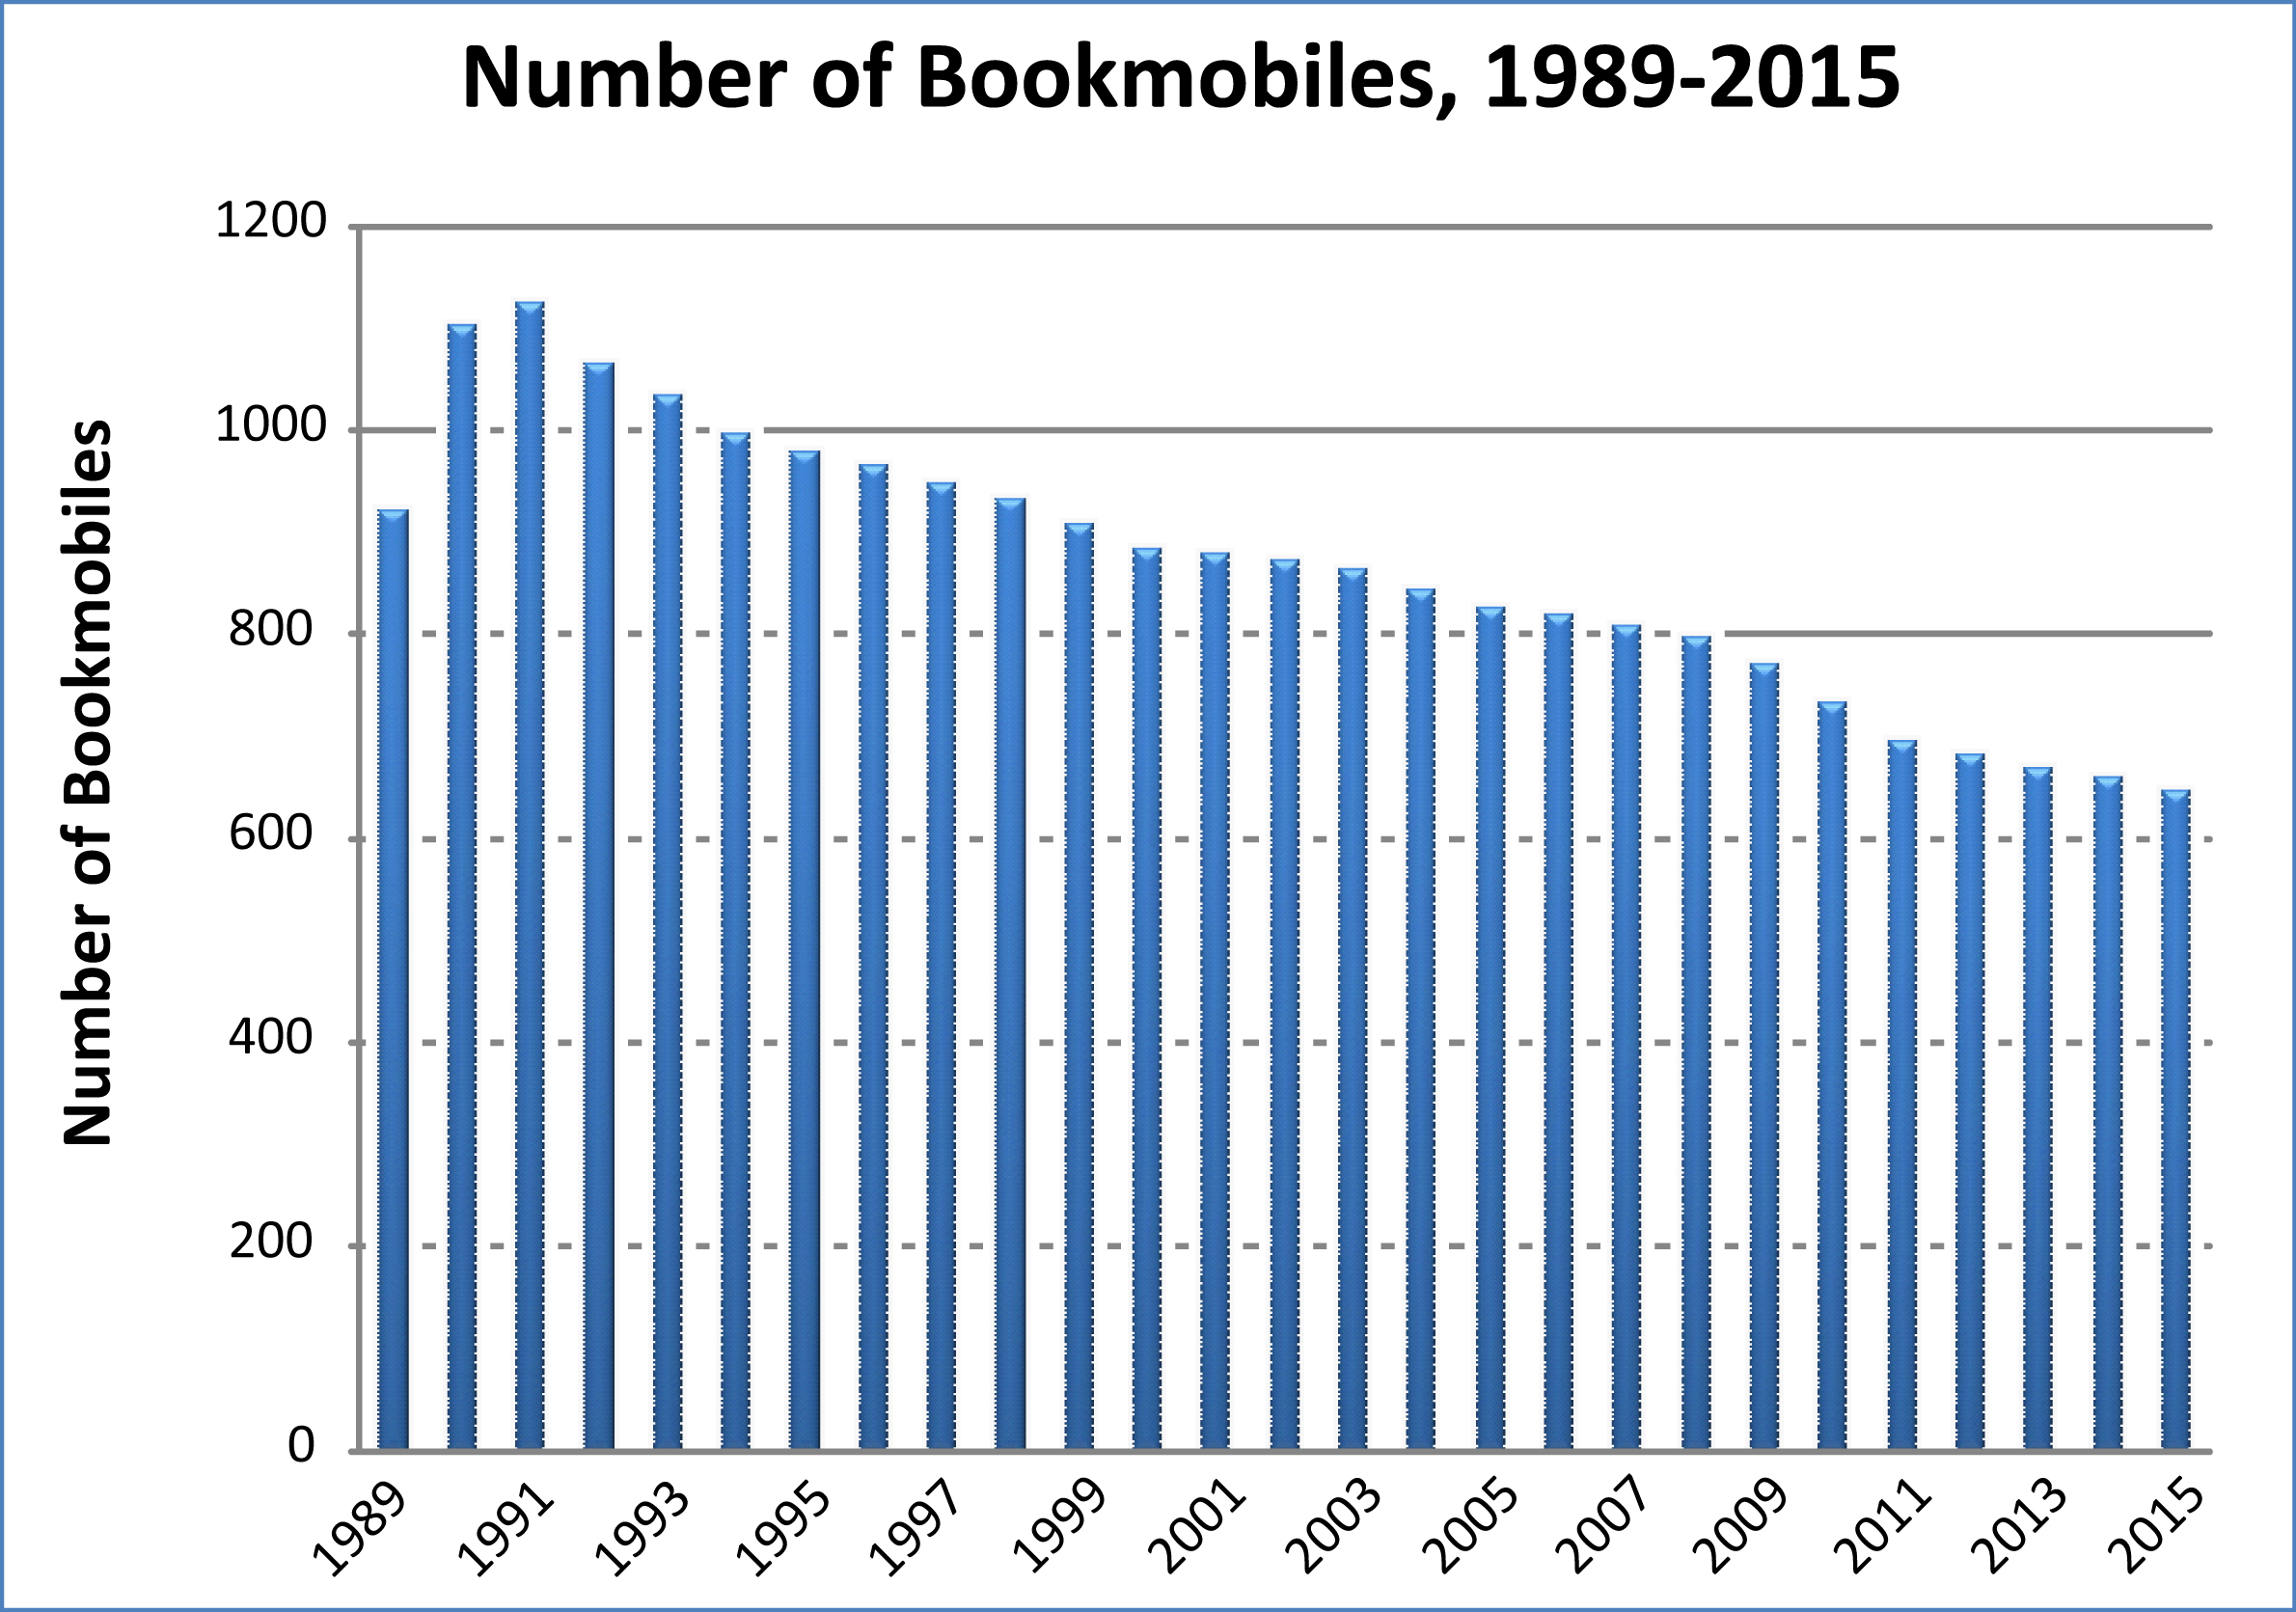
Today’s market size shows the number of bookmobiles in the United States in 1990 and 2015. As the graph above shows (click the graph to see more detail), the number of bookmobiles across the country has been on a steady decline since 1991. When library funding is cut or does not keep up with increasing expenses, many times bookmobiles are one of the first services to go. But some libraries see the advantages in having bookmobiles when budgets are tight. Bookmobiles provide outreach to the community, a “way to reach more patrons and prove their worth … as people become more accustomed to having goods and services delivered to their doors.”1 Some counties in Washington, Oklahoma, New York, Lousiana, and Virginia have added more than one bookmobile in the past decade.

1 Jen Fifield, “Yes, Bookmobiles Are Still a Thing,” The Pew Charitable Trusts, March 28, 2018

Geographic reference: United States
Year: 1990 and 2015
Market size: 1,102 and 647
Sources: “Bookmobiles in the U.S.,” American Library Association available online here; “Table 3. Number of Public Libraries with Branches and Bookmobiles, and Number of Service Outlets, by Type of Outlet and State: Fiscal Year 2015,” Supplementary Tables: Public Libraries Survey Fiscal Year 2015, Insititute of Museum and Library Services, September 2017 available online here; and Jen Fifield, “Yes, Bookmobiles Are Still a Thing. (We Checked),” Stateline, The Pew Charitable Trusts, March 28, 2018 available online here.
Image source: Created in-house using data from the American Library Association and the Institute of Museum and Library Services. Click on the image to see more detail.

Homeless Courts

law court gavelAccording to the U.S. Department of Housing and Urban Development report, The 2017 Annual Homeless Assessment Report (AHAR) to Congress, nearly 554,000 people were homeless in the United States in 2017. While most were able to stay in emergency shelters or transitional housing more than 192,000 had no shelter to go to.

The homeless often receive citations for panhandling and other public nuisance violations or are arrested for misdemeanor violations such as petty theft. Some homeless people may not appear in court because they don’t have the means to get there or their need to find food and shelter outweigh all other concerns. Others choose not to appear in court, either because of hygiene concerns, not wanting to make a bad first impression; an inability to defend themselves in court; or a fear of being taken into custody. Even if they do appear in court, they may be required to pay fines they cannot afford. As a consequence of these unresolved legal issues, they may be prevented from accessing services such as employment assistance, housing, counseling, substance abuse treatment and public assistance.

In 1989, San Diego, California established the first Homeless Court Program in the country in order to help homeless defendants get the help they need to become productive members of society. Open only to defendants accused of misdemeanor violations, instead of fines and custody the defendant is ordered to participate in activities as part of a plan designed by the defendant and a shelter caseworker in order to provide the education, training, counseling, substance abuse treatment, and employment assistance needed so the defendant can become self-sufficient. As of January 2018, there were Homeless Court Programs in several jurisdictions in Arizona, California, Colorado, Michigan, Missouri, New Mexico, South Carolina, Texas, Utah, and Washington.

Today’s market size is the number of jurisdictions with Homeless Court Programs in the United States according to the American Bar Association (ABA). Although Detroit, Michigan is not mentioned on the ABA website, the Street Outreach Court Detroit (SOCD), modeled after the Ann Arbor Street Outreach Court, became the 23rd homeless court in the United States in June 2012 according to Street Democracy’s website. SOCD may be “the only court that combines criminal and civil pro bono counsel to address legal matters outside the court’s jurisdiction and tracks the long-term success rate of program participants.”1 “Six months after graduating from the program, 97 percent of participants had stable housing, 91 percent had stable income, and 100 percent had no new misdemeanor or felony charges.”2

1 “The Story of SOCD,” Street Democracy available online here.
2 Annessa Morley, “A Positive Ripple Effect,” Wayne State, Fall 2017, page 31 available online here.

Geographic reference: United States
Year: 2018
Market size: 32
Sources: “Homeless Courts,” American Bar Association, 2018 available online here; Annessa Morley, “A Positive Ripple Effect,” Wayne State, Fall 2017, pages 28-31 available online here; Meghan Henry, et. al., The 2017 Annual Homeless Assessment Report (AHAR) to Congress, December 2017 available online here; “The Story of SOCD,” Street Democracy available online here.
Image source: Activedia, “law-justice-court-judge-legal-1063249,” Pixabay, November 26, 2015 available online here.

Public Transportation in the Lansing, Michigan Area

The Capital Area Transit Authority (CATA) is the largest public transit provider in the tri-county area around Lansing, Michigan. The tri-county area consists of Ingham, Clinton, and Eaton counties. CATA has been operating public transportation in the mid-Michigan area since 1972 and has been twice named the best transit system of its size in North America by the American Public Transportation Association.

Ridership grew steadily during the 1970s, before leveling off during the 1980s and most of the 1990s. During the 1980s and 1990s, the number of rides fluctuated around 3-4 million annually. In 1999, CATA took over the Michigan State University bus service. Since then ridership has increased nearly 3-fold. In contrast, the population of the tri-county area grew by 22.6% from 1970 to 2010.

In 2013, CATA set a fourth consecutive yearly record for number of rides. By 2014, however, ridership was down overall despite seeing increased ridership on its Michigan State University routes and increased requests for its paratransit services. In the fourth quarter of 2014, gasoline prices fell which could account for the decreased ridership. Gasoline prices remained low in 2015. Nationally, according to the American Public Transportation Association, total passenger trips declined by 3.5 percent from October 2015 to December 2015. CATA reported a 1 percent decline in ridership in 2015 relative to the close of 2014.

Today’s market size represents the number of rides annually on CATA vehicles in 1972 and 2015.

Geographic reference: Lansing, Michigan area
Year: 1972 and 2015
Market size: Less than 1 million rides and 11.43 million rides respectively
Sources: “National Trend Leaves Its Mark on Ridership,” CATA 2016 Community Report, June 2016, page 3; “Ridership Trends Vary by Service Type”, CATA 2015 Community Report: Where Public Transportation Goes Community Grows, June 2015, page 3; “Passenger Trips Reflect Stable Demand”, CATA 2014 Community Report: Moving You Forward With Pride, June 2014, page 3; “Growth in Ridership Remains Strong”, CATA 2013 Community Report: Moving You Toward Your Dreams, June 2013, page 4; “Riding High with Record Ridership,” CATA 2012 Community Report 40th Anniversary Edition: Greater Lansing on the Move, August 2012; “CATA Demand Grows with Community Need,” CATA 2011 Community Report: Greater Lansing on the Move, August 2011; Tri-County Regional Planning Commission, “Tri-County Regional Growth: Choices for Our Future,” Draft Report, August 2002 available online here; “Ingham County, Michigan” available online here; “Clinton County, Michigan” available online here; and “Eaton County, Michigan” available online here.

Training Doctors

The education and training of a doctor is a long and costly endeavor. First comes the classroom education, the cost of which is picked up, for the most part for those not fortunate enough to get a scholarship, by the future doctor him or herself. Then comes a final on-the-job training period in which doctors with new diplomas spend four or more years working in a residency program.

During this residency, doctors in training see and treat patients under the supervision of more seasoned physicians. Most of these residency programs are carried out in teaching hospitals, which account for approximately 20% of the nation’s hospitals. Residency programs are arduous. Residents are expected to routinely work 80 hours a week and they are paid half or far less of what they will receive for much the same work after the residency. This training is expensive for the system as a whole and has been, for all practical purposes, nationalized.

The U.S. federal government pays for most of this training with money from the Medicare and Medicaid systems. Our market size today is the money spent by the federal government annually to support this graduate medical education.

Geographic reference: United States
Year: 2012
Market size: $11.5 billion of U.S. government funds are used to support residency slots in training hospitals, approximately 115,000 in 2012
Source: Catherine Dower, “Graduate Medical Education,” a health policy brief published in Health Affairs, on August 31, 2012 and available online here.
Original source: U.S. Department of Health and Human Services, Center for Medicare and Medicaid Services
Posted on January 22, 2014

Charter Schools

The National Education Association defines charter schools as follows: “Charter schools are publicly funded elementary or secondary schools that have been freed from some of the rules, regulations, and statutes that apply to other public schools, in exchange for some type of accountability for producing certain results, which are set forth in each charter school’s charter.” The first charter school was established in Minnesota in 1991 as a part of ongoing educational reform efforts and more specifically, an expansion of market-based school reform. Proponents of charter schools claim that they bring much needed entrepreneurial spirit and a competitive ethos to public education. Opponents claim that to outsource the running of public schools to private entities is to redirect already scarce resources to service fees and profits while creating new layers of administration.

Since the first charter school was established in Minnesota, 40 additional states have passed legislation permitting the formation of charter schools and the number of such schools has grown with each passing year. The formation of Education Management Organizations (EMOs), both nonprofit and for-profit, has been one result of the legislation enabling charter schools. Some EMOs are now quite large, managing dozens of schools while others manage a single school. The diversity of this category of management companies is quite extreme. While not all charter schools are operated by EMOs, in the academic year 2011-12 such EMOs accounted for approximately 39% of all charter schools and 50% of all students enrolled in charter schools. And of the nearly one million students enrolled in EMO-run schools that year, 51% were enrolled in for-profit EMOs.

Today’s market size is the total number of charter schools operating in the United States in the academic years beginning in 2000 and 2010. While charter schools still make up a very small percentage of all public schools in the country (5.3%), it is an area that some people feel holds great promise for further privatization of government services.

Geographic reference: United States
Year: School year starting in the fall of 2000 and 2010
Market size: 1,993 and 5,274 respectively
Sources: (1) “Charter Schools,” a fact sheet on the National Education Association web site from which we quote the definition of these schools, available online here. (2) Gary Miron and Charisse Gulosino, Profiles of For-Profit and Nonprofit Education Management Organizations, November 2013, National Education Policy Center, available online here. (3) Tables 71, 98, and 161 from chapter two of the Digest of Education Statistics: 2012, published by the NCES in 2013 and available online here.
Original source: U.S. Department of Education, National Center for Education Statistics (NCES); National Education Policy Center, Commercialism in Education Research Unit (CERU)
Posted on January 8, 2014

Roundabouts

Roundabout

Roundabouts are a road design used to replace a traditional four or six-way intersection, referred to as a crossroads intersection, with a circular path around which traffic flows, continuously, in one direction. The graphic provides an overview of such a roundabout.

For a driver not accustomed to this sort of intersection, a roundabout may be disconcerting at first. However, study after study shows that in the right locations roundabouts are an improvement over more traditional crossroad intersections in two ways: by increasing the flow of traffic and by reducing (by 76%) the number of injury-producing accidents. The reduction in accidents leading to fatalities in a roundabout versus a crossroad intersection is even greater since speeds are reduced throughout the intersection. According to the U.S. Department of Transportation, there are 90% fewer fatal accidents in crossroads intersections that have been replaced by roundabouts.

Today’s market size is the estimated number of roundabout intersections worldwide, in 1997 and in 2012.

Geographic reference: World
Year: 1997 and 2012
Market size: 35,000 and 60,000 respectively
Source: “The Widening Gyre,” The Economist, October 5, 2013, page 16. The graphic comes from a Michigan Department of Transportation website, here.
Original source: U.S. Department of Transportation
Posted on November 25, 2013

Methamphetamine Laboratory Cleanup

MethLabs

The societal costs of the methamphetamine—crystal meth or simply meth for short—drug business, if we can call the trade in this illegal drug a business, is very difficult to calculate. It negatively impacts the health and welfare of the participants and the communities in which it is most active. These tend to be rural communities located in the mid-section of the country. The states fighting the largest battles with the meth trade are Missouri, Tennessee, Indiana and Kentucky.

The graph shows the number of methamphetamine laboratory incidents reported by the Drug Enforcement Administration (DEA) over the period 2004–2012. An incident is any seizure of a meth lab, a dump site or stashes of chemical and glassware. The graph also shows the quantity of methamphetamine seized by the DEA over this period.

There is one cost associated with the meth trade, of so many costs to society, that has been a stimulus to a legal business activity. That is the cost of cleaning up clandestine laboratories in which this drug is produced, or cooked in the vernacular of this trade. The methods used to make this drug also produce a lot of hazardous fumes and byproducts. Therefore, meth labs must be handled carefully and then thoroughly cleaned up after a seizure. The cost of such cleanups depends greatly on the size of the facility but it can run anywhere from $1,000 per site to $25,000 per site or even more in some extreme cases. Specially certified waste management firms and environmental consulting firms are contracted to carry out this cleanup work.

Today’s market size is the estimated amount spent in the United States cleaning up meth labs in 2012. Worth noting is the fact that this money was concentrated in the ten states in which most meth trade occurs. Together these ten states represent 82.4% of all meth lab incidents. For more details on which states have the highest level of meth activity, go to the DOJ website listed as the third source below.

Geographic reference: United States
Year: 2012
Market size: $29 million
Sources: (1) Jonah Engle, “Merchants of Meth,” Mother Jones, July/August 2013, page 33. (2) “DEA Domestic Drug Seizures,” part of a U.S. Department of Justice web site available online here. (3) “Methamphetamine Lab Incidents, 2004–2012,” another DOJ offering on its website here.
Original source: U.S. Department of Justice
Posted on November 22, 2013

Libraries

Anyone who is truly interested in knowledge will be a friend of the library. Even in an age which defines itself as the “information age,” libraries play an essential role in society. In fact, based on U.S. library usage data from this century, that role is growing.

Today’s market size is the estimated total number of libraries in the United States. The largest category of library is the school library, which accounts for slightly over 80% of all libraries and does not include the academic library which is associated with higher education. The second largest category of library is the public library with a 7.5% share of the total.

Geographic reference: United States
Year: 2010
Market size: 119,987
Source: “Number of Libraries in the United States — ALA Library Fact Sheet 1,” American Library Association, August 2013, available online here.
Original source: The ALA web site provides a long list of sources upon which the organization drew in order to reach the total count.
Posted on September 23, 2013

Public Transportation—Lansing, Michigan Area

The Capital Area Transit Authority (CATA), in Lansing, Michigan, is the largest public transit provider in the tri-county area near the State Capitol, which includes Ingham, Clinton, and Eaton counties. CATA has been operating public transportation in the mid-Michigan area since 1972 and has been twice named the best transit system of its size in North America by the American Public Transportation Association.

Ridership grew steadily during the 1970s, before leveling off during the 1980s and most of the 1990s. During the 1980s and 1990s, the number of rides fluctuated around 3 to 4 million annually. In 1999, CATA took over the Michigan State University bus service. Since then ridership has increased nearly 3-fold. In contrast, the population of the tri-county area grew by 22.6% from 1970 to 2010. In 2012, CATA set a third consecutive yearly record for number of rides. Data represent the number of rides annually on CATA vehicles in 1972 and 2012.

Geographic reference: Lansing, Michigan
Year: 1972 and 2012
Market size: Fewer than 1 million rides and 11.86 million rides respectively
Sources: “Growth in Ridership Remains Strong”, CATA 2013 Community Report: Moving You Toward Your Dreams, June 2013, p. 4; “Riding High with Record Ridership,” CATA 2012 Community Report 40th Anniversary Edition: Greater Lansing on the Move, August 2012; “CATA Demand Grows with Community Need,” CATA 2011 Community Report: Greater Lansing on the Move, August 2011; Tri-County Regional Planning Commission, “Tri-County Regional Growth: Choices for Our Future,” Draft Report, August 2002 available online here; “Ingham County, Michigan” available online here; “Clinton County, Michigan” available online here; and “Eaton County, Michigan” available online here;
Posted on June 26, 2013