Brain Health Supplements

Geographic reference: World
Year: 2020 and 2028
Market size: $7.21 billion and $13.38 billion, respectively

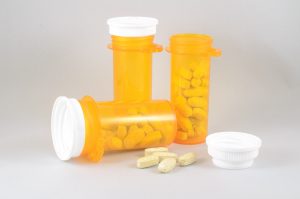
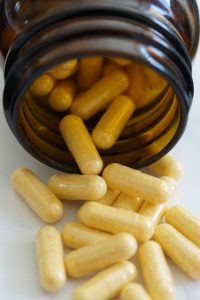
AARP’s 2019 Brain Health and Dietary Supplements Survey found that more than 25% of Americans aged 50 and over regularly take brain health supplements. As the population ages, the incidence of Alzheimer’s disease and other forms of dementia increases. As of 2020, about 5.8 million people in the United States had Alzheimer’s; 50 million worldwide had some form of dementia.1 The World Health Organization (WHO) estimates that there are 10 million new cases of dementia yearly — one case diagnosed every 3 seconds worldwide. The fear of loss of brain function due to aging is contributing to the adoption of brain health supplements among older adults.

The increasing awareness of mental health issues among adolescents and millennials is fueling the demand for brain health supplements among these age groups. These consumers seek treatment for depression, stress, and anxiety, all common conditions among younger people. The COVID-19 pandemic increased the occurrence of these conditions and in turn increased the demand for brain health supplements to treat them. 

Overall, by application, memory enhancement garnered the largest revenue share in 2020, more than 25%. This was followed by attention and focus, depression and mood, sleep and recovery, anti-aging and longevity, and stress and anxiety. The depression and mood segment is expected to see the fastest growth through 2028 due to the increasing rate of depression among millennials and the growing awareness of mental health and depression in countries such as India and Indonesia. According to the WHO, more than 264 million people worldwide suffer from depression.

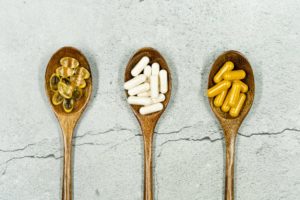
Natural molecules accounted for more than half the market in 2020, likely due to their cost-effectiveness and ready availability. Omega-3 fatty acids, Huperzine-A and Acetyl-L-carnitine, for example, are used to improve focus and to treat depression, stress, and anxiety. Docosahexaenoic acid (DHA), eicosapentaenoic (EPA), and Alpha-linolenic acid (ALA) are three major omega-3 fatty acids used to treat depression and cognitive impairment, including Alzheimer’s disease. 

Revenues for herbal extract products are expected to grow at the fastest rate through 2028 as interest in herbal supplements rises in such countries as the United Kingdom and the United States. Demand for ginkgo biloba, ginseng, lion’s mane, curcumin, echinacea, and bacopa monieri has been increasing in recent years. The vitamins and minerals segment has the smallest market share. 

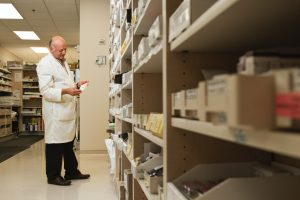
A large number of global and regional manufacturers have a presence in the industry. These companies have been using a combination of new product launches, innovation, mergers and acquisitions, and capacity expansion to increase their shares of the market. Some of the larger manufacturers include Teva Pharmaceutical Industries Ltd., HVMN Inc., Purelife Bioscience Co. Ltd., Peak Nootropics, AlternaScript, Liquid Health Inc., Natural Factors Nutritional Products Ltd., Reckitt Benckiser Group PLC, Onnit Labs Inc., and Quincy Bioscience. Leading brands include The Genius Brand, Bulletproof, Onnit Labs, Vital Vitamins, Prevagen, and Neuriva. Of the 348 brands sold on Amazon, only 18 brands garnered above a 1% share in 2020. The top 18 brands represented 56% of the market, with the other 330 accounting for the remaining 44%.

1 Figure for the United States is from the Alzheimer’s Association. Worldwide figure is from the World Health Organization.

Sources: “Global Brain Health Supplements Market Size, Share & Trends Analysis Report by Product (Natural Molecules, Herbal Extract), by Application (Memory Enhancement, Depression & Mood), by Region, and Segment Forecasts, 2021-2028,” Research and Markets Report Description, January 2021 available online here; “Brain Health Supplements Market Size, Share & Trends Analysis Report by Product (Natural Molecules, Herbal Extract), by Application (Memory Enhancement, Depression & Mood), by Region, and Segment Forecasts, 2021 – 2028,” Grand View Research Report Overview, January 2021 available online here; “Global Brain Health Supplements Market Size, Share & Trends Analysis Report 2021 – ResearchAndMarkets.com,” Business Wire, September 9, 2021 available online here; Sinan Atac, “Nootropic Supplement Sales on Amazon,” Natural Products Insider, April 2021, pp. 39-40 available online here.
Image source: formulateHealth, “Health_Supplements_-_Nutraceuticals_-_50191152323.jpg,” Wikimedia Commons, CC BY 2.0, July 30, 2020 available online here.

Metabolomics

laboratory metabolomics
Metabolomics is the comprehensive analysis of metabolites in a biological specimen.
Geographic reference: World
Year: 2020 and 2025
Market size: $1.9 billion and $4.1 billion, respectively

Metabolomics is the “comprehensive analysis of metabolites in biological specimens.”1 Metabolites are substances made when the body breaks down food, drugs, chemicals, or tissue (fat or muscle tissue, for example). These substances create energy and are needed for growth, reproduction, ridding the body of toxic substances, and maintaining health. The process for creating these substances is called metabolism. More than 9,400 metabolites have been detected by scientists to date, according to the Human Metabolome Database, but scientists believe that the human metabolome consists of more than a million compounds. Metabolomics is a relatively new field of study, only coming into existence in the late 1990s.

Scientists use metabolomics to research possible therapies for a variety of illnesses such as cancer, cardiovascular disorders, neurological disorders, and metabolic disorders. The increasing number of people with cancer and higher demand for cancer treatments account for the cancer segment having the largest market share in 2020. This segment of the industry is also expected to have the fastest growing revenues through 2025.

Today’s market size shows the total global revenues for the metabolomics market in 2020 and projected for 2025. Increasing research and development investment in the pharmaceutical and biopharmaceutical segment of the economy, especially at academic and research institutions, along with growing demand for personalized medicine will contribute to growth in this industry. The high costs of instruments and problems with data examination and processing, however, are likely to stifle some growth.2 Even so, the metabolomics instrument market accounted for the largest market share in 2020 as technological advancements, an increasing number of research-related activities, and the shoring up of healthcare infrastructure in developing countries contributed to demand.

Thanks to technological advances, the metabolomics industry has been instrumental in biomarker discovery. Biomarkers are measurable substances in bodily fluids or tissue, the presence of which can be indicative of disease, infection, or environmental exposure. A biomarker can be used to test how well the body responds to treatments for a disease. As an example of biomarker research, George Washington University researchers are studying 5 biomarkers in the blood of those with COVID-19 to see if there is a correlation between having certain biomarkers and the severity of the disease. If there is a correlation, this could lead to a blood test to determine which patients will have a more severe form of the disease and will need to be monitored and/or hospitalized and which can be sent home for quarantining and bed rest.

By region, North America had the highest share of the market in 2020. Thirteen of the top 20 major corporations in the industry are located in the United States. These include Waters Corp., Agilent Technologies, Thermo Fisher Scientific, Danaher Corp., Bruker Corp., PerkinElmer, GE Healthcare, LECO Corp., Metabolon, Inc., Bio-Rad Laboratories, Scion Instruments, SRI Instruments, and JASCO Inc. Other major companies in this industry located elsewhere include Merck KGaA (Germany), Hitachi High Technologies Corp. (Japan), Human Metabolome Technologies Inc. (Japan), DANI Instruments S.p.A. (Italy), GL Sciences (Japan), and Kore Technologies Ltd. (United Kingdom). Revenues in the Asia-Pacific region are expected to grow the fastest through 2025. Several pharmaceutical companies have moved their research, development, and manufacturing operations to the region — especially to India and China where there are large numbers of qualified researchers — to tap into the growing market and to lower the costs of production.

1 Clary B. Clish, “Metabolomics: An Emerging but Powerful Tool for Precision Medicine,” Cold Spring Harbor Molecular Case Studies, October 2015 available online here.
2 Unlike other omics where comprehensive data can be gathered using a single analytic platform, metabolomics relies on a combination of analytical platforms, each with its own advantages and disadvantages. As a result, laboratories have to have a variety of instruments available, each potentially costing in the hundreds of thousands of dollars. In addition, universal procedures for sample preparation, analysis, and interpretation of results are currently few or nonexistent.

Sources: “Metabolomics Market by Product, Application, Indication, End User – Global Forecast to 2025,” ReportLinker Summary, December 2020 available online here; Clary B. Clish, “Metabolomics: An Emerging but Powerful Tool for Precision Medicine,” Cold Spring Harbor Molecular Case Studies, October 2015 available online here; Farhana R. Pinu, et. al., “Translational Metabolomics: Current Challenges and Future Opportunities,” Metabolites, June 2019 available online here; “The Global Metabolomics Market Size is Projected to Reach USD 4.1 Billion by 2025 from USD 1.9 Billion in 2020, at a CAGR of 13.4%,” GlobeNewswire, December 24, 2020 available online here; David S. Wishart, “Metabolomics for Investigating Physiological and Pathophysiological Processes,” Physiological Reviews, August 21, 2019 available online here; “The Human Metabolome Database,” The Metabolomics Innovation Centre available online here; “Blood Test May Point to Patients at Higher Risk for COVID-19 Deterioration, Death,” George Washington School of Medicine and Health Sciences Press Release, August 5, 2020 available online here; Max Roser and Hannah Ritchie, “Cancer,” Our World in Data, July 2015, Revised November 2019 available online here; “Metabolite,” NCI Dictionary of Cancer Terms available online here; “Biomarker,” NCI Dictionary of Cancer Terms available online here.
Image source: Belova59, “laboratory-medical-medicine-hand-3827745,” PIxabay, November 25, 2018 available online here.

Pharmaceutical Packaging

bottles, pharmaceutical packaging
Plastic bottles had the highest revenue share in the primary packaging segment of the market.
Geographic reference: World
Year: 2019 and 2027
Market size: $98.58 billion and $188.79 billion, respectively

Today’s market size shows the total global revenues for pharmaceutical packaging in 2019 and projected for 2027 according to a report by Grand View Research. Demand for pharmaceutical packaging is expected to rise based on many factors: a growing pharmaceutical industry in China, India, and Brazil; rising demand for over-the-counter drugs; new drug discoveries; increased access to medicines as healthcare infrastructure improves in developing countries; an aging population; and a rise in the number of people with chronic diseases. 

Growth is also expected as demand rises for more convenient packaging types, such as pre-filled syringes and autoinjectors, and for sustainable packaging made of biodegradable and recycled materials. The growing use of biologics to treat illnesses will increase demand for specialized packaging. Biologics are manufactured using animal, human, or plant cells which tend to be heat sensitive and prone to contamination.

Increasing regulations and anti-counterfeit measures such as the Drug Supply Chain Security Act in the United States and the European Union’s Falsified Medicine Derivative have increased packaging costs as new infrastructure has to be developed to meet the requirements outlined in the laws.1 As costs go up, more pharmaceutical companies are outsourcing their packaging needs. Pharmaceutical contract packaging revenues totaled $28.2 billion in 2019 or 28.6% of the overall global pharmaceutical packaging market. This is expected to increase to $47.7 billion in 2027. Many small pharmaceutical companies without packaging capabilities have maintained relationships with contract packaging organizations and contract development and manufacturing organizations all along.

Primary packaging, the packaging that comes in direct contact with the product itself, held the highest revenue share in 2019, 75.16%, with plastic bottles having the highest share within this category. Oral drug delivery packaging and injectable packaging together accounted for more than three-quarters of all pharmaceutical packaging revenue. By end-use, most revenues came from pharmaceutical manufacturers, then retail pharmacies, contract packaging, institutional pharmacies, and others.

North America had the highest revenue share in 2019, 37.8%. The United States is the largest pharmaceutical market worldwide. It has a large healthcare system, the population has high per capita income, and it invests heavily in new drug development. Also, many large pharmaceutical companies such as Pfizer Inc., Johnson & Johnson, Merck & Co. Inc., Bristol-Myers Squibb Company, and AbbVie Inc. are located there. The Asia-Pacific region is expected to see the highest compound annual growth rate through 2027 with China, India, Japan, and South Korea being the largest markets. Economic growth along with population growth and increasing drug safety regulations are expected to increase product demand. While the global market is fragmented with several regional and local pharmaceutical packaging companies, some major companies in this industry include Amcor PLC; Gerresheimer AG; AptarGroup Inc.; Becton, Dickinson and Company; Schott AG; West Pharmaceutical Services Inc., Berry Global Inc.; WestRock Company; International Paper Company; Comar LLC; CCL Industries Inc.; and Vetter Pharma International.

1 Some product tracing and product identification regulations under the Drug Supply Chain Security Act were waived for certain COVID-19 medications. Source: “FDA Lifts Drug Supply Chain Security Requirements for COVID-19 Products,” Regulatory Focus, Regulatory Affairs Professionals Society, April 30, 2020 available online here.

Sources: “Pharmaceutical Packaging Market Size, Share & Trends Analysis Report by Material (Plastics & Polymers, Paper & Paperboard, Glass), by Product, by End Use, and Segment Forecasts, 2020 – 2027,” Grand View Research Report Summary, February 2020 available online here; “Pharmaceutical Packaging Market Size Worth $188.79 Billion by 2027: Grand View Research, Inc.,” CISION PR Newswire, February 11, 2020 available online here; “Pharmaceutical Contract Packaging Market Size, Share & Trends Analysis Report by Type (Primary, Secondary, Tertiary), by Material (Plastic & Polymer, Glass), by Region, and Segment Forecasts, 2020 – 2027,” Grand View Research Report Summary, August 2020 available online here; “Pharmaceutical Contract Packaging Market Size Worth $47.7 Billion by 2027: Grand View Research, Inc.,” CISION PR Newswire, August 26, 2020 available online here; “Pharmaceutical Packaging Market to Hit USD 142.59 Bn by 2027; Rising Demand for Efficient Packaging of Drugs by Healthcare Facilities to Boost Market Growth: Fortune Business Insights,” CISION PR Newswire, June 2020 available online here; “Pharmaceutical Packaging Market Size, Share & Industry Analysis, by Material (Plastics, Glass, Metal, Paper & Paperboard), by Product (Plastic Bottles, Caps & Closures, Pre-Fillable Inhalers, Vials & Ampoules), by Packaging Type (Primary, Secondary, and Tertiary), by Drug Delivery Mode (Oral Drug Delivery Packaging, Injectable Packaging, Topical Drug Delivery Packaging, Pulmonary Drug Delivery Packaging), and Regional Forecast, 2020-2027,” Fortune Business Insights Report Summary, June 2020 available online here; “Drug Supply Chain Security Act (DSCSA),” U.S. Food and Drug Administration, May 8, 2020 available online here; “Falsified Medicines,” Medicinal Products, European Commission, June 30, 2017 available online here; Michael Mezher, “FDA Lifts Drug Supply Chain Security Requirements for COVID-19 Products,” Regulatory Focus, Regulatory Affairs Professionals Society, April 30, 2020 available online here.
Image source: Bob Williams, “medicine-bottle-medical-health-2520463,” Pixabay, July 19, 2017 available online here.

Clinical Trials

clinical trial laboratory
Geographic reference: World
Year: 2019 and 2027
Market size: $46.8 billion and $69.8 billion, respectively

Clinical trials are carefully designed studies that test the benefits and risks of new medical treatments and devices. Each clinical trial is led by a principal investigator, usually a doctor, along with a team of nurses and researchers. In the United States, once scientists have completed laboratory research and pre-clinical testing and achieved a successful result—work that can involve years of experiments on animal and human cells—the pharmaceutical or device company submits its data to the Food and Drug Administration (FDA) for approval to begin testing on human volunteers.

Before an investigational medication1 can be sold to the public, it must successfully pass through 3 clinical trial phases. Phase I trials last several months and involve small numbers of volunteers, 20 to 100. This study determines the effects of the drug on humans and the side effects as dosages are increased. About 70% of experimental drugs pass this phase of clinical trials.

Phase II trials typically last several months to two years. They test the efficacy of a drug. Several hundred volunteers participate in randomized trials where one group receives the experimental drug and another either receives a standard treatment or a placebo. Often neither the patient nor the researchers know who is receiving the experimental drug. This allows investigators to compare information about relative safety and effectiveness. About 33% of experimental drugs pass these first two phases.

Phase III trials are also randomized, blind studies but involve several hundred to several thousand patients. This stage can last several years and provides the pharmaceutical company and the FDA a more complete picture of the drug’s effectiveness, benefits, and adverse reactions. Between 70% and 90% of drugs that enter Phase III successfully complete this level of testing. Phase III trials garnered a 53% revenue share in 2019, followed by Phase II with a 19.8% share. Phase III trials are the most expensive because they involve a large number of patients and a long treatment period.

After a successful Phase III completion, the pharmaceutical company can request FDA approval to market the product. According to PhRMA, less than 12% of drugs that enter Phase I trials go on to be approved by the FDA. Over the past decade, the average research and development cost to bring a new FDA-approved medication to market was $2.6 billion, the development process taking an average of 10-15 years.

With COVID-19 affecting the lives and livelihoods of millions of people around the world and causing hundreds of thousands of deaths, currently more than 150,000 in the United States alone, President Donald Trump announced Operation Warp Speed on May 15, 2020. This is a public-private initiative to “accelerate the development, manufacturing, and distribution of COVID-19 vaccines, therapeutics, and diagnostics.” One of its goals is to “have substantial quantities of a safe and effective vaccine available for Americans by January 2021,” a mere 7 months in the future, although researchers had been working on a vaccine since January 2020. As of July 30, 2020, there were 42 potential vaccines in various stages of development around the world according to the Regulatory Affairs Professionals Society COVID-19 Vaccine Tracker.2 Earlier in 2020, the World Health Organization announced an international clinical trial launch, called Solidarity, to find effective treatments for this virus. In May 2020, as a part of Solidarity, it announced an international alliance for simultaneously developing a number of vaccines for COVID-19. In addition, regulatory agencies across the globe issued guidelines related to conducting clinical trials during the COVID-19 pandemic, restricting face-to-face interactions and supporting the incorporation of virtual services, including performing decentralized clinical trials in which many trial functions are done remotely and researchers rely on help from the patients, their family members, and other caregivers instead of healthcare professionals.

Today’s market size shows the revenues for clinical trials worldwide in 2019 and projected for 2027. Funding for clinical trials comes from government agencies such as the National Institutes of Health and the Department of Defense in the United States, pharmaceutical and biotechnology companies, medical institutes, and foundations. Predicted revenue growth during this time period will be due to many factors: the increasing prevalence of chronic diseases, the rising number of biologics, the need for personalized medicines and orphan drugs, as well as increasing demand for clinical trials in developing countries. The globalization of clinical trials, increased use of technology to meet stringent regulations, and increased use of contract research organizations by pharmaceutical companies to organize and conduct clinical trials are additional factors contributing to future growth. In 2019, oncology clinical trials accounted for the largest share of revenue, 23.2%, followed by trials for drugs to treat central nervous system conditions, autoimmune diseases/inflammation, and diabetes. As of August 4, 2020, there were more than 347,000 studies registered at ClinicalTrials.gov, located in all 50 states and 216 countries. Recruiting studies totaled 52,249.

The coronavirus pandemic has disrupted clinical trials for a variety of disease treatments. The number of patients enrolled in clinical trials in March 2020 dropped 65% worldwide from a year earlier. Some studies have halted altogether as medical center resources are diverted to treating patients with COVID-19 and biotechnology firms divert resources to develop therapeutics and vaccines to treat and prevent the spread of the virus.

As of May 2020, interventional design studies accounted for 79% of all registered studies, the majority being for drugs and biologics. Expanded access trials, also known as compassionate use trials, are predicted to grow at the fastest rate, a compound annual growth rate (CAGR) of 5.2%, through 2027. These trials are a way for patients with serious diseases to obtain treatment outside of clinical trials when other treatments prove ineffectual. For example, many oncology drugs considered as a part of expanded access trials are administered to patients before getting FDA approval. As of May 2020, there were 20 therapeutics for COVID-19 in Phase II and Phase III expanded access trials.

North America accounted for 51.2% of the market in 2019 and is expected to maintain its majority share due to increasing research and development and adoption of new technologies. The Asia-Pacific region is expected to grow the fastest, at a CAGR of 6.1%. A growing number of biotechnology firms are seeking to recruit patients for their COVID-19 trials in this region due to its large patient pool and fast-track trial procedures.

Some major companies in the clinical trial market include ICON Plc, Wuxi AppTec, PRA Health Sciences, SGS SA, Syneos Health, Eli Lilly and Company, Novo Nordisk A/S, Pfizer, Clinipace, IQVIA, PAREXEL International Corp., Pharmaceutical Product Development LLC, and Charles River Laboratory.

1 We concentrate on investigational medications in the text, but the market size figures include revenue for all types of clinical trials: drug, biologic, behavioral, clinical procedure, and device studies.
2 According to a June 16, 2020 U.S. Department of Health & Human Services press release, there are more than 100 COVID-19 vaccines in development.

Sources: “Clinical Trials Market Size, Share & Trends Analysis Report by Phase (Phase I, Phase II, Phase III, Phase IV), by Study Design (Interventional, Observational, Expanded Access), by Indication, and Segment Forecasts, 2020 – 2027,” Grand View Research Report Summary, May 2020 available online here; “Clinical Trials Market Size Worth $69.8 Billion by 2027 | CAGR: 5.1%: Grand View Research, Inc.,” CISION PR Newswire, February 18, 2020 available online here; “What is Clinical Research?” WCG CenterWatch available online here; “Clinical Trials,” PhRMA available online here; “Trends, Charts, and Maps,” ClinicalTrials.gov, National Institutes of Health, U.S. National Library of Medicine, August 4, 2020 available online here; “The Impact of Industry Sponsored Clinical Trials,” PhRMA available online here; Jeff Craven, “COVID-19 Vaccine Tracker,” Regulatory Focus, Regulatory Affairs Professionals Society, July 30, 2020 available online here; “Trump Administration Announces Framework and Leadership for ‘Operation Warp Speed,'” U.S. Department of Health & Human Services Press Release, May 15, 2020 available online here; “Fact Sheet: Explaining Operation Warp Speed,” U.S. Department of Health & Human Services Press Release, June 16, 2020 available online here; Bryan Hill, Pratik Maroo, Venu Mallarapu, and Vidya Viswanathan, “Reinventing Clinical Trials for a Stay-at-Home World,” Perspectives, June 22, 2020 available online here; Ben Fidler, “A Guide to Clinical Trials Disrupted by the Coronavirus Pandemic,” BioPharma Dive, May 15, 2020 available online here.
Image source: Belova59, “laboratory-medical-medicine-hand-3827745,” Pixabay, November 15, 2018 available online here.

Enzymes

enzymes in laundry detergent
Laundry detergent. Enzymes in laundry detergent allow clothes to be washed in cold water.
Geographic reference: World
Year: 2019 and 2027
Market size: $9.9 billion and $17.2 billion, respectively
Sources: “Enzymes Market Size, Share & Trends Analysis Report by Application (Industrial Enzymes, Specialty Enzymes), by Product (Carbohydrase, Proteases, Lipases), by Source, by Region, and Segment Forecasts, 2020 – 2027,” Grand View Research Report Summary, March 2020 available online here; “Enzymes Market Size Worth $17.2 Billion by 2027 | CAGR 7.1%: Grand View Research, Inc.,” CISION PR Newswire, March 16, 2020 available online here; Sindhu Raveendran, et. al., “Applications of Microbial Enzymes in Food Industry,” Food Technology & Biotechnology, March 2018 available online at the U.S. National Library of Medicine, National Institutes of Health here; JanMaarten van Dijl and Michael Hecker, “Bacillus Subtilis: From Soil Bacterium to Super-secreting Cell Factory,” Microbial Cell Factories, January 14, 2013 available online here; “A Global Fermentation Approach,” Leaf by Lesaffre available online here; “Specialty Enzymes Market Worth $6.6 Billion by 2025,” MarketsandMarkets Press Release, April 20, 2020 available online here.
Image source: habelfrank, “washing-powder-detergent-1500058,” PIxabay, July 7, 2016 available online here.

Enzymes are proteins that act as catalysts. Enzymes in the body run cellular processes and convert food to energy and to building blocks for proteins, lipids, nucleic acids, and some carbohydrates. Industrial enzymes such as proteases, amylases, lipases, and others are used in various applications: in the food and beverage industry, in detergents, animal feed, biofuels, textiles, pulp and paper, nutraceuticals, personal care products and cosmetics, wastewater treatment, and medications. In 2018, 60% of industrial enzymes on the market were proteases. In Europe, 900 tons of protease enzymes are used for detergents alone every year.

Today’s market size shows the global enzyme revenues for 2019 and projected for 2027. Microorganism-based enzymes comprised the vast majority of the industrial enzyme market in 2019, about 85%, followed by animal-based and plant-based enzymes. Microorganisms are preferred as a source due to their more predictable and controllable enzyme content. This type of enzyme can also be produced in a cost-effective manner with less space and time necessary than animal-based or plant-based enzymes. There are three types of microorganism-based enzymes: bacterial, fungal, and yeast. Bacterial enzymes are mostly sourced from Bacillus. They’re used in food and detergent and in pharmaceutical applications to diagnose diseases, promote wound healing, and kill disease-causing microorganisms. Fungal enzymes are used in the preparation and production of soy sauce, beer, baked goods, processed fruits, and dairy products. Yeast is used in beer, baked goods, and industrial ethanol production.

Increased investment in biotechnology research for the development of specialty enzymes for medicinal and diagnostic purposes is one of the main factors driving product demand globally. Increasing demand from the food and beverage, biofuel, animal feed, and home cleaning sectors along with the growing consumption of functional foods will contribute to the growth in the market through 2027. By region, growing biofuel production in North America and Europe, as well as increasing meat production in Europe and the Russian Federation, are expected to contribute to growth in these regions. Enzymes are used extensively in meat processing to improve the tenderness of the meat. Europe was third behind China and North America in meat production in 2018. The top three companies in this industry—Novozymes, DuPont Danisco, and DSM— claimed more than 75% of the market in 2019.1 Other major companies in this industry include BASF SE, Associated British Foods PLC, Chr. Hansen Holding A/S, and Advanced Enzyme Technologies.

1 Source: Grand View Research. The press release from CISION PR Newswire mentioning the same Grand View Research report states that the top 3 companies are Novozymes, DuPont Danisco, and BASF SE.

E-Pharmacies

e-pharmacies
E-pharmacies, also known as online pharmacies or mail-order pharmacies, are pharmacies that conduct business over the internet through a website or secure web portal. They send orders of both prescription and non-prescription drugs to customers via the mail or through shipping companies. In 2018, the majority of revenues at e-pharmacies came from over-the-counter medications.

In the United States, legitimate e-pharmacies require a valid prescription from a doctor or other health care professional before dispensing prescription drugs. They are licensed by the appropriate state agency and have a licensed pharmacist available to answer questions. They must also provide a street address. In many cases, e-pharmacy services are part of a person’s health insurance benefits. For example, OptumRx, Express Scripts, and CVS Caremark are affiliated with the UnitedHealth Group, Cigna, and Aetna health insurance companies, respectively.

Because prescription drug prices are high, some people turn to illegal pharmacies. Illegal pharmacies may send an unsolicited email offering medicine at a deep discount. These pharmacies are not licensed and allow people to buy prescription medication without a valid prescription from a health care provider. Buying pharmaceuticals from these types of businesses is risky. The medicines ordered may have too much or too little of the active ingredient, not contain the right active ingredient or contain harmful ingredients. An estimated 10% of medications available worldwide are counterfeit. In India and developing countries in Africa, Asia, and Latin America more than 30% are.

The European Medicines Agency is currently warning consumers to avoid online pharmacies that falsely claim that a product they sell can treat or prevent COVID-19. The U.S. Food and Drug Administration (FDA) and the Federal Trade Commission issued warnings to 7 companies and shut down dozens that claimed their products do the same. Currently, there are no approved medications to treat or prevent COVID-19 and there are no vaccines available.

Today’s market size shows worldwide e-pharmacy revenues for 2018 and projected for 2025.1 In 2018, 11% of adult pharmacy customers obtained their prescriptions from e-pharmacies. Since the outbreak of the COVID-19 pandemic, some online pharmacies have been seeing a surge in orders as people decide to avoid public places such as brick-and-mortar pharmacies and instead order their medications online. Whether these new e-pharmacy consumers will continue to order their medication in this way once the pandemic is over and life returns to normal is yet to be seen.

North America is the largest market for e-pharmacies and is expected to continue to be through 2025 due to the growing number of internet users coupled with their familiarity with using online services. A growing awareness of e-pharmacies, especially ones affiliated with large companies, as well as government campaigns meant to educate consumers about how to spot illegal e-pharmacies are also expected to contribute to North America’s domination of the market. Leading global e-pharmacy companies include The Kroger Co., The Walgreen Co., Express Scripts Holding, CVS Health, Doc Morris, Giant Eagle, Wal-Mart Stores, OptumRx, 1mg, and Netmeds.

1 Revenues are for legal businesses only.

Geographic reference: World
Year: 2018 and 2025
Market size: $42.32 billion and $107.53 billion, respectively
Sources: “Global Share of E-Pharmacy Market Size to Surpass USD 107.53 Billion by 2025,” Zion Market Research Press Release, July 26, 2019 available online here; “Online Pharmacy,” Wikipedia, March 7, 2020 available online here; “How to Buy Medicines Safely From an Online Pharmacy,” U.S. Food and Drug Administration, January 25, 2018 available online here; Hannah Balfour, “EMA Warns Consumers About Falsified COVID-19 Drugs from Online Pharmacies,” European Pharmaceutical Review, March 31, 2020 available online here; Hannah Balfour, “FDA and FTC Issue Warning Letters to Companies Selling Fraudulent COVID-19 Products,” European Pharmaceutical Review, March 10, 2019 available online here; András Fittler, PharmD, PhD, et. al., “Consumers Turning to the Internet Pharmacy Market: Cross-Sectional Study on the Frequency and Attitudes of Hungarian Patients Purchasing Medications Online,” Journal of Medical Internet Research, August 22, 2018 available online here; Matt Baron, “COVID-19 Sparks Surge in U.S. Online Pharmacy Purchases,” Patch, April 3, 2020 available online here.
Image source: National Cancer Institute, “A Male Pharmacist is Examining a Drug from the Pharmacy Inventory,” Unsplash, January 29, 2020 available online here.

Digestive Health Supplements

Digestive health supplements

Soft drinks, potato chips, candy, fast food. Tasty, yes. But also high in fat, added sugar and salt. Some researchers believe that a diet high in these types of food, along with a diet of highly processed foods, can be a factor in the development of digestive disorders. Other top factors include smoking, pollution, and genetics.

As consumers become aware that gut health contributes to overall health, demand for digestive health supplements is predicted to increase. Probiotics, prebiotics, enzymes, and fulvic acid are some types of digestive health supplements. Probiotics, prebiotics, and enzymes can also be found in some types of food, food which also contains many beneficial nutrients.

Probiotics are live bacteria and yeasts that are beneficial for the digestive system. They are found in foods such as yogurt,1 kefir, unpasteurized sauerkraut, and kimchi. Probiotic supplements are used to treat antibiotic-associated diarrhea in adults and infectious diarrhea in infants and children. They are also given to people with Crohn’s disease, ulcerative colitis, and irritable bowel syndrome to help them maintain remission of their disease. Supplements contain various strains of probiotics, depending on the brand. Some popular brands of over-the-counter probiotic supplements that have been tested for use with gastrointestinal disorders include Align (Bifidobacterium infantis 35624), Culturelle (L. rhamnosus GG), and Florastor (Saccharomyces Boulardii).2 

Prebiotics are a type of plant-based fiber that the human body cannot digest. Prebiotics provide food for probiotics; together they maintain a healthy colony of bacteria and microorganisms in a person’s gastrointestinal tract. Prebiotics can be found in fruits, vegetables, and whole grains. Apples, garlic, onions, asparagus, barley, and oats are some foods that contain prebiotics. Most people get enough prebiotics in their diet if they eat a variety of fruits, vegetables, whole grains, and fermented foods, but for those that don’t, prebiotic supplements may be beneficial. Some popular brands of prebiotic supplements include Benefiber, Metamucil, and Fiber Choice.

Digestive enzymes break down food so that a person can absorb its nutrients. A majority of digestive enzymes are manufactured in the pancreas. Lipase breaks down fats. Amylase breaks down carbohydrates. Proteases and peptidases break down proteins. Doctors prescribe digestive enzyme supplements to people with cystic fibrosis, chronic pancreatitis, and pancreatic cancer. These conditions cause a person’s digestive enzyme levels to be low. Over-the-counter digestive enzyme supplements include lactase supplements to break down lactose, the sugar in dairy products, and alpha-galactosidase supplements, to break down the complex carbohydrates in foods such as beans, broccoli, cabbage, and cauliflower. Lactaid and Beano are two popular brands of these types of digestive enzymes, respectively.

Fulvic acid has been used in traditional Indian medicine for 3,000 years. Shilajit, a tar-like substance found in the Himalayas, Caucasus mountains, Altai Mountains and the mountains of Gilgit Baltistan, is created from the decomposition of plants. It contains soil-based organisms and is composed of 15-20% fulvic acid. Some believe that ingesting fulvic acid supplements such as shilajit can improve a person’s gut flora to treat such conditions as small intestinal bacterial overgrowth, irritable bowel syndrome, leaky gut, chronic constipation, and diarrhea. It’s believed that poor gut health caused by oxidative stress leads to chronic inflammatory diseases. As an antioxidant, fulvic acid is thought to counteract the oxidative stress.

Today’s market size shows the total global revenue for digestive health supplements in 2018 and projected for 2025. In Japan, the incidence of ulcerative colitis alone increased from 8 cases per 100,000 people in 1985 to 64 cases per 100,000 in 2005. In the United States, 60-70 million people are afflicted with digestive diseases according to the National Institute of Diabetes and Digestive and Kidney Diseases. The growing prevalence of digestive disorders in Japan, the United States, and several European countries has contributed to the increased demand for digestive health supplements. This is projected to continue through 2025. In the United States, probiotics constitute an overwhelming share of the digestive health supplement market. Currently three-quarters of the supplements sold are in the form of tablets and capsules, however; powdered supplements are expected to gain in popularity in the coming years due to consumer interest in organic ingredients and the convenience of being able to add powdered supplements to the foods they eat. Also, powdered supplements can be absorbed by the body faster. Nearly a third of the supplements sold worldwide in 2018 were manufactured in Italy, Japan, and the United States. Top manufacturers of digestive health supplements include Bayer AG, Amway, Nature’s Bounty Co., and NOW Foods, among others.

1 Manufacturers of some brands of yogurt add additional probiotics to their product. Two such brands are Activia and Danactive.
2 Any mention of brands in this post does not constitute an endorsement. The strain of probiotic in the product is included within the parentheses.

Geographic reference: World
Year: 2018 and 2025
Market size: $8.67 billion and $15.67 billion, respectively
Sources: “Digestive Health Supplements Market Size, Share & Trends Analysis Report by Product (Prebiotics, Probiotics, Enzymes), by Form, by Distribution Channel (OTC, Prescribed), by Region, and Segment Forecasts, 2019 – 2025,” Grand View Research Report Summary, October 2019 available online here; “Digestive Health Supplements Market Size Worth $15.67 Billion by 2025: Grand View Research, Inc.,” CISION PR Newswire, October 23, 2019 available online here; Ames Gross, “Gastrointestinal Diseases Rise in Asia,” MedTech Intelligence, January 22, 2016 available online here; Hrefina Palsdottir, “11 Probiotic Foods That Are Super Healthy,” Healthline, August 28, 2018 available online here; Matthew A. Ciorba, “A Gastroenterologist’s Guide to Probiotics,” Clinical Gastroenterology and Hepatology, U.S. National Library of Medicine, National Institutes of Health, September 2012 available online here; Arlene Semeco, “The 19 Best Prebiotic Foods You Should Eat,” Healthline, June 8, 2016 available online here; “Gut Reaction: A Limited Role for Digestive Enzyme Supplements,” Harvard Health Letter, Harvard Health Publishing, Harvard Medical School, March 2018 available online here; Zawn Villines, “What is the Difference Between Prebiotics and Probiotics?” Medical News Today, October 29, 2018 available online here; Joanne Slavin, “Dietary Fiber: The Prebiotic Connection,” Clinical Advisor, April 20, 2015 available online here; Angela Stringfellow, “The Best Fiber Supplements (2019 Reviews),” Family Living Today, January 9, 2019 available online here; Janet Renee, “About the Enzyme Alpha Galactosidase,” Livestrong.com available online here; “Should You Take Probiotics?” Harvard Health Letter, Harvard Health Publishing, Harvard Medical School, April 2015 available online here; John Winkler and Sanjoy Ghosh, “Therapeutic Potential of Fulvic Acid in Chronic Inflammatory Diseases and Diabetes,” Journal of Diabetes Research, U.S. National Library of Medicine, National Institutes of Health, September 10, 2018 available online here; “Digestive Diseases Statistics for the United States,” National Institute of Diabetes and Digestive and Kidney Diseases, November 2014 available online here; “Shilajit,” Wikipedia, November 6, 2019 available online here.
Image source: Efraimstochter, “dietary-supplements-pills-3512184,” Pixabay, July 3, 2018 available online here.

Rose Oil

rose oil infused cream

Rose oil, as the name implies, is oil from the rose plant, specifically oil extracted from rose petals. Typically it takes 3,000 grams of rose petals to extract one gram of rose oil. Because of this, it is expensive. Damask rose, cabbage rose, and the white rose of York are the most common varieties from which the oil is extracted. These varieties have strong aromas and have high oil content. Damask rose is commonly grown in Bulgaria, Syria, Turkey, Russia, Pakistan, India, Uzbekistan, Iran, and China. Cabbage rose grows in Morocco, France, and Egypt. The white rose of York has been cultivated in Europe for hundreds of years.

Today’s market size shows the total global revenues for rose oil in 2018 and projected for 2025. This product is used in fragrances, cosmetics, pharmaceuticals, food, and beverages. The fragrance and cosmetics sectors combined constituted 70.1% of the market in 2018. Consumer demand for natural and organic products will fuel growth in this industry as manufacturers replace synthetic ingredients with natural ones. Rose oil’s antimicrobial and anti-bacterial properties are expected to continue to interest the pharmaceutical sector increasing demand for the product.

Europe had the largest share of the market, by value, in 2018, 40.2%. Europe is also the largest market for natural fragrance ingredients. The Asia Pacific region is expected to have the highest compounded annual growth rate, 8.0%, between 2018 and 2025 due to rising sales of pharmaceutical products overall in China, Australia, India, and Japan. The use of herbal medicines to treat various skin conditions in this region is expected to increase demand for this oil also. Some top manufacturers include Sigma-Aldrich, Inc.; Ernesto Ventos SA; Alteya Organics, LLC; Givaudan SA; and Firmenich International SA; among others.

Geographic reference: World
Year: 2018 and 2025
Market size: $278.7 million and $442.0 million, respectively
Sources: “Rose Oil Market Size, Share & Trends Analysis Report by Application (Fragrance & Cosmetics, Pharmaceuticals, Food & Beverages), by Product (Organic, Conventional), and Segment Forecasts, 2019 – 2025,” Grand View Research Press Release, September 2019 available online here; “Rose Oil Market Size Worth $442.0 Million by 2025 | CAGR: 6.8%: Grand View Research, Inc.,” Cision PR Newswire Press Release, September 12, 2019 available online here; “Rose Oil,” Wikipedia, August 2019 available online here; Cathy Wong, “The Health Benefits of Rose Oil,” VeryWell Health, September 4, 2019 available online here; “Rosa x alba,” Wikipedia, June 2019 available online here.
Original source: Grand View Research
Image source: silviarita, “flower-rose-cream-petal-skin-care-3141777,” Pixabay, Feburary 9, 2018 available online here.

Irritable Bowel Syndrome Treatments

irritable bowel syndrome treatments

Irritable bowel syndrome (IBS) is a chronic disease that affects the large intestine. People with this disease experience cramping, abdominal pain, bloating, gas and diarrhea or constipation, or alternating bouts of diarrhea and constipation. Unlike inflammatory bowel diseases such as ulcerative colitis or Crohn’s disease, IBS does not cause changes in bowel tissue, and sufferers are not at increased risk of contracting colon cancer.

Currently, a precise cause for this disease is not known, but it may be due to be a faulty interaction between the brain, the nervous system, and the gut. An overactive immune system may also be to blame in those sufferers who have increased numbers of immune-system cells in their intestines or those whose IBS developed after a severe bout of gastroenteritis brought on by a bacterial infection or virus.

Globally, 10-15% of the population has this disease, most under the age of 50. Symptoms of IBS can be triggered by stress and certain foods such as wheat, dairy products, cruciferous vegetables, and carbonated drinks. More women than men have IBS; in the United States, 2 out of 3 patients are women. Many women with this disease report worsening of symptoms around the time of their menstrual periods, indicating that hormonal changes may also be a trigger in some people.

In the United States, 25-45 million people suffer from IBS. Because signs and symptoms can indicate many different conditions, doctors have trouble diagnosing this disease. According to a survey by IFFGD,1 a diagnosis of IBS typically takes more than 6 years after the onset of symptoms. Globally, 40% of patients have mild IBS, 35% a moderate form of the disease, and 25% a severe form. While IBS can affect a person’s emotional, physical, social and financial well-being no matter how mild or severe the symptoms, most patients taking prescription medication for their symptoms have moderate to severe IBS.

Today’s market size shows the worldwide irritable bowel syndrome treatment revenues for 2018 and projected for 2026. Growth in the market is expected over this time period due to a growing prevalence of the disease, especially IBS-C,2 and doctors increasingly prescribing medications to treat it. Several new drugs to treat this disease, currently in clinical trials, are expected to come to market in the coming years. Pharmaceutical companies are also expanding their product offerings in several regions of the world. In January 2019, Ironwood Pharmaceuticals and AstraZeneca received approval to market Linzess, a treatment for IBS-C, in China, enabling them to sell their product to potentially tens of millions of more patients. In addition to Linzess, other leading brand-name treatments include Xifaxan, Viberzi, and Amitiza.3 Linzess/Constella4 generated the largest revenue in 2018. Some major manufacturers of IBS treatments include Ironwood Pharmaceuticals, Inc.; Allergan; Astellas Pharma, Inc.; Takeda Pharmaceutical Co. Ltd. AstraZeneca; and Sebela Pharmaceuticals Inc.

1 International Foundation for Functional Gastrointestinal Disorders
2 Constipation-predominant IBS
3 Xifaxan and Viberzi treat IBS-D, diarrhea-predominant IBS. Amitiza treats IBS-C.
4 Linzess is marketed as Constella in Europe.


Geographic reference: World
Year: 2018 and 2026
Market size: $1.5 billion and $3.4 billion, respectively
Sources: “Irritable Bowel Syndrome Treatment Market Size, Share & Analysis Report by Type (IBS-C, IBS-D), by Region, and Segment Forecasts, 2019-2026,” Grand View Research Report Summary, July 2019 available online here; “Irritable Bowel Syndrome Treatment Market Size Worth Around US$ 3.4 Bn by 2026,”Acumen Research and Consulting Press Release, July 16, 2019 available online here; and “Irritable Bowel Syndrome,” Mayo Clinic, March 17, 2018 available online here.
Image source: newsong, “pill-medicine-capsule-illness-pain-3264951,” Pixabay, March 27, 2018 available online here.

Injectable Cosmetic Treatments

injectable cosmetic treatments syringe

The two most popular types of minimally-invasive cosmetic treatments in the United States are botulinum toxin type A and soft tissue filler injections. Both are used to temporarily reduce or eliminate wrinkles. Botulinum toxin type A — commonly known as Botox, but other brand names include Dysport and Xeomin — is a neurotoxin derived from bacteria. It blocks nerve signals to the muscle in which it’s injected. The muscle is unable to contract thereby eliminating wrinkles. It’s most commonly used to smooth frown lines, forehead creases, and crows feet. Soft tissue fillers, also known as dermal fillers, are gel-like substances injected under the skin to smooth out wrinkles. They’re also used to enhance lips and improve symmetry among facial features. The U.S. Food and Drug Administration has approved several types of fillers: hyaluronic acid, calcium hydroxylapatite, poly-l-lactic acid, and polymethylmethacrylate. Hyaluronic acid and calcium hydroxylapatite are naturally found in skin and bones, respectively. Poly-l-lactic acid and polymethylmethacrylate are synthetic, biocompatible substances. Some brand names include Juvéderm, Radiesse, Sculptura, and Bellafill.

Today’s market size shows the amount spent on injectable cosmetic treatments in 2016 and forecast for 2025 worldwide. In the United States, more than 10 million injectable cosmetic treatments were performed in 2018. Botulinum toxin type A procedures were the most popular; 7.4 million were performed, up 5.4% from 2016. Nearly 2.7 million soft tissue filler procedures were performed in 2018, a 2.9% increase from 2016. While women still comprise the vast majority of patients, globally an estimated 15% of injectable cosmetic treatments are performed on men.

Geographic reference: World
Year: 2016 and 2025
Market size: $6.5 billion and $17.2 billion, respectively
Sources: “Facial Injectables Market Analysis by Product (Collagen, Hyaluronic Acid, Botulinum Toxin Type A, Calcium Hydroxylapatite, Polymer Fillers), by Application (Aesthetics, Therapeutics), by Region, and Segment Forecasts, 2018 – 2025,” Grand View Research Press Release, May 2017 available online here; “Global Facial Injectables Market Size Worth $17.2 Billion By 2025,” Grand View Research Press Release, May 2017 available online here; 2018 National Plastic Surgery Statistics, American Society of Plastic Surgeons, March 2019 available online here; 2017 Plastic Surgery Statistics Report, American Society of Plastic Surgeons, 2018 available online here; “What Is Botulinum Toxin Type A?” American Society of Plastic Surgeons available online here; “Hold Still,” The Economist, February 9, 2019, page 22; “Injectable Fillers Guide,” American Board of Cosmetic Surgery available online here.
Image source: qimono, “syringe-shot-medicine-bottle-1884758,” Pixabay, December 6, 2016 available online here.

Radiopharmaceuticals

radiopharmaceuticals technetium injection

Radiopharmaceuticals are medicinal products containing radioactive isotopes. Radiopharmaceuticals can be swallowed, injected or inhaled and are selected based on the type of tissue or organ that will be scanned or treated. In the manufacturing process, radioactive isotopes and organic molecules bond. It is the organic molecules that transport the radioisotopes to specific tissue or organs. Of the more than 10 million nuclear medicine procedures performed in the United States every year, 85% use the radioisotope technetium-99m.

For diagnostics, after the radiopharmaceutical is administered, the patient’s tissue or organ is scanned using a SPECT or PET scanner,1 allowing the doctor to detect changes at the cellular level. Radiopharmaceuticals are helpful in diagnosing various diseases of the blood vessels, bones, brain, kidney and liver as well as detecting heart disease, heart muscle damage and cancer.

Radioisotopes for diagnosis emit radiation that can be detected outside the body by scanners. Radioisotopes for treatment emit all their energy in a small area; therefore, they’re used for localized destruction of cancer cells. They are also used to treat hyperthyroidism and pain as a result of bone cancer and severe arthritis.

Today’s market size shows the amount spent on radiopharmaceuticals globally in 2018 and forecast for 2023. More than 100 radiopharmaceuticals have been developed using radioisotopes produced by nuclear research reactors or cyclotrons. As of the end of 2018, fifty FDA-approved radiopharmaceuticals were used for the diagnosis and treatment of medical ailments in the United States. GE Healthcare, Curium, Lantheus Medical Imaging, DRAXIMAGE, and Pharmalucence are 5 of the 18 manufacturers of these approved products.2

1 SPECT stands for single photon emission computed tomography. PET stands for positron emission tomography. Often these scans are combined with CT or MRI scans to provide more detailed images.
2 Top 5 based on the number of different FDA-approved radiopharmaceuticals the company manufactures.

Geographic reference: World
Year: 2018 and 2023
Market size: $3.95 billion and $5.26 billion, respectively
Sources: “Radiopharmaceuticals/Nuclear Medicine Market by Type (Diagnostic (SPECT (Technetium), PET (F-18)), Therapeutic (Beta Emitters (I-131), Alpha Emitters, Brachytherapy(Y-90))), Application (Oncology, Thyroid, Cardiology) – Global Forecasts to 2023,” MarketsandMarkets Press Release, Accessed February 18, 2019 available online here; “FDA-Approved Radiopharmaceuticals,” Cardinal Health, December 28, 2018 available online here; Phillippe van Put, “What Is Nuclear Medicine?” available online here; “Radiopharmaceutical (Oral Route),” Mayo Clinic available online here; “Radiopharmaceutical Production,” International Atomic Energy Agency available online here; “Nuclear Medicine,” National Institute of Biomedical Imaging and Bioengineering, July 2016 available online here; Haley Hansen, “Niowave Enters $4 Billion Medical Isotope Market,” Lansing State Journal, February 18, 2019, pages 1A and 4A; Dr. Craig Hacking and Dr. Ayush Goel, et. al., “SPECT vs. PET,” Radiopaedia available online here.
Image source: Bionerd [CC BY-SA 3.0], via Wikimedia Commons. No alterations were made to image.

Medical Marketing

Does it seem like you’re seeing more ads for prescription medications and medical services? You’re not imagining it. In 2016, the last year for which data were available, pharmaceutical companies alone bought 4.6 million direct-to-consumer ads, up from 79,000 ads in 1997. Spending increased nearly six-fold, from $1.3 billion to $6.0 billion during this time period. Total medical services advertising expenditures grew at a similar rate, led by cancer centers, mental health and addiction services, and cosmetic surgery services.

According to PhRMA, the largest pharmaceutical trade group in the U.S., direct-to-consumer advertising provides “scientifically accurate information to patients so that they are better informed about their health care and treatment options.”1 Around half of the consumers in a 2015 analysis by the U.S. Food and Drug Administration believed these ads did not contain enough information about the medications’ risks and benefits to be of use. That year, the American Medical Association (AMA) called for a ban on pharmaceutical and medical device advertising, saying that ads such as these encourage consumers to seek out more expensive treatments when less expensive, more appropriate, effective alternatives may be available. In addition, the AMA was concerned that increased spending on advertising led to higher prescription drug prices. Banning such advertising would not be easy, even if Federal lawmakers agreed that such a ban should take place. Several court cases throughout the years determined that this type of advertising is protected by the United States Constitution.

Today’s market sizes show total medical marketing spending and spending on a subset of that, direct-to-consumer advertising, in 1997 and 2016. Medical marketing includes advertising of prescription drugs, health services, and laboratory testing. It also includes disease awareness campaigns. Marketing to health care professionals by pharmaceutical companies accounted for most of the spending during this time period. However, as a percentage of total spending, this has been dropping. In 1997, 88.1% of medical marketing dollars were spent on free samples, direct physician payments for such things as speaking engagements and meals, and prescriber detailing, in which pharmaceutical sales representatives educate physicians about their products. In 2016, 67.9% of marketing dollars were spent this way. Direct-to-consumer marketing comprised the balance.

1 PhRMA spokesperson Tina Stow. Source: Susan Kelly, “U.S. Doctor Group Calls for Ban on Drug Advertising to Consumers,” Reuters, November 17, 2015, available online here

Geographic reference: United States
Year: 1997 and 2016
Market size: (Total) $17.7 billion and $29.9 billion, respectively
Market size: (Direct-to-consumer advertising) $2.1 billion and $9.6 billion, respectively
Sources: Lisa M. Schwartz, MD, MS and Steven Woloshin, MD, MS, “Medical Marketing in the United States, 1997-2016,” JAMA, Special Communication, January 1-8, 2019 available online here; Susan Kelly, “U.S. Doctor Group Calls for Ban on Drug Advertising to Consumers,” Reuters, November 17, 2015, available online here; Alison Kanski, “7 Things to Know from Dartmouth’s Medical Marketing Study,” MM&M, January 14, 2019 available online here; Margaret Rouse, “Pharmaceutical Detailing,” TechTarget, February 2011 available online here.
Image source: Martin Brosy, “Doctor with a Stethoscope,” Unsplash, July 30, 2018 available online here.

Pharmacy Benefit Managers

The cost of prescription drugs in the United States is a subject about which there is much controversy. As the Affordable Care Act—or, Obamacare—gets off to a rocky start across the nation, we decided to look at just one small part of the prescription drug distribution network, about which most people are not particularly conscious. That is the segment made up of Pharmacy Benefit Managers (PBMs), middlemen who stand in a central position in the prescription drug supply chain and who, it turns out, have carved out for themselves a rather lucrative business. The three largest PBMs—Express Scripts, CVS Caremark, and OptumRx—together control about 70% of all prescriptions filled in the United States.

PBMs are firms that provide an administrative service to insurance companies, large self-insured employers, and government benefit providers. They develop and maintain drug formularies—lists of specific drugs to be covered and the prices for each—for their insurance providing customers. They also negotiate with pharmaceutical companies for preferred pricing on the drugs covered in those formularies and they negotiate with retailers to accept those terms and participate in the PBM’s network of preferred pharmacies.

According to an article in Fortune magazine, “PBMs started as paper pushers: They began hand-processing medical claims in the 1970s and evolved into middlemen who touted their ability to use corporate customers’ combined purchasing power to negotiate huge discounts from pharmaceutical companies. Today the top PBMs are as big as or bigger than their clients.” The United States has a unique health care delivery system, one which is significantly fuller of lucrative middleman-businesses than the systems present in other industrialized nations.

Today’s market size is the total estimated revenue earned by Pharmacy Benefit Managers in the United States in 2012.

Geographic reference: United States
Year: 2012
Market size: $250 billion
Source: Katherine Eban, “Painful Prescription,” Fortune, October 28, 2013, pages 202-207.
Original source: J.P. Morgan analysts
Posted on November 4, 2013

The Sleep Business

In 2012, approximately three-fourths of internet users searched online for health information. Half of them searched specifically for sleep remedies. According to the National Sleep Foundation, only 56% of Americans report getting a “good night’s sleep” on a typical night. Some sleep studies have found a link between insufficient sleep and hypertension, depression, diabetes, and other illnesses. Spending related to sleep has increased 8.8% yearly since 2008. Spending on over-the-counter sleep aids increased 31% from 2006 to 2011, with the biggest increase being spending on natural and homeopathic products.

Today’s market size is the estimated amount spent in the United States, in 2012, on things designed to aid sleep, from pills and medical devices to sleep consultants who work with hospitals and deluxe mattresses made with tension-relieving foams.

Wishing all our readers a sound night’s sleep!

Geographic reference: United States
Year: 2012
Market size: $32 billion
Source: Kit Yarrow, “The Sleep Industry: Why We’re Paying Big Bucks for Something That’s Free,” Time, January 28, 2013, available online here.
Posted on March 1, 2013

Cuban Imports

On the whole the United States has been a supporter and booster of free trade and globalization since the end of the second World War and with increased energy since the 1990s. Yet with one neighboring country, Cuba, trade relations have been unusual. The frictions in trade between the United States and Cuba date back to the 1950s and the Cuban Revolution, followed by a forty-year trade embargo imposed by the United States. In 2000, President Clinton signed the Trade Sanctions Reform and Export Enhancement Act which opened the door for some restrictive trade with Cuba, specifically, U.S. exports of farm and forestry products and some medicines. The act did not open the door for any imports from Cuba.

Today’s market size is the total value of products exported from the United States to Cuba in 2000, 2008, and 2011. The drop in exports from 2008 to 2011 is largely the result of the fact that under the restrictions imposed on this trade, Cuba is required to pay in advance for all U.S. imports in cash, something that became much harder as the financial crisis of 2008 took hold. By way of placing this level of international trade into perspective, according to CIA estimates, Cuba’s imports in 2011, from all over the world, totaled $14 billion.

Geographic reference: United States and Cuba
Year: 2000, 2008, 2011
Market size: $1.3, $711.5, and $363.3 million
Source: “2011 Exports of NAICS Total All Merchandise,” and interactive, online data resource published by the International Trade Administration and available online here. “The World Factbook,” entry on Cuba, published by the U.S. Central Intelligence Agency and make available online here.
Original source: ITA (U.S. Department of Commerce, International Trade Administration) and the CIA
Posted on January 11, 2013

Bioinformatics

Over the last decade bioinformatics has been characterized by the mapping of many genomes. This has fueled explosive growth in the field generally, growth which is anticipated to continue into the future.

Bioinformatics, in the most basic sense, is the application of information technology to the life sciences to increase the understanding of biological and chemical processes. It is the study of the methods for storing, retrieving and analyzing biological data, a wealth of which is growing rapidly and thus feeding demand for more bioinformatics. Fields that benefit from the output of bioinformatics are many, including especially agricultural biotechnology, pharmaceutical research and development, and medical and clinical diagnostics.

Today’s market size is the estimated value of this hybrid industry in 2012 and a projected value for 2018.

Geographic reference: World
Year: 2012 and 2018
Market size: $2.3 billion and $9.1 billion respectively
Source: “Global Bioinformatics Market is Expected to Reach USD 9.1 Billion in 2018: Transparency Market Research,” The Herald, November 28, 2012, a link to which is here.
Original source: Transparency Market Research, whose study on this industry may be purchased on their website here.
Posted on November 28, 2012

Growing Market for Epinephrine

Anyone with a child in school these days is likely to be very aware of the growing concerns related to food allergies. In many elementary schools in the United States, special tables in the lunch room are set aside for children whose lunches contain any nuts, like the traditional peanut butter and jelly sandwich. In some schools, foods containing nuts of any kind are banned entirely. This is because of a rising number of children who suffer from food allergies, particularly nut allergies, and the rising severity of their allergic reactions.

Nut allergies have been the fastest growing food allergies in recent years. In 1997, approximately 278,000 children under the age of 18 in the United States (0.04% of the age group) suffered from an allergy to peanuts. In 2008, that number had risen to over a million (1.5% of children in the age group).

Today’s market size is the estimated number of children (under the age of 18 years) in the United States who suffer severe food allergies. It is a calculation based on a study that showed that one in thirteen children suffer food allergies and that nearly 40 percent of those children suffer severe allergic reactions, severe enough to require the use of a drug like epinephrine to combat the reaction and save their lives.

Geographic reference: United States
Year: 2010
Market size: 2.28 million
Source: Katie Thomas, “Tiny Lifesavers for a Growing Worry,” The New York Times, September 8, 2012, page B1. Population data used to calculate today’s market size are from “Table 1. Population by Sex and Selected Age Groups: 2000 and 2010,” Age and Sex Composition: 2010, May 2011, one of the Census Bureau’s reports on the 2010 Census of the United States, available here.
Original source: A study published in the journal Pediatrics and referenced in the source article listed above.
Posted on September 12, 2012

Pharmacy & Drug Stores

Drug Retailing

The sale of drugs, whether over-the-counter or prescription drugs, has been a healthy, growing business for a long time in the United States. The sale of these products through pharmacies and drug stores is the subject of our post today. The graph presents sales of these retailers over the period 1992–2010. The annual growth rate in sales over this period was 10.3%, a third faster than the economy as a whole, which grew at 7.2% annually.

Worth noting is the fact that over this same time period, the number of retail outlets selling drugs has increased as Big Box stores, grocery stores and others have gotten into the business of selling drugs with enthusiasm. Consequently, the role of pharmacies and drug stores in total drug sales has actually declined over this period.

Geographic reference: United States
Year: 2000 and 2010
Market size: $130.87 billion and $222.26 billion respectively
Source: Annual Retail Trade Survey 2009, and updates from the Monthly Retail Trade Reports from the same reporting series, U.S. Census Bureau, available online here.
Original source: U.S. Department of Commerce, Bureau of the Census
Posted on April 4, 2012

DTC Drug Advertising

Ad Spending

Direct-to-consumer (DTC) advertising of prescription drugs is a big business in the United States, as it is in New Zealand, the only other country in which this activity is legal. Anyone who watches TV for more than an hour or two a week will be more than familiar with the sorts of ads we are talking about, those that invariably end with an ominous list of potential side effects of the very drugs being pushed.

Until the late 1990s this advertising was quite limited by FDA regulations but in 1997 the FDA announced changes to those regulations (implemented in 1999) that freed up the pharmaceutical industry to start producing stylish ad campaigns for its most popular prescription drugs. The industry took full advantage, as the graph above clearly shows. Industry analysts suggest that the slowdown in spending starting in 2007 had more to do with the expiration of important brand name drugs (and their replacement with generics for which such spending is not done) than with the beginning of the recession.

Today’s market size is the amount spent by pharmaceutical companies on DTC prescription drug advertising in 2008.

Geographic reference: United States
Year: 2008
Market size: $4.57 billion
Source: For the data from 1989 through 2001: Francis B. Palumbo and C. Daniel Mullins, “The Development of Direct-to-Consumer Prescription Drug Advertising Regulations, Food and Drug Law Journal, Volume 57, Number 2, 2002. For the data from 2002 through 2005: Donahue Ph.D., Julie M., Marisa Cevasco, B.A. and Meredith B. Rosenthan, Ph.D., “A Decade of Direct-to-Consumer Advertising of Prescription Drugs,” The New England Journal of Medicine, August 16, 2007. For data from 2006 through 2008 the data are from Nielsen Media press releases.
Posted on January 20, 2012

Medical Marijuana

As of March 2011 there were laws in seven U.S. states that made it legal to sell and use marijuana for medicinal purposes. Those states were California, Colorado, Michigan, Montana, New Mexico, Oregon, and Washington. Four additional states and the District of Columbia are scheduled to open markets for medical marijuana before the end of 2011: Arizona, Maine, New Jersey and Rhode Island. The laws regulating the sale and use of marijuana in these states vary widely which makes tracking the market a complicated task. But as a fast growing market the motivation to track it is present and the task is made easier by the fact that marijuana is a highly regulated commodity and is therefore tracked carefully by most of the states in which its use for medical purposes is legal.

Today’s market size is the estimated value of marijuana sold legally in the United States. As a point of comparison, and according to the source, the sale of Viagra in the United States in 2010 was valued at $1.93 billion.

Geographic reference: Select states within the United States
Year: 2011
Market size: $1.7 billion
Source: Wayne Heilman, “Report: Medical Marijuana Sales to Reach $1.7B This Year,” The Gazette, Colorado Springs, March 24, 2011, available online here.
Original source: See Change Strategy and Medical Marijuana Markets