
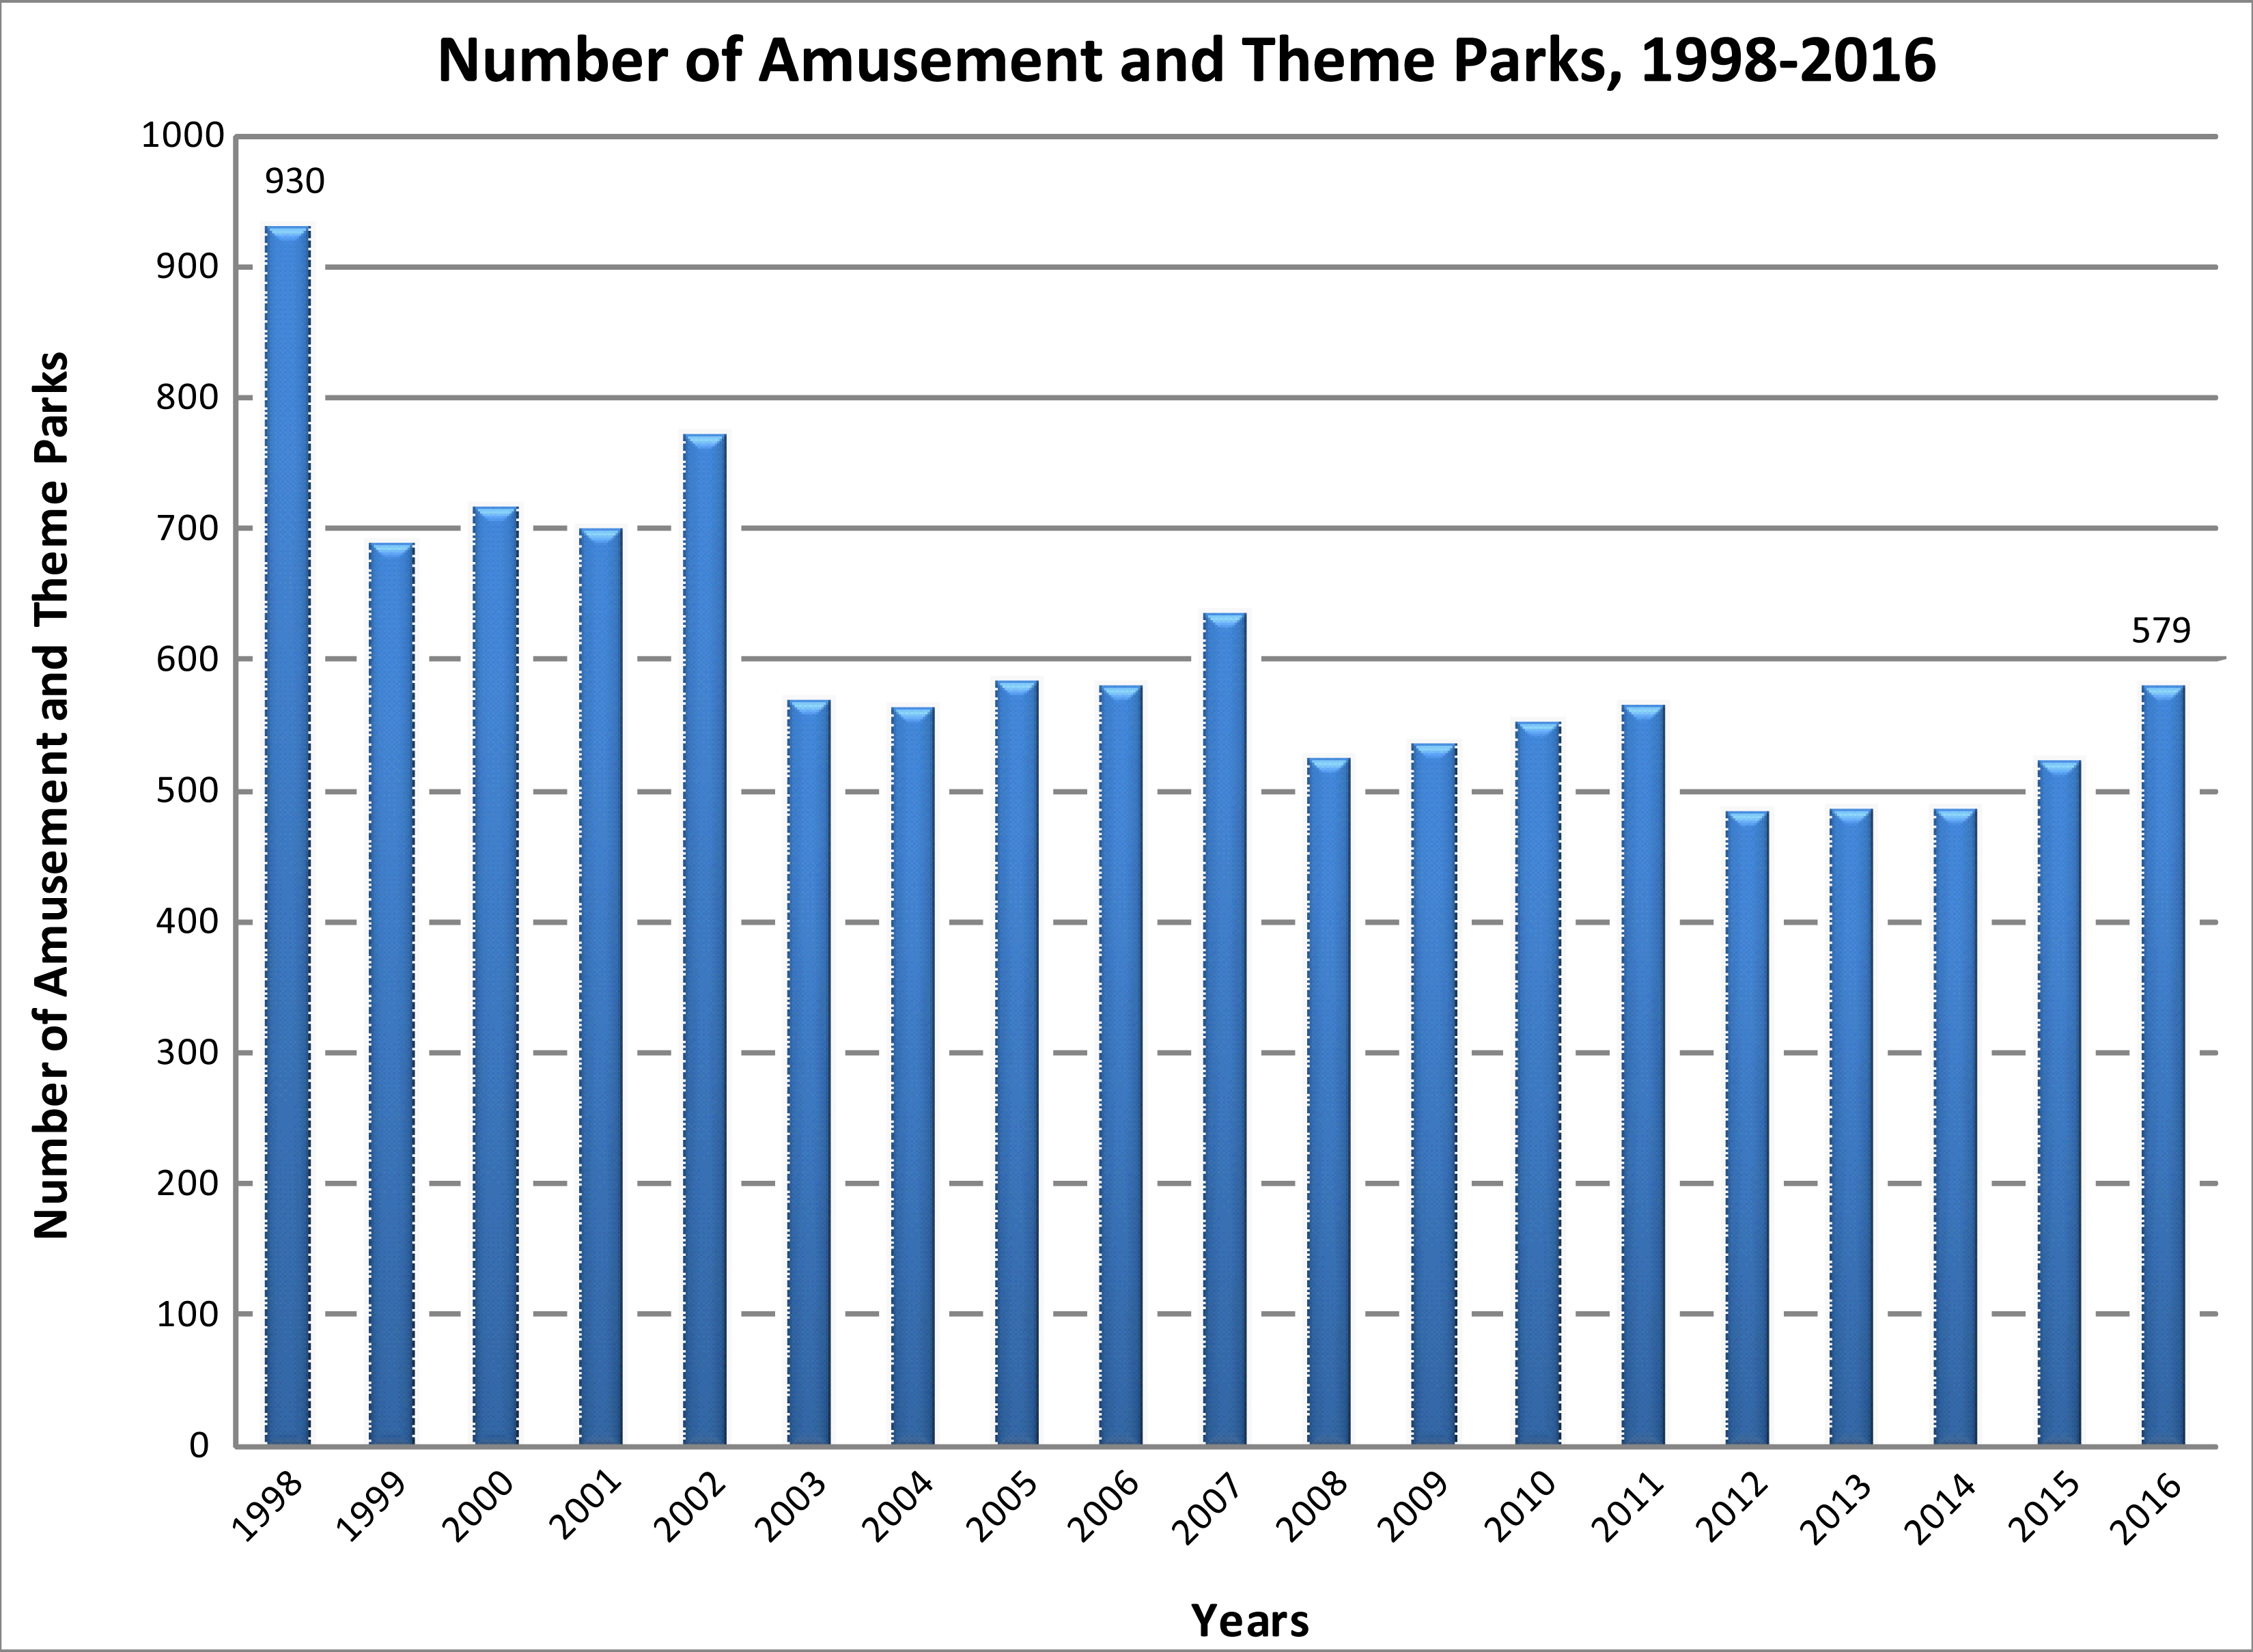
 Within the economic sector Arts, Entertainment and Recreation is the Amusement and Theme Park Industry. According to the U.S. Census Bureau “[t]his industry comprises establishments … primarily engaged in operating a variety of attractions, such as mechanical rides, water rides, games, shows, theme exhibits, refreshment stands, and picnic grounds. These establishments may lease space to others on a concession basis.” As the graph above shows (click graph to enlarge), the number of amusement and theme parks fluctuated from 1998 to 2016. Some years there were fewer than the previous year; some years there were more. However, overall the number trended downward. There were 37.7% fewer amusement and theme parks in 2016 than there were in 1998. Employment in this industry also fluctuated during this time period, but in this case, the trend was upward. There were 37.1% more people employed in this industry in 2016 than in 1998: 157,336 and 114,786 respectively.
Fewer amusement and theme parks employing more people would indicate that overall these parks were larger in 2016 than in 1998. In 1998, the top 3 states with the most amusement and theme parks were Florida (87), Texas (82) and California (81). By 2016, Texas had the most parks with 74, followed by Florida and California with 59 and 54 respectively. However, of these three states, Texas employed the fewest workers in this industry, 8,965; Florida the most, 58,187. In 1998, Florida also employed the most workers in this industry, 38,844, followed by California (31,330) and Texas (12,352). How much did employees earn? In 1998, the average yearly salary for an amusement and theme park worker was $16,378. In 2016, $26,427, a 61.4% increase. Adjusting for inflation, the increase was not as large, 11.3%, but still outpaced inflation.
Today’s market size shows the revenues amusement and theme parks in the United States earned in 1998 and 2016. Revenues increased 131.2% during this time period, or slightly more than 59% when adjusting for inflation.
Geographic reference: United States
Year: 1998 and 2016
Market size: $7.4 billion and $17.1 billion respectively
Sources: 2005, 2007, 2008, 2009, 2010, 2012, and 2016 Service Annual Survey, various publication dates available online here; County Business Patterns, various publication dates available online here; “Table B-3: Quantity and price indexes for gross domestic product, and percent changes, 1967-2017,” Economic Report of the President, February 2018 available online here; “2017 NAICS Definition: 713110 Amusement and Theme Parks,” North American Industry Classification System available online here.
Image source: Created in-house using data from County Business Patterns. Click graph to enlarge.